- Table of Content
- 1.Just one year ...
- 2.PROBA2 Observa...
- 3.Review of sola...
- 4.The Internatio...
- 5.The SIDC space...
- 6.Geomagnetic Ob...
- 7.Review of iono...
2. PROBA2 Observations (3 Sep 2018 - 9 Sep 2018)
3. Review of solar and geomagnetic activity
4. The International Sunspot Number
5. The SIDC space weather Briefing
6. Geomagnetic Observations at Dourbes (3 Sep 2018 - 9 Sep 2018)
7. Review of ionospheric activity (3 Sep 2018 - 9 Sep 2018)
Just one year ago: Remembering NOAA 2673
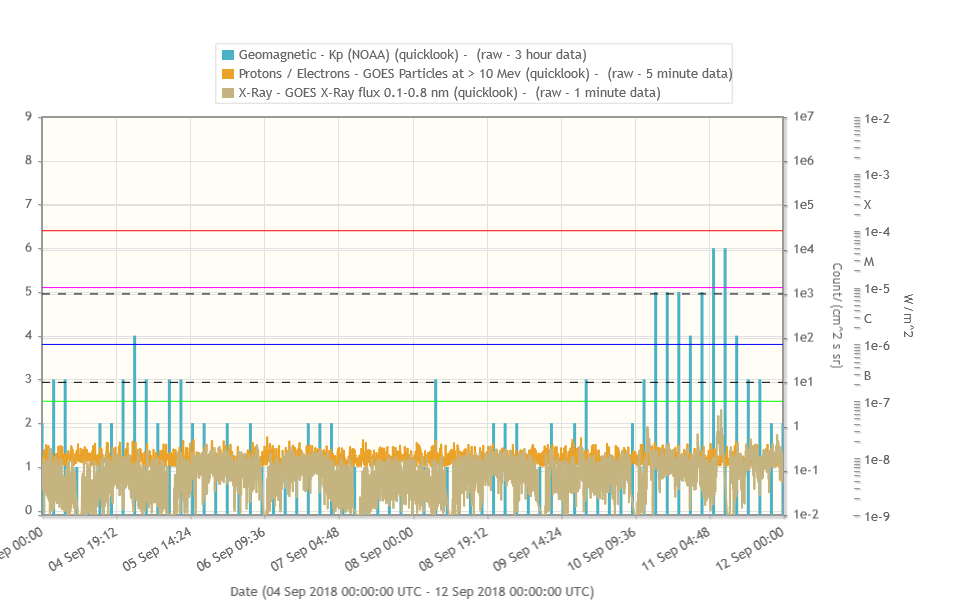
Solar activity was very low last week (04-11 September 2018), with just a single and small sunspot group, no flaring at all, and usually quiet to unsettled geomagnetic conditions. Only by 10 and 11 September, the geomagnetic activity picked up slightly with minor to moderate storming (Kp = 5 - 6) reported by the various K indices. The graph underneath was created with STAFF (http://www.staff.oma.be/ ) and shows the evolution of the x-ray flux (GOES), the proton flux (GOES) and the Kp index for this rather uneventful period.
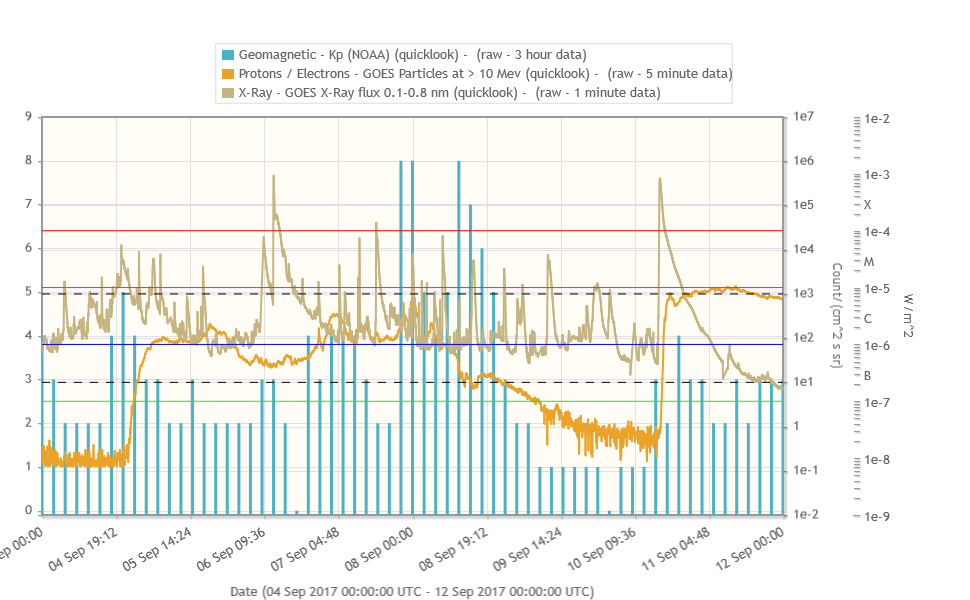
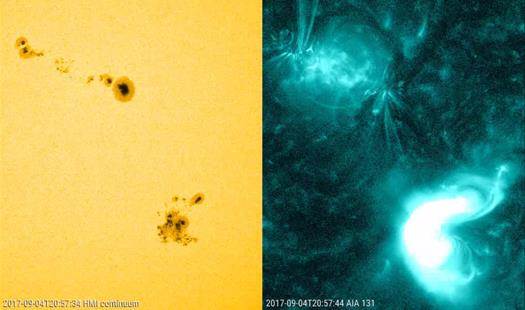
What a difference with just one year ago, when in the same week (04-11 September 2017 - graph underneath), there was the sudden appearance of complex sunspot region NOAA 2673 which produced no less than 26 M-class ("medium") and 4 X-class ("eXtreme") flares -including the two strongest flares of the entire solar cycle 24-, as well as the 4th strongest proton event of SC24 -including the (only!) second Ground Level Enhancement-. Earth experienced a severe geomagnetic storm (Kp = 8), one of just a handful of storms during SC24 that reached this level. It made the space weather community scramble to analyse all the events and evaluate the effects on the earth environment, not in the least because the succession of strong flares hampered HF communications during relief efforts in the Caribbean in the wake of Hurricanes Irma and Jose (Redmon et al., 2018; https://doi.org/10.1029/2018SW001897 ).
You can relive this exciting period with the various news items, summaries and movies that have been published on the STCE website.
- 05 September: Weather in space is picking up - http://www.stce.be/news/399/welcome.html
- 07 September: The Sun is throwing a party! - http://www.stce.be/news/400/welcome.html
- 11 September: Earth under attack - http://www.stce.be/news/401/welcome.html
- 21 September: NOAA 2673's hidden secrets revealed - http://www.stce.be/news/402/welcome.html
- The STCE newsletters of 15 (http://www.stce.be/newsletter/pdf/2017/STCEnews20170915.pdf ) and 22 September (http://www.stce.be/newsletter/pdf/2017/STCEnews20170922.pdf ).
- The space weather highlights of 2017: http://www.stce.be/news/428/welcome.html
PROBA2 Observations (3 Sep 2018 - 9 Sep 2018)
Solar Activity
Solar flare activity was very low during the week.
In order to view the activity of this week in more detail, we suggest to go to the following website from which all the daily (normal and difference) movies can be accessed: http://proba2.oma.be/ssa
This page also lists the recorded flaring events.
A weekly overview movie can be found here (SWAP week 441).
http://proba2.oma.be/swap/data/mpg/movies/weekly_movies/weekly_movie_2018_09_03.mp4
Details about some of this week’s events, can be found further below.
If any of the linked movies are unavailable they can be found in the P2SC movie repository here
http://proba2.oma.be/swap/data/mpg/movies/
Tuesday Sep 04
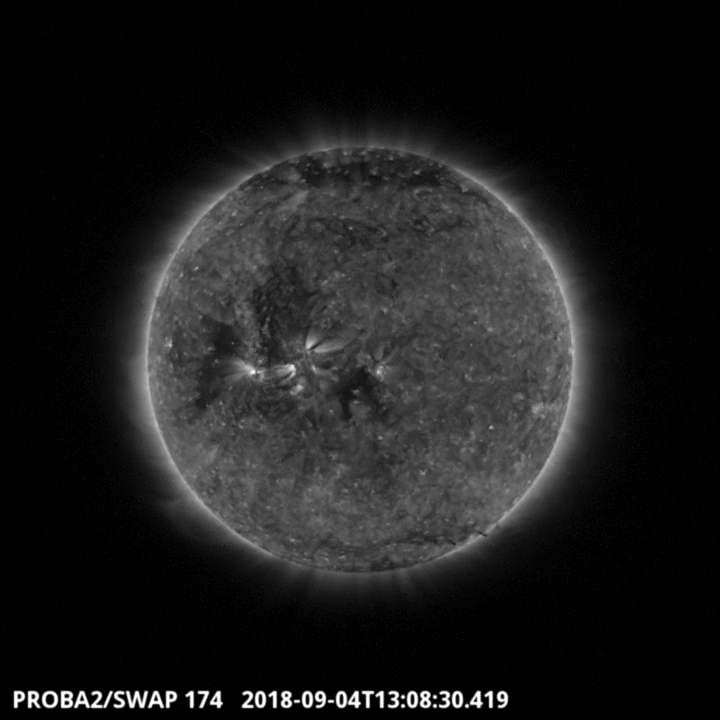
A small coronal hole is visible in the SWAP image above, it transited the central meridian on 2018-Sep-04. Find a movie of the event here (SWAP movie) http://proba2.oma.be/swap/data/mpg/movies/20180904_swap_movie.mp4
Saturday Sep 08
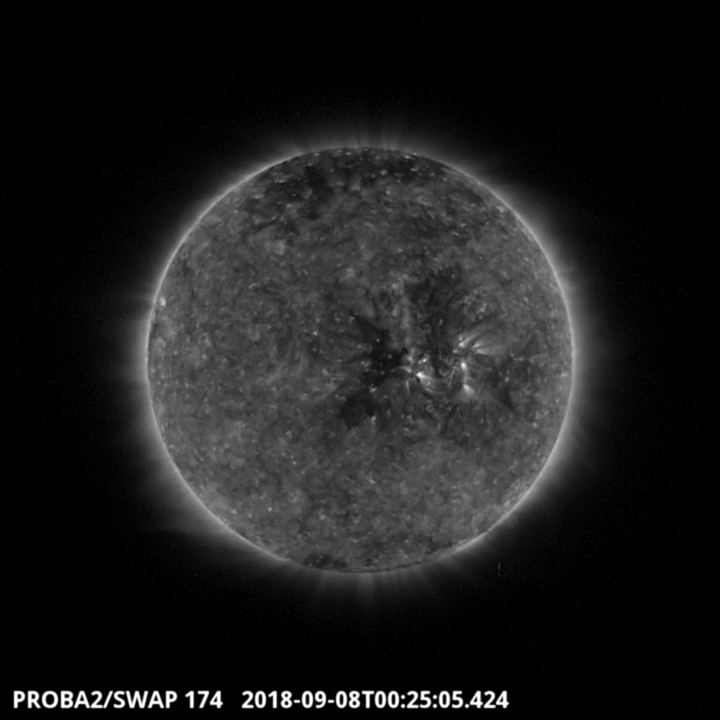
A trans-equatorial coronal hole is visible in the SWAP image above. It transited the
central meridian early on 2018-Sep-08. Find a movie of the event here (SWAP movie) http://proba2.oma.be/swap/data/mpg/movies/20180908_swap_movie.mp4
Review of solar and geomagnetic activity
Solar Activity
Solar activity was at very low levels. Only one small sunspot group was observed: NOAA 2721 on 8 and 9 September. Some coronal mass ejections (CMEs) were observed, but none with an earth-directed component. The greater than 10 MeV proton flux was at nominal levels. A small negative polarity coronal hole (CH) transited the central meridian on 3-4 September. A trans-equatorial positive polarity coronal hole (CH) transited the central meridian on 7-8 September.
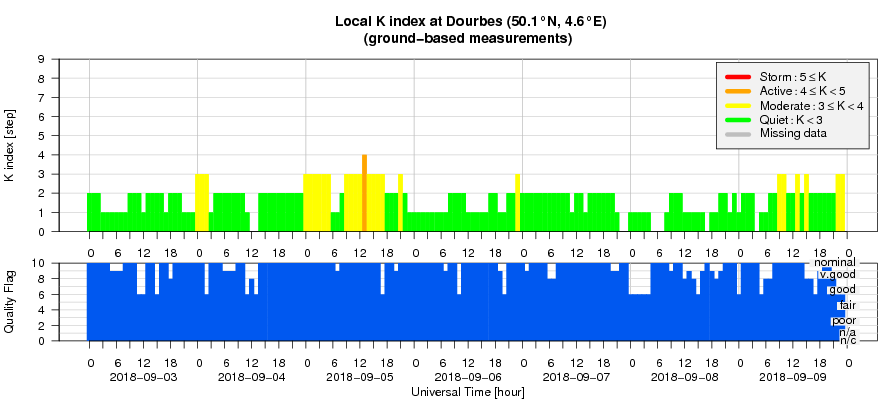
Geomagnetic Activity
Solar wind speed undulated between 330 and 520 km/s, with maximum speeds observed on 5 and 7 September. The source of the more intense solar wind on 5 September is uncertain, but the source of the 7 September wind stream was related to a small negative polarity coronal hole. Bz was variable between -7 and +11 nT. The direction of the interplanetary magnetic field (IMF) varied between positive and negative sectors, being clearly negative (towards the Sun) during the passing of the wind stream from the negative polarity coronal hole. Quiet to unsettled geomagnetic conditions were observed throughout the period, with an active episode observed in Kp and in K Dourbes on 5 September.
The International Sunspot Number
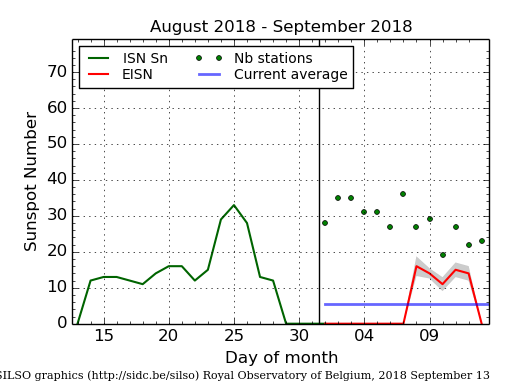
The daily Estimated International Sunspot Number (EISN, red curve with shaded error) derived by a simplified method from real-time data from the worldwide SILSO network. It extends the official Sunspot Number from the full processing of the preceding month (green line). The plot shows the last 30 days (about one solar rotation). The horizontal blue line shows the current monthly average, while the green dots give the number of stations included in the calculation of the EISN for each day.
The SIDC space weather Briefing
The Space Weather Briefing presented by the forecaster on duty from Sept 2 to 9. It reflects in images and graphs what is written in the Solar and Geomagnetic Activity report.
pdf-version:http://www.stce.be/briefings/SIDCbriefing_20180910.pdf
automatically running presentation including movies: http://www.stce.be/briefings/SIDCbriefing_20180910.ppsm
Geomagnetic Observations at Dourbes (3 Sep 2018 - 9 Sep 2018)
Review of ionospheric activity (3 Sep 2018 - 9 Sep 2018)
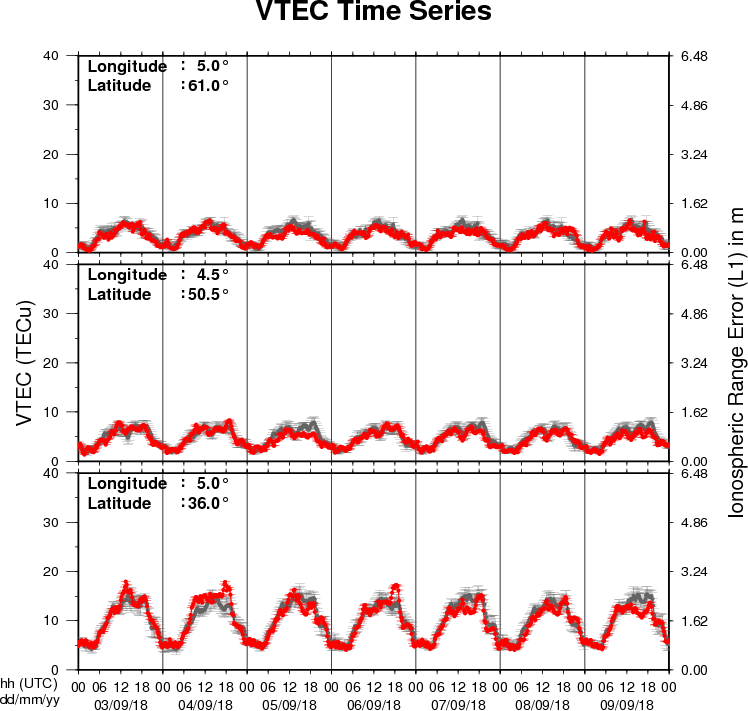
The figure shows the time evolution of the Vertical Total Electron Content (VTEC) (in red) during the last week at three locations:
a) in the northern part of Europe(N61°, 5°E)
b) above Brussels(N50.5°, 4.5°E)
c) in the southern part of Europe(N36°, 5°E)
This figure also shows (in grey) the normal ionospheric behaviour expected based on the median VTEC from the 15 previous days.
The VTEC is expressed in TECu (with TECu=10^16 electrons per square meter) and is directly related to the signal propagation delay due to the ionosphere (in figure: delay on GPS L1 frequency).
The Sun's radiation ionizes the Earth's upper atmosphere, the ionosphere, located from about 60km to 1000km above the Earth's surface.The ionization process in the ionosphere produces ions and free electrons. These electrons perturb the propagation of the GNSS (Global Navigation Satellite System) signals by inducing a so-called ionospheric delay.
See http://stce.be/newsletter/GNSS_final.pdf for some more explanations ; for detailed information, see http://gnss.be/ionosphere_tutorial.php