- Table of Content
- 1.Open Doors 201...
- 2.Review of sola...
- 3.PROBA2 Observa...
- 4.The Internatio...
- 5.Review of geom...
- 6.Geomagnetic Ob...
- 7.The SIDC Space...
- 8.Review of iono...
2. Review of solar activity
3. PROBA2 Observations (24 Sep 2018 - 30 Sep 2018)
4. The International Sunspot Number
5. Review of geomagnetic activity
6. Geomagnetic Observations at Dourbes (24 Sep 2018 - 30 Sep 2018)
7. The SIDC Space Weather Briefing
8. Review of ionospheric activity (24 Sep 2018 - 30 Sep 2018)
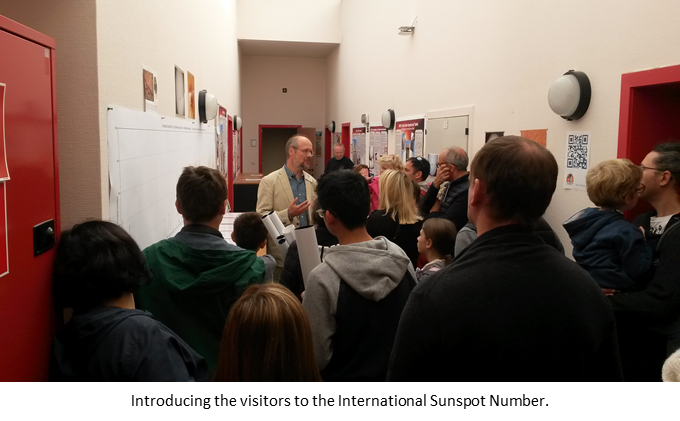
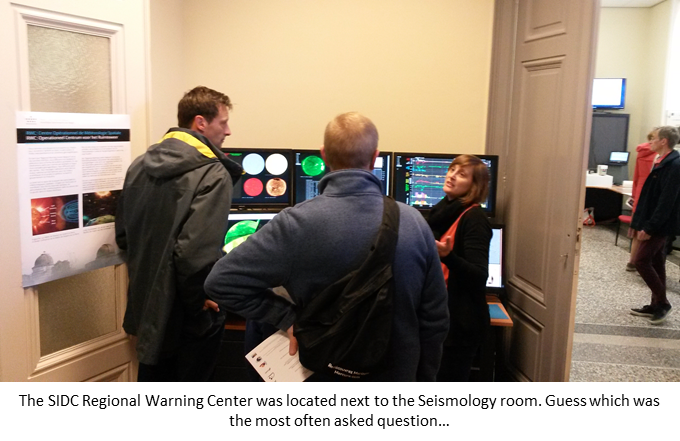
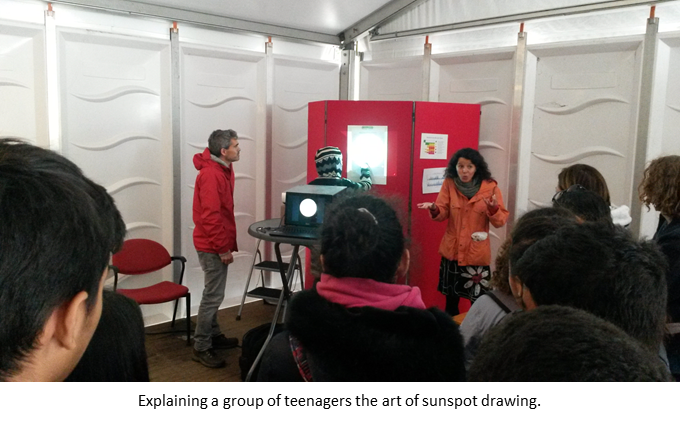
Open Doors 2018: an impression
The Open Doors 2018 (http://www.stce.be/news/439/welcome.html ) took place at the Space Pole during the weekend of 29-30 September. Underneath a few pictures capturing some of the STCE activities during this event, which attracted about 9000 visitors.

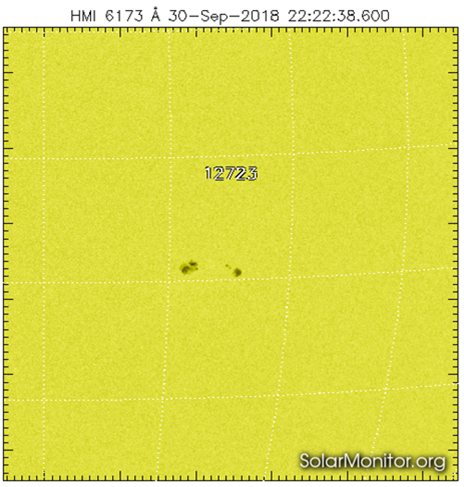
Review of solar activity
The x-ray flux remained below B-level throughout the week. There were no sunspots on the visible disk for most of the period. Only at the end of the week, a new simple bipolar region emerged near the centre of the disk (NOAA 2723). Proton flux levels were at background values throughout the week.
A filament located around S26E11 erupted in the morning of 27 September, but no associated coronal mass ejection (CME) could be identified in coronagraphic imagery.
PROBA2 Observations (24 Sep 2018 - 30 Sep 2018)
Solar Activity
Solar flare activity remained very low during the week.
In order to view the activity of this week in more detail, we suggest to go to the following website from which all the daily (normal and difference) movies can be accessed: http://proba2.oma.be/ssa
This page also lists the recorded flaring events.
A weekly overview movie can be found here (SWAP week 444): http://proba2.oma.be/swap/data/mpg/movies/weekly_movies/weekly_movie_2018_09_24.mp4
Details about some of this week's events, can be found further below.
If any of the linked movies are unavailable they can be found in the P2SC movie repository here: http://proba2.oma.be/swap/data/mpg/movies/
Wednesday Sep 26
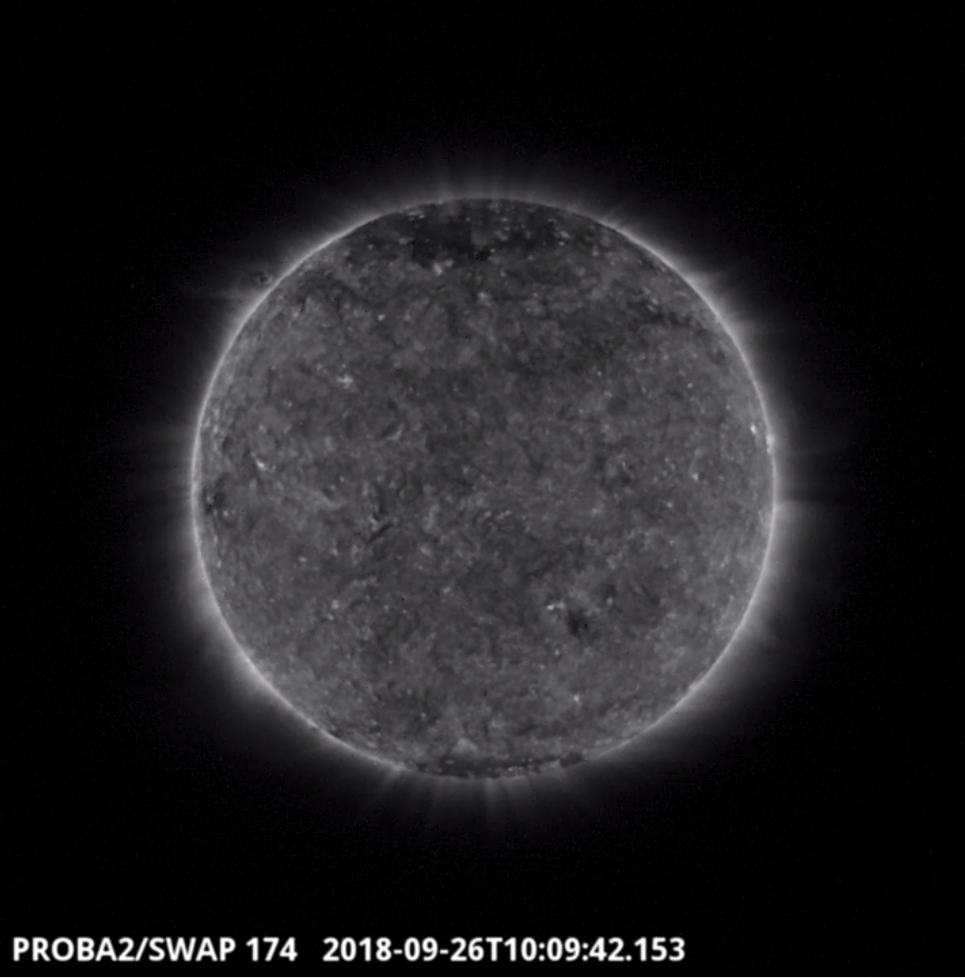
On 2018-Sep-26 SWAP observed some rotational flows on the north east limb, shown in the SWAP image above at 10:09 UT.
Find a movie of the event here (SWAP movie): http://proba2.oma.be/swap/data/mpg/movies/20180926_swap_movie.mp4
The International Sunspot Number
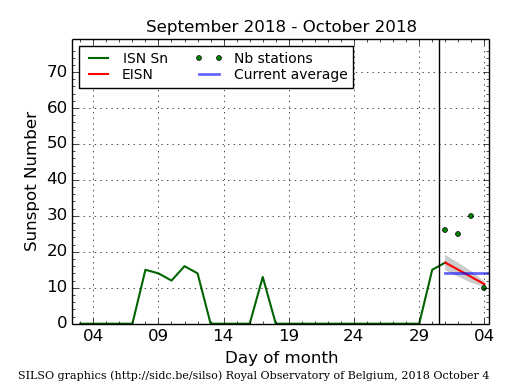
The daily Estimated International Sunspot Number (EISN, red curve with shaded error) derived by a simplified method from real-time data from the worldwide SILSO network. It extends the official Sunspot Number from the full processing of the preceding month (green line). The plot shows the last 30 days (about one solar rotation). The horizontal blue line shows the current monthly average, while the green dots give the number of stations included in the calculation of the EISN for each day.
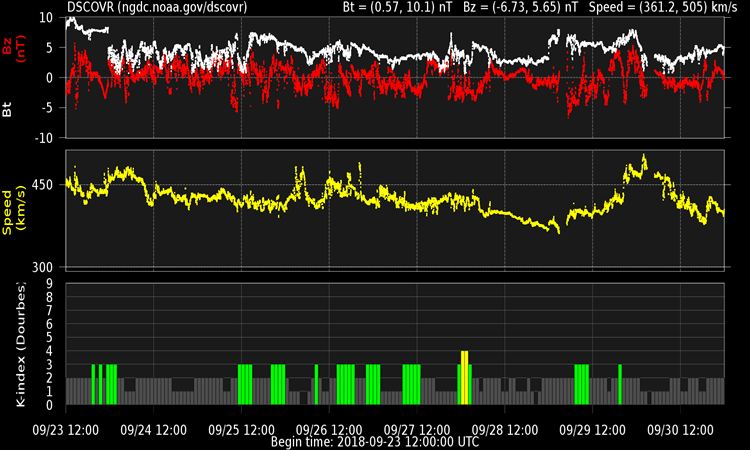
Review of geomagnetic activity
Solar wind was slightly elevated for most of the week with solar wind speed between 360 and 500 km/s and total magnetic field reaching peaks near 8 nT. In absence of clearly identifiable coronal hole features near the equator, the transient elevations of essentially slow solar wind were all short lived.
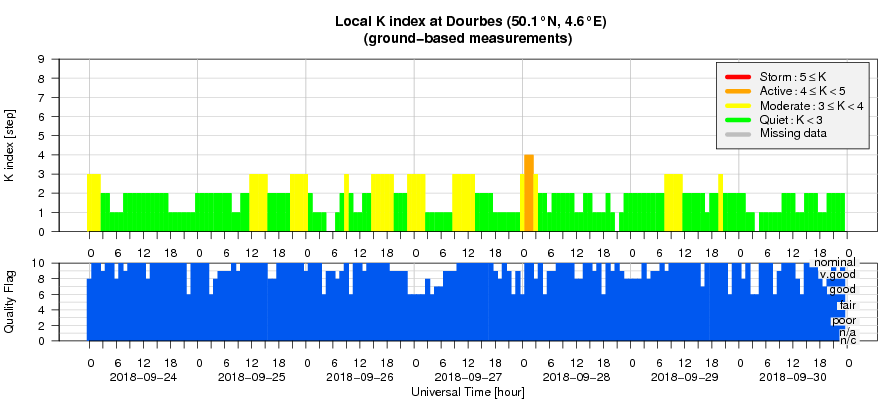
Geomagnetic conditions were quiet to unsettled (both local K Dourbes and NOAA Kp 0-3) with a few isolated active periods (K=4) in the Dourbes measurements.
Geomagnetic Observations at Dourbes (24 Sep 2018 - 30 Sep 2018)
The SIDC Space Weather Briefing
The Space Weather Briefing presented by the forecaster on duty from 24 till 30 September. It reflects in images and graphs what is written in the Solar and Geomagnetic Activity reports.

The pdf-version: http://www.stce.be/movies/20181001_SWbriefing_FINAL.pdf
The automatically running presentation: http://www.stce.be/movies/20181001_SWbriefing_FINAL.ppsm
Review of ionospheric activity (24 Sep 2018 - 30 Sep 2018)
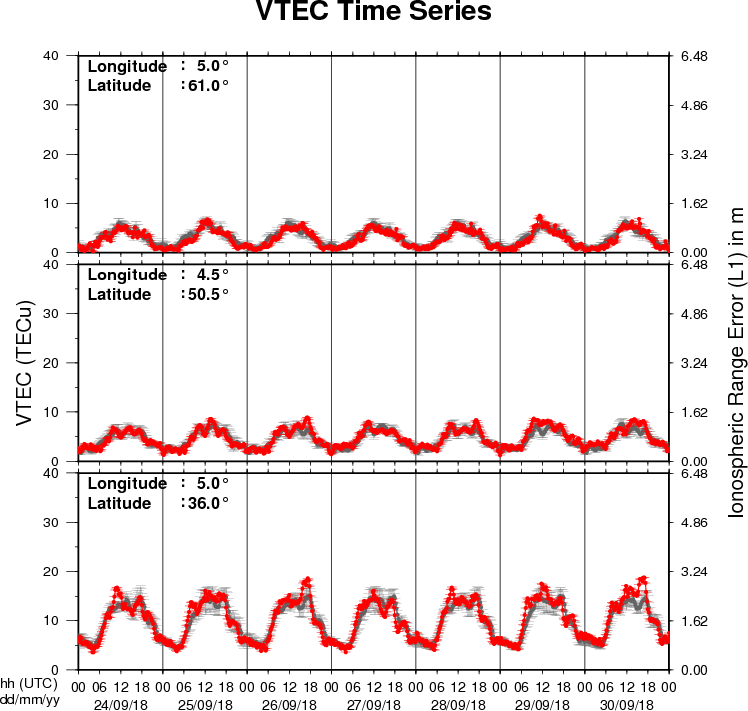
The figure shows the time evolution of the Vertical Total Electron Content (VTEC) (in red) during the last week at three locations:
a) in the northern part of Europe(N61°, 5°E)
b) above Brussels(N50.5°, 4.5°E)
c) in the southern part of Europe(N36°, 5°E)
This figure also shows (in grey) the normal ionospheric behaviour expected based on the median VTEC from the 15 previous days.
The VTEC is expressed in TECu (with TECu=10^16 electrons per square meter) and is directly related to the signal propagation delay due to the ionosphere (in figure: delay on GPS L1 frequency).
The Sun's radiation ionizes the Earth's upper atmosphere, the ionosphere, located from about 60km to 1000km above the Earth's surface.The ionization process in the ionosphere produces ions and free electrons. These electrons perturb the propagation of the GNSS (Global Navigation Satellite System) signals by inducing a so-called ionospheric delay.
See http://stce.be/newsletter/GNSS_final.pdf for some more explanations ; for detailed information, see http://gnss.be/ionosphere_tutorial.php