- Table of Content
- 1.ESCAPE - Tamin...
- 2.PROBA2 Observa...
- 3.Review of sola...
- 4.The Internatio...
- 5.Geomagnetic Ob...
- 6.The SIDC space...
- 7.Review of iono...
2. PROBA2 Observations (12 Nov 2018 - 18 Nov 2018)
3. Review of solar and geomagnetic activity
4. The International Sunspot Number
5. Geomagnetic Observations at Dourbes (12 Nov 2018 - 18 Nov 2018)
6. The SIDC space weather Briefing
7. Review of ionospheric activity (12 Nov 2018 - 18 Nov 2018)
ESCAPE - Taming the data beast
ESCAPE, the 'European Science Cluster of Astronomy and Particle physics ESFRI research infrastructures', is an international project supported by the European Commission to boost the implementation of the European Open Science Cloud (EOSC). EOSC is a cloud for research data in Europe allowing for universal access to data, providing a single online platform where all European researchers will be able to access and re-use data produced by other scientists, as well as share and analyse the data they have produced.
Indeed, a deluge of data is expected in the next years by the astronomy-related projects and the accelerator-based particle physics facilities, combining investigations from the largest-scale structures in the observable Universe to the most fundamental particles. In particular those projects and facilities prioritised in the European Strategy Forum on Research Infrastructures (ESFRI), and other world-class projects are expected to create huge flows and amounts of data.
ESCAPE aims at establishing a collaboration between existing ESFRI facilities in order to implement a functional link between the concerned ESFRI projects and the EOSC initiative. One of the concerned ESFRI is the European Solar Telescope (EST - http://www.est-east.eu/est/). The Royal Observatory of Belgium (ROB, https://www.astro.oma.be/en/), as a partner within the H2020 ESCAPE project, will participate in the effort to connect EST to EOSC through the Virtual Observatory framework. The Solar Virtual Observatory (http://solarnet.oma.be/) and the JHelioviewer (http://www.jhelioviewer.org/) software developed at ROB will play a key role in this effort.
More information on the ESCAPE project can be found in the related press release at https://indico.in2p3.fr/event/18279/ (5 languages).

PROBA2 Observations (12 Nov 2018 - 18 Nov 2018)
Solar Activity
Solar flare activity was very low during the week.
In order to view the activity of this week in more detail, we suggest to go to the following website from which all the daily (normal and difference) movies can be accessed: http://proba2.oma.be/ssa
This page also lists the recorded flaring events.
A weekly overview movie can be found here (SWAP week 451).
http://proba2.oma.be/swap/data/mpg/movies/weekly_movies/weekly_movie_2018_11_12.mp4
Details about some of this week’s events, can be found further below.
If any of the linked movies are unavailable they can be found in the P2SC movie repository here.
http://proba2.oma.be/swap/data/mpg/movies/
Friday Nov 16
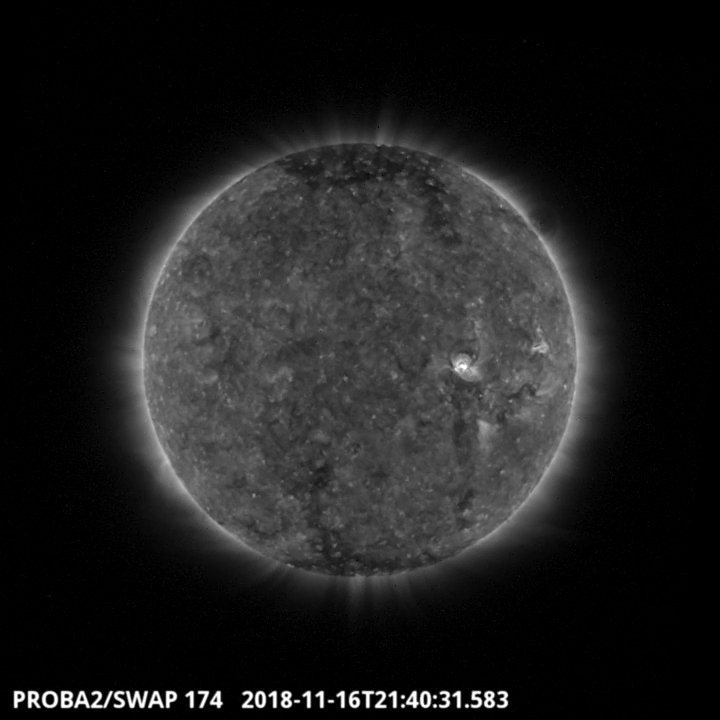
An extended coronal hole is visible on the south of the solar disk on 2018-Nov-14, and was visible until the end of the week. This can be seen in the SWAP image above. Find a movie of the events here (SWAP movie)
http://proba2.oma.be/swap/data/mpg/movies/20181116_swap_movie.mp4
Saturday Nov 17
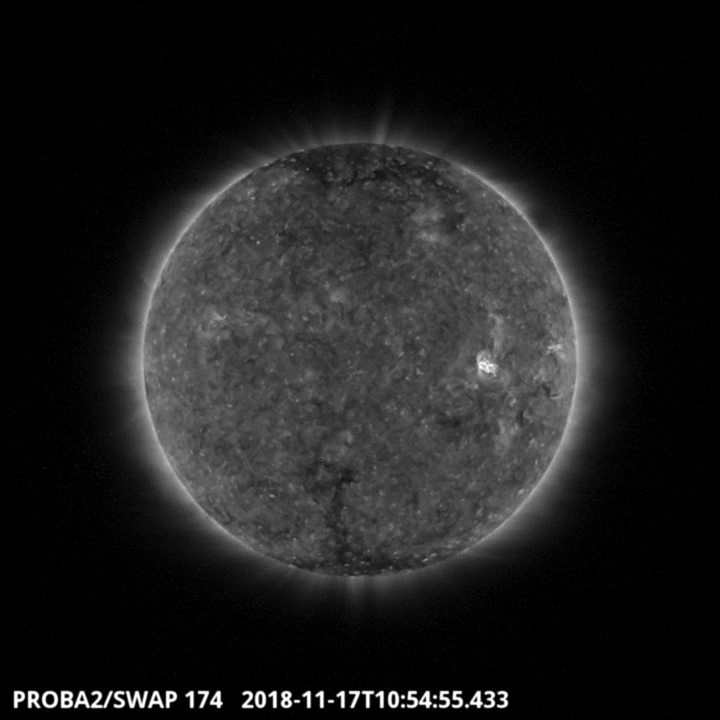
An A5.3 flare was produced from the sunspot group (NOAA 2727) observed by SWAP on 2018-Nov-17. The flare is visible on the Western hemisphere of the Sun in the SWAP image above at 10:55 UT. Find a movie of the event here (SWAP movie)
http://proba2.oma.be/swap/data/mpg/movies/20181117_swap_movie.mp4
Review of solar and geomagnetic activity
Solar activity
There were two numbered NOAA (beta) regions on the Sun this week: NOAA 2726 in the first half of the week (which turned into a plage later) and NOAA 2727 in the second half of the week.
There were no B or brighter flares, and the GOES X-ray flux background varied between about A0.5 and A2 level.
There were no filament eruptions nor Earth-directed CMEs.
The greater than 10 MeV proton flux was at nominal levels throughout the week.
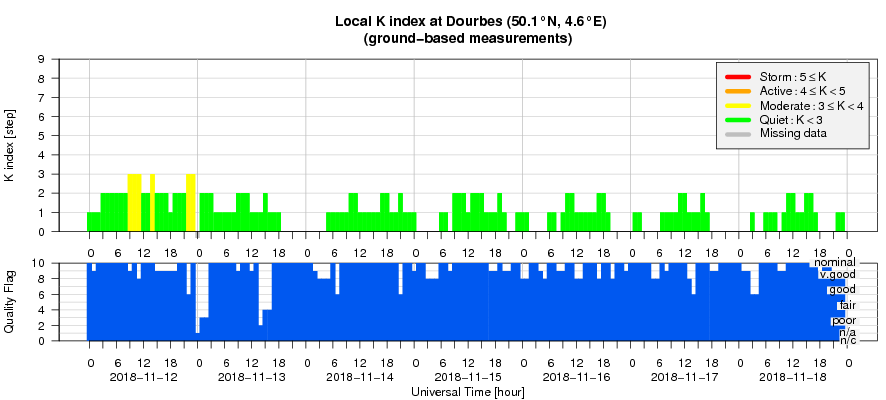
Geomagnetic activity
At the start of the week, the Earth was under the influence of a high speed stream associated with a equatorial, negative polarity coronal hole. DSCOVR registered solar wind speeds up to 650 km/s. The Interplanetary Magnetic Field (IMF) reached 8 nT.
The rise in solar wind density and IMF magnitude on November 18 could be possibly associated with the arrival of the solar wind emanating from a weak, negative polarity, equatorial coronal hole.
Quiet to unsettled geomagnetic conditions (K Dourbes less than 4) were registered throughout the week.
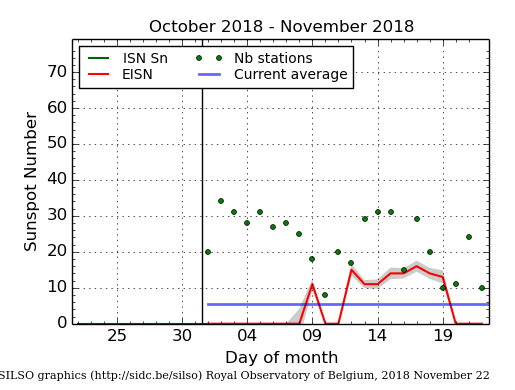
The International Sunspot Number
The daily Estimated International Sunspot Number (EISN, red curve with shaded error) derived by a simplified method from real-time data from the worldwide SILSO network. It extends the official Sunspot Number from the full processing of the preceding month (green line). The plot shows the last 30 days (about one solar rotation). The horizontal blue line shows the current monthly average, while the green dots give the number of stations included in the calculation of the EISN for each day.
Geomagnetic Observations at Dourbes (12 Nov 2018 - 18 Nov 2018)
The SIDC space weather Briefing
The Space Weather Briefing presented by the forecaster on duty from November 12 to 18. It reflects in images and graphs what is written in the Solar and Geomagnetic Activity report.

pdf-version: http://www.stce.be/briefings/20181119_SWbriefing.pdf
automatically running presentation: http://www.stce.be/briefings/20181119_SWbriefing.ppsm
Review of ionospheric activity (12 Nov 2018 - 18 Nov 2018)
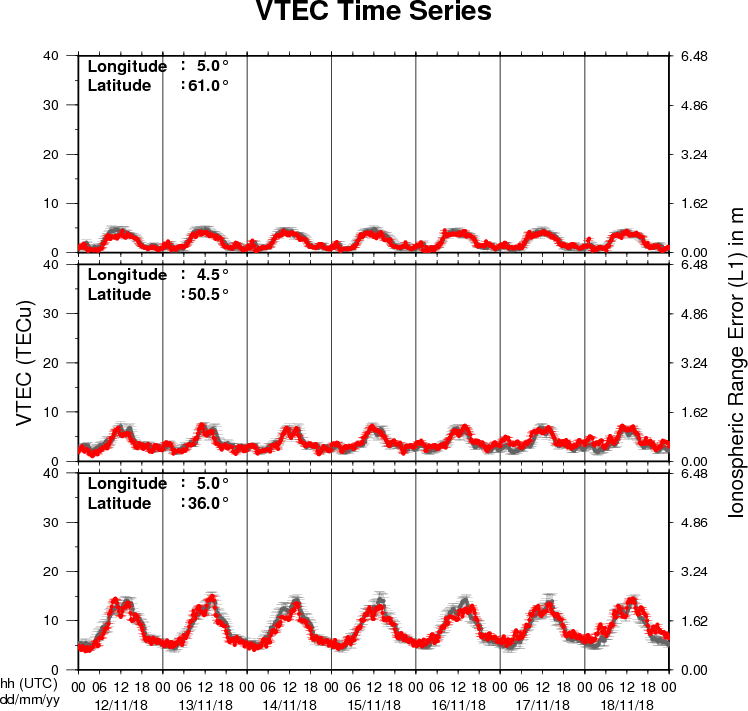
The figure shows the time evolution of the Vertical Total Electron Content (VTEC) (in red) during the last week at three locations:
a) in the northern part of Europe(N61°, 5°E)
b) above Brussels(N50.5°, 4.5°E)
c) in the southern part of Europe(N36°, 5°E)
This figure also shows (in grey) the normal ionospheric behaviour expected based on the median VTEC from the 15 previous days.
The VTEC is expressed in TECu (with TECu=10^16 electrons per square meter) and is directly related to the signal propagation delay due to the ionosphere (in figure: delay on GPS L1 frequency).
The Sun's radiation ionizes the Earth's upper atmosphere, the ionosphere, located from about 60km to 1000km above the Earth's surface.The ionization process in the ionosphere produces ions and free electrons. These electrons perturb the propagation of the GNSS (Global Navigation Satellite System) signals by inducing a so-called ionospheric delay.
See http://stce.be/newsletter/GNSS_final.pdf for some more explanations ; for detailed information, see http://gnss.be/ionosphere_tutorial.php