- Table of Content
- 1.Space Weather ...
- 2.PROBA2 Observa...
- 3.Review of sola...
- 4.The SIDC space...
- 5.The Internatio...
- 6.Geomagnetic Ob...
- 7.Review of iono...
2. PROBA2 Observations (19 Nov 2018 - 25 Nov 2018)
3. Review of solar and geomagnetic activity
4. The SIDC space weather Briefing
5. The International Sunspot Number
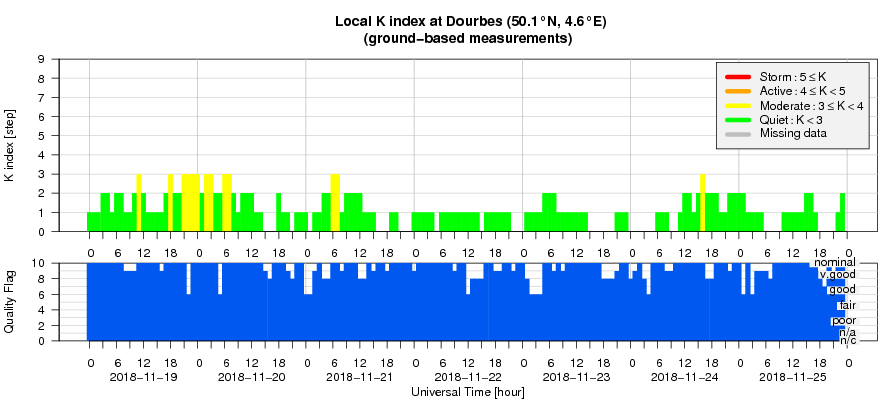
6. Geomagnetic Observations at Dourbes (19 Nov 2018 - 25 Nov 2018)
7. Review of ionospheric activity (19 Nov 2018 - 25 Nov 2018)
Space Weather Introductory Course - SWIC
Mix meteo operators, pictionary, space weather lectures, coffee, exam, dramatic personification of space weather jargon and you get certified Space Weather Operators. This was SWIC November 2018:
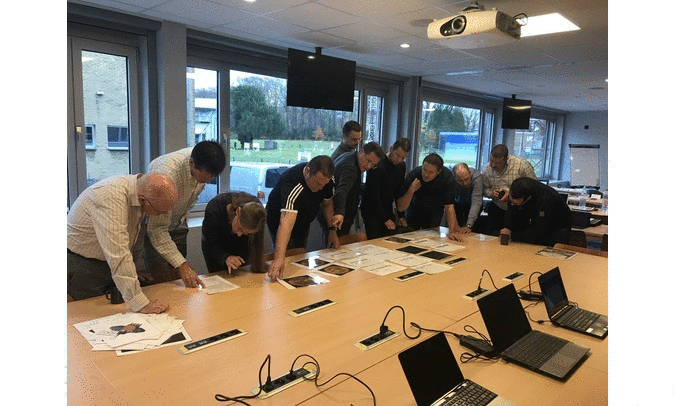
full overview on https://events.oma.be/indico/event/59/overview
PROBA2 Observations (19 Nov 2018 - 25 Nov 2018)
Solar Activity
Solar flare activity remained very low during the week.
In order to view the activity of this week in more detail, we suggest to go to the following website from which all the daily (normal and difference) movies can be accessed: http://proba2.oma.be/ssa
This page also lists the recorded flaring events.
A weekly overview movie can be found here (SWAP week 452): http://proba2.oma.be/swap/data/mpg/movies/weekly_movies/weekly_movie_2018_11_19.mp4
Details about some of this week's events, can be found further below.
If any of the linked movies are unavailable they can be found in the P2SC movie repository here: http://proba2.oma.be/swap/data/mpg/movies/
Saturday Nov 24
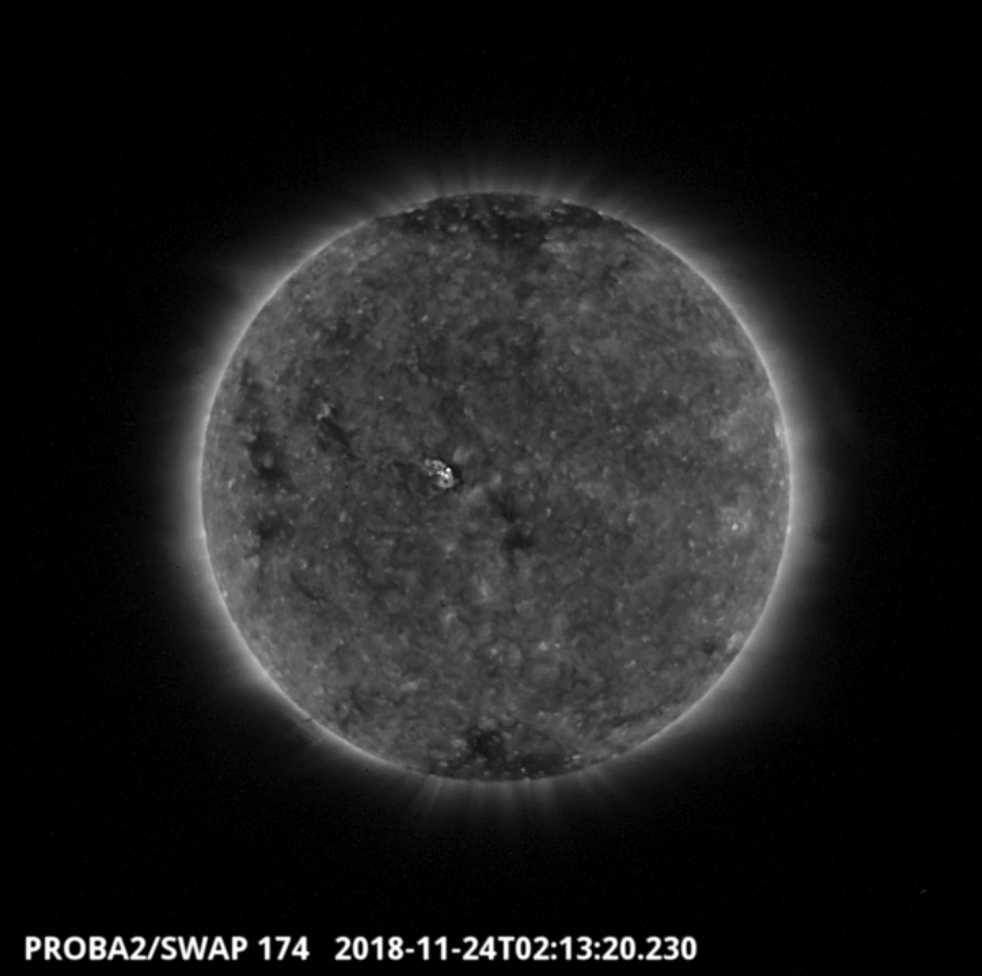
The largest flare of the week (B1.1) associated with NOAA AR 2728 was observed by SWAP on 2018-Nov-24, visible in the centre of the solar disk in the SWAP image above taken at 02:13 UT.
Find a movie of the event here (SWAP movie): http://proba2.oma.be/swap/data/mpg/movies/20181124_swap_movie.mp4
Review of solar and geomagnetic activity
SOLAR ACTIVITY
Solar activity was very low. The X-ray flux was below the B level for almost the entire week.
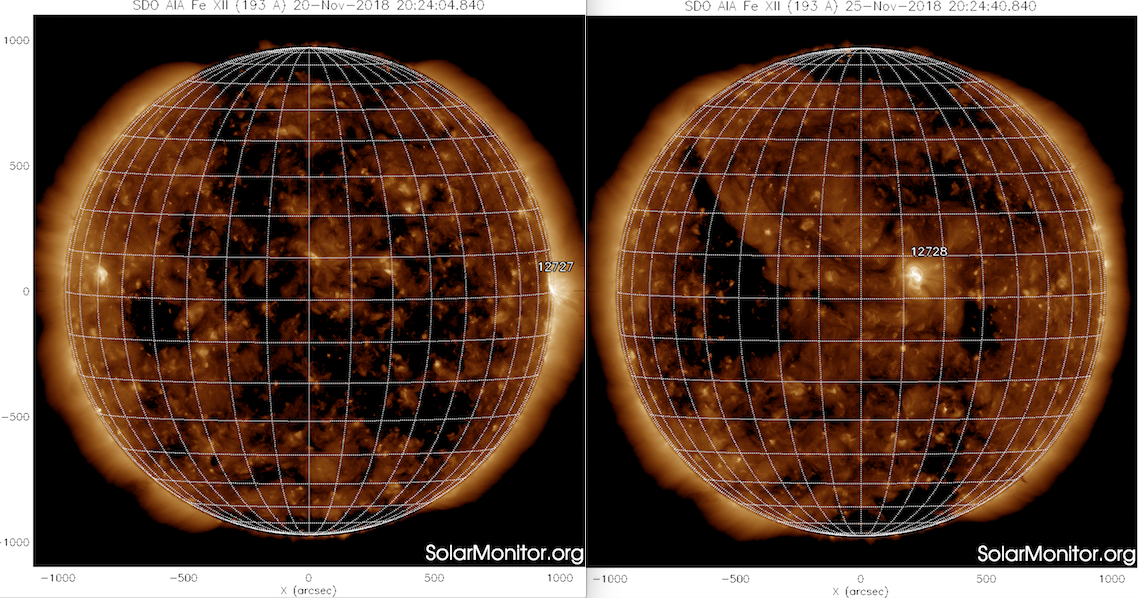
On November 20, NOAA 2727 rotated behind the West limb resulting in 4 spotless days. On November 24, NOAA 2728 emerged near the disk centre but decayed quickly resulting again in spotless days from November 26 onwards.
No Earth directed CMEs were observed during the period.
Proton flux levels were at background values the entire period.
GEOMAGNETIC ACTIVITY
Solar wind speed at L1 was slightly enhanced on November 20, 21, 22. This solar wind originated from the extensions of the Southern polar coronal hole which were near the central meridian on November 18. However, the solar wind speed did not go above 450 km/s. At the onset of the solar wind increase, around midnight 19/20, the total magnetic field measured at L1 reached 12.5nT. Its Bz was negative for a significant period.
During the remainder of the week, the solar wind at L1 was nominal.
The Earth was located in a negative sector (Phi from DSCOVR data, around 315 degrees), i.e. the magnetic field pointing towards the Sun.
Geomagnetic conditions were quiet with some unsettled periods (NOAA Kp and local K Dourbes 3) around the onset of the Solar wind enhancement.
The SIDC space weather Briefing
The Space Weather Briefing presented by the forecaster on duty from Nov 19 to 25. It reflects in images and graphs what is written in the Solar and Geomagnetic Activity report.
pdf-version: http://www.stce.be/briefings/20181126_SWbriefing.pdf
automatically running presentation: http://www.stce.be/briefings/20181126_SWbriefing.ppsm
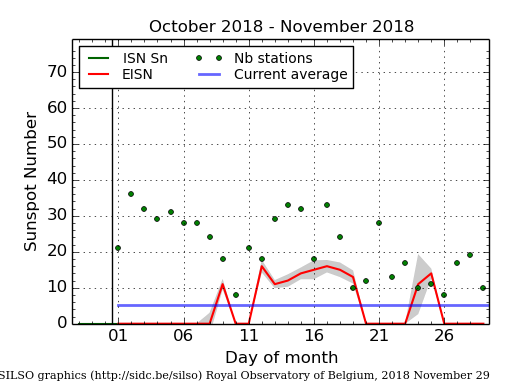
The International Sunspot Number
The daily Estimated International Sunspot Number (EISN, red curve with shaded error) derived by a simplified method from real-time data from the worldwide SILSO network. It extends the official Sunspot Number from the full processing of the preceding month (green line). The plot shows the last 30 days (about one solar rotation). The horizontal blue line shows the current monthly average, while the green dots give the number of stations included in the calculation of the EISN for each day.
Geomagnetic Observations at Dourbes (19 Nov 2018 - 25 Nov 2018)
Review of ionospheric activity (19 Nov 2018 - 25 Nov 2018)
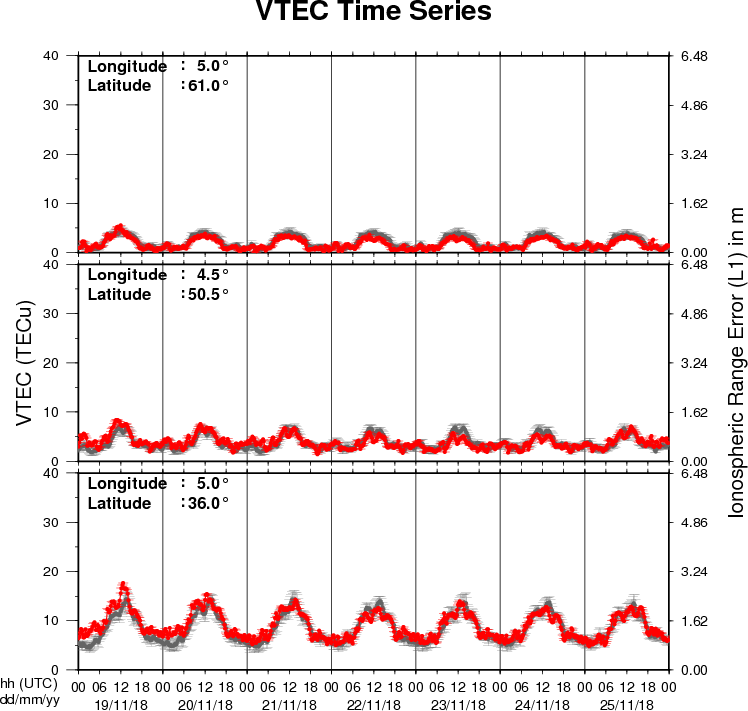
The figure shows the time evolution of the Vertical Total Electron Content (VTEC) (in red) during the last week at three locations:
a) in the northern part of Europe(N61°, 5°E)
b) above Brussels(N50.5°, 4.5°E)
c) in the southern part of Europe(N36°, 5°E)
This figure also shows (in grey) the normal ionospheric behaviour expected based on the median VTEC from the 15 previous days.
The VTEC is expressed in TECu (with TECu=10^16 electrons per square meter) and is directly related to the signal propagation delay due to the ionosphere (in figure: delay on GPS L1 frequency).
The Sun's radiation ionizes the Earth's upper atmosphere, the ionosphere, located from about 60km to 1000km above the Earth's surface.The ionization process in the ionosphere produces ions and free electrons. These electrons perturb the propagation of the GNSS (Global Navigation Satellite System) signals by inducing a so-called ionospheric delay.
See http://stce.be/newsletter/GNSS_final.pdf for some more explanations ; for detailed information, see http://gnss.be/ionosphere_tutorial.php