- Table of Content
- 1.The polar tric...
- 2.PROBA2 Observa...
- 3.Review of sola...
- 4.The Internatio...
- 5.Review of geom...
- 6.Geomagnetic Ob...
- 7.The SIDC space...
- 8.Review of iono...
2. PROBA2 Observations (3 Dec 2018 - 9 Dec 2018)
3. Review of solar activity
4. The International Sunspot Number
5. Review of geomagnetic activity
6. Geomagnetic Observations at Dourbes (3 Dec 2018 - 9 Dec 2018)
7. The SIDC space weather Briefing
8. Review of ionospheric activity (3 Dec 2018 - 9 Dec 2018)
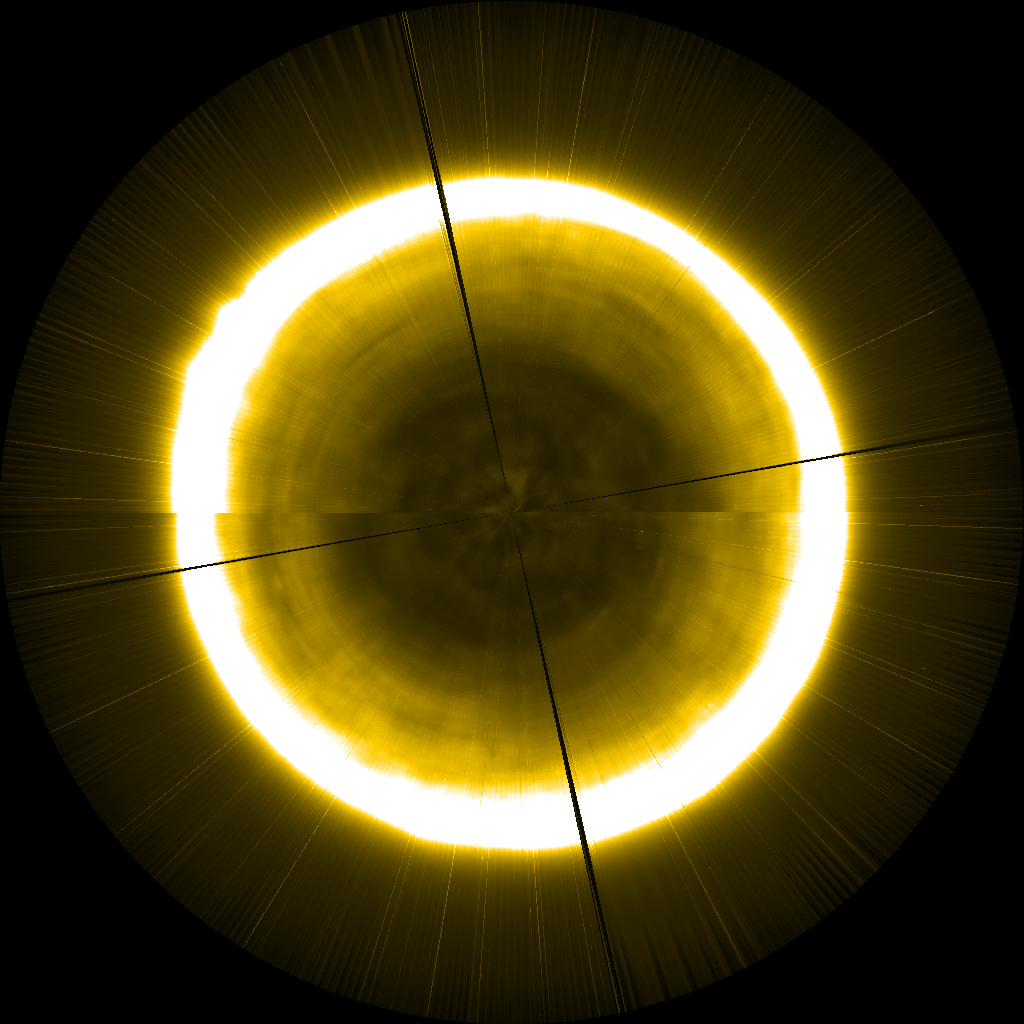
The polar trick of PROBA2
The PROBA2 team did a special 'to explore the poles where no man has explored before'-trick. You can do this trick because the Sun looks semi-transparant in the EUV, meaning that you can see stuff that is behind other stuff.
In a nut-shell is come to this:
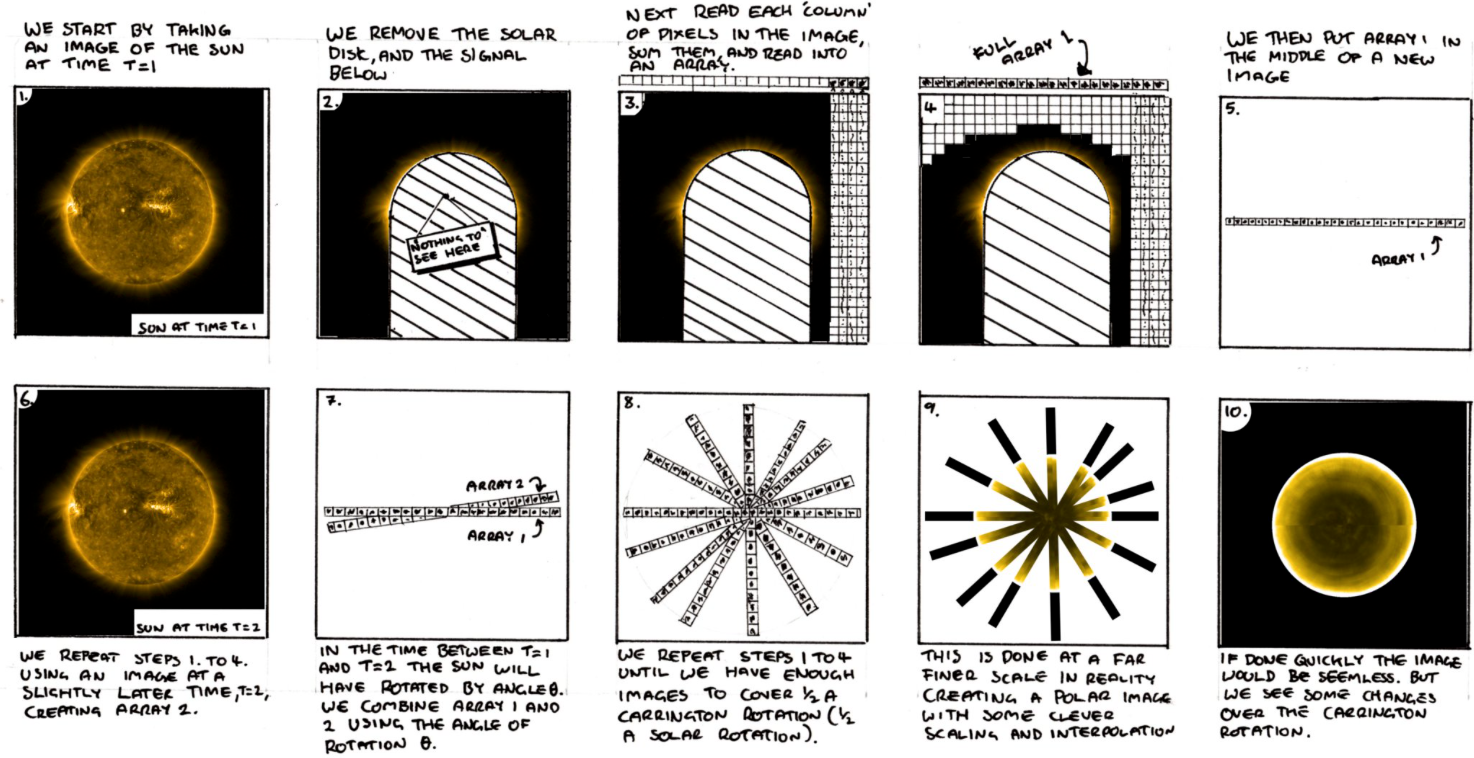
This results of the 'where no man has explored before'-trick:
There is of course much more to read about this: http://proba2.oma.be/Polar-observations
PROBA2 Observations (3 Dec 2018 - 9 Dec 2018)
Solar Activity
Solar flare activity was very low during the week.
In order to view the activity of this week in more detail, we suggest to go to the following website from which all the daily (normal and difference) movies can be accessed: http://proba2.oma.be/ssa
This page also lists the recorded flaring events.
A weekly overview movie can be found here (SWAP week 454).
http://proba2.oma.be/swap/data/mpg/movies/weekly_movies/weekly_movie_2018_12_03.mp4
Details about some of this week’s events, can be found further below.
If any of the linked movies are unavailable they can be found in the P2SC movie repository here
http://proba2.oma.be/swap/data/mpg/movies/
Tuesday Dec 04
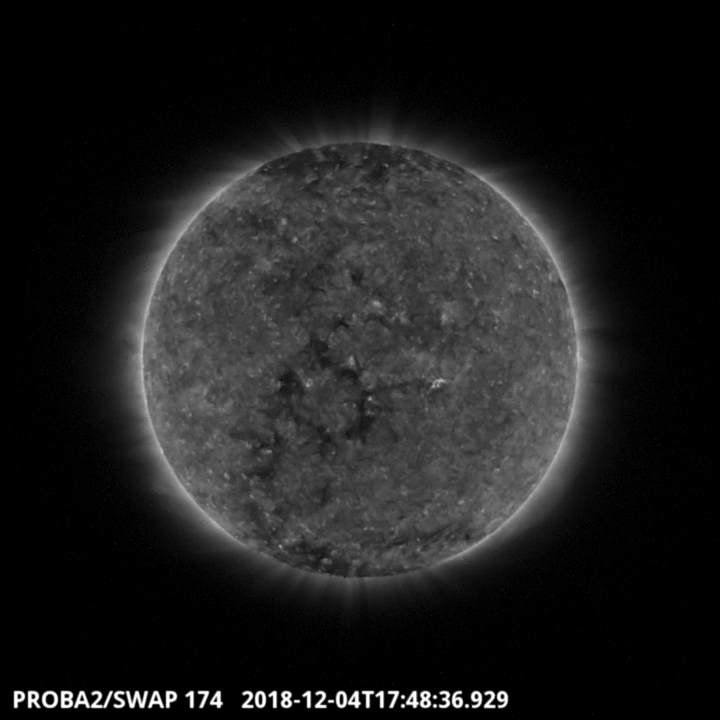
A patchy coronal hole reached the central meridian on December 04, it is shown on the SWAP image above. Find a movie of the events here (SWAP movie) http://proba2.oma.be/swap/data/mpg/movies/20181204_swap_movie.mp4
Sunday Dec 09
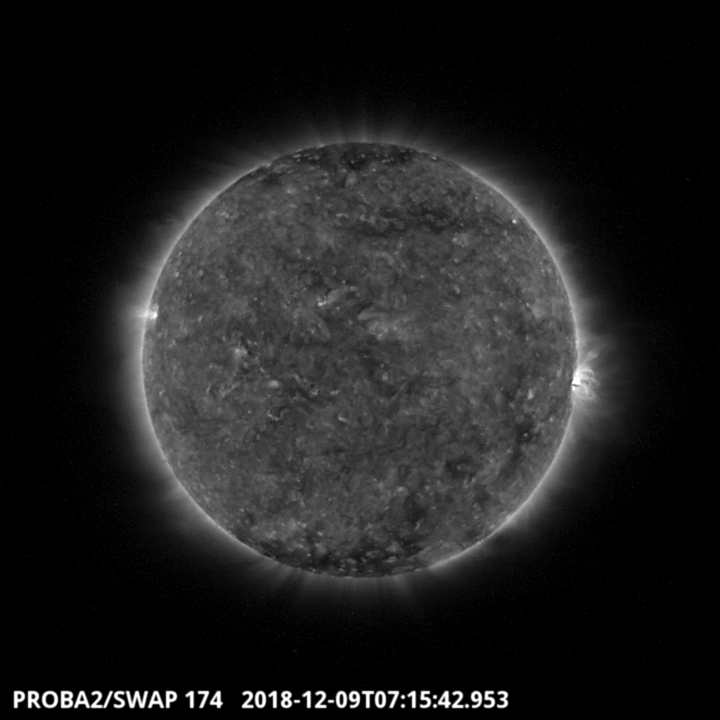
The biggest flare of the week was a B2.4 which occurred on 2018-Dec-09 around 07:15 UT. It erupted from the NOAA region 2729. Find a movie of the events here (SWAP movie)
http://proba2.oma.be/swap/data/mpg/movies/20181209_swap_movie.mp4
Review of solar activity
The Sun was quiet.
A small bipolar sunspot group (Catania sunspot group 2, NOAA 2729) emerged on the Sun on December 05.
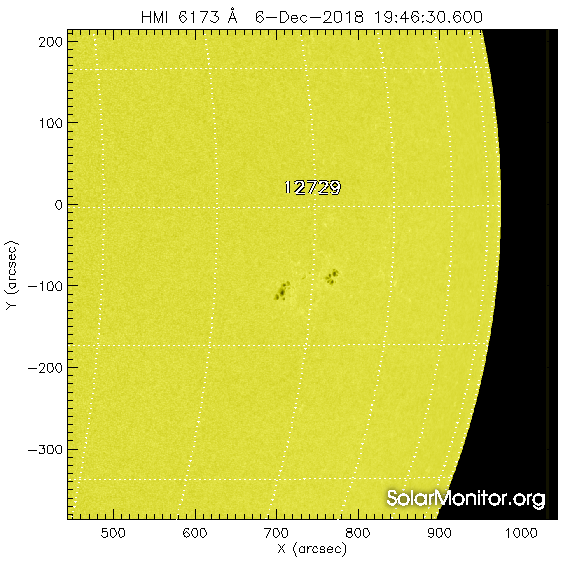
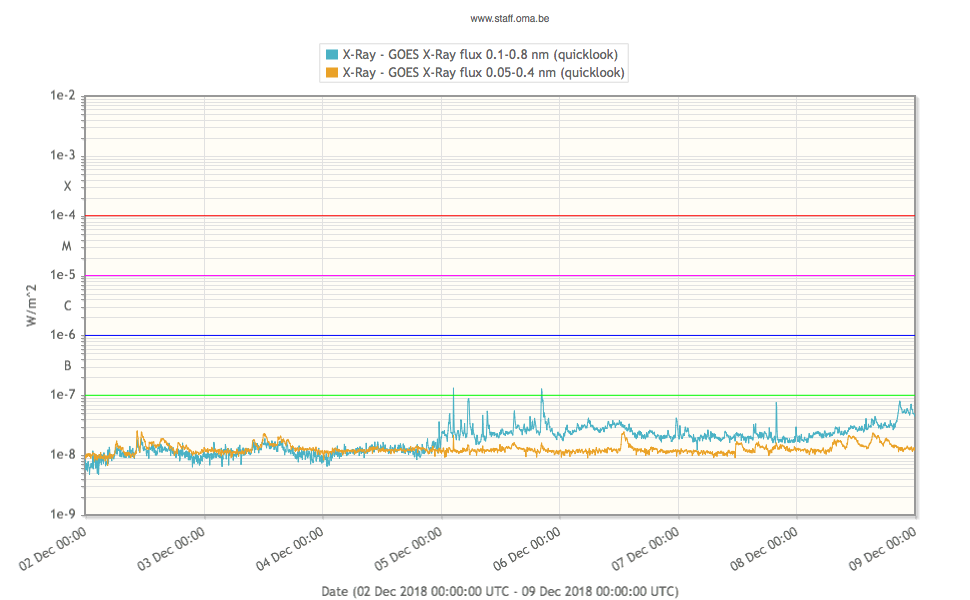
In the graph of the x-ray flux measured by GOES, a geo-stationary satellite, you can see that the blue curve reaches a slightly higher level from December 05 onwards. This is the day that Catania sunspot group 2 appeared.
No Earth directed Coronal Mass Ejection has been observed.
The greater than 10 MeV solar protons flux remained at nominal levels over the past week.
The International Sunspot Number
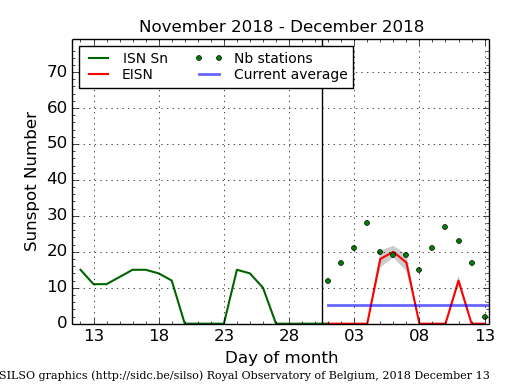
The daily Estimated International Sunspot Number (EISN, red curve with shaded error) derived by a simplified method from real-time data from the worldwide SILSO network. It extends the official Sunspot Number from the full processing of the preceding month (green line). The plot shows the last 30 days (about one solar rotation). The horizontal blue line shows the current monthly average, while the green dots give the number of stations included in the calculation of the EISN for each day.
Review of geomagnetic activity
Solar wind
Two times this week, the Earth was in an enhanced solar wind stream.
These periods were linked with coronal holes that reached the solar central meridian, on November 27 and December 04 respectively.
The second period was the most interesting.
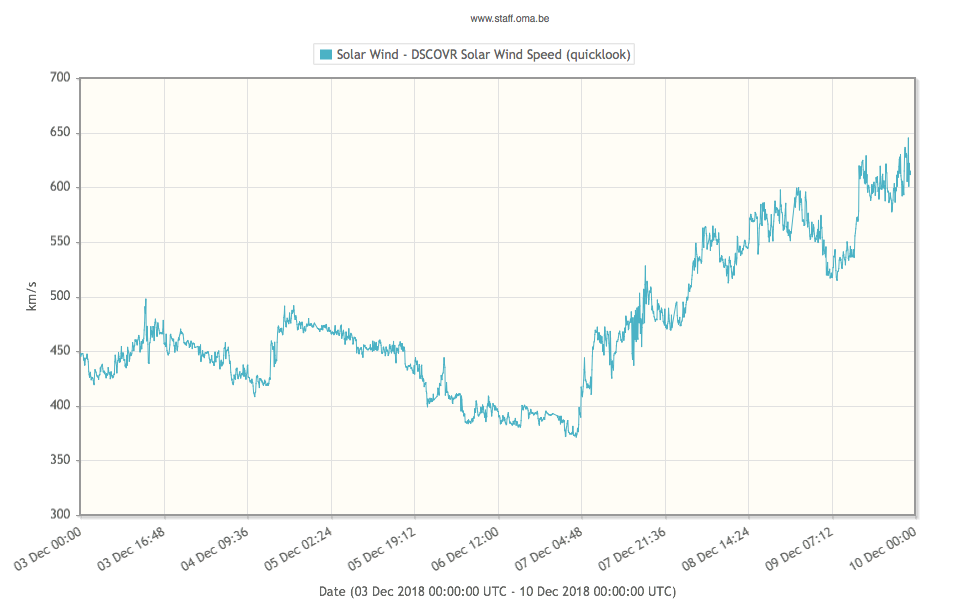
The solar wind speed measured in front of the Earth (at L1) gradually increased from December 07 and reached 650 km/s on December 09.
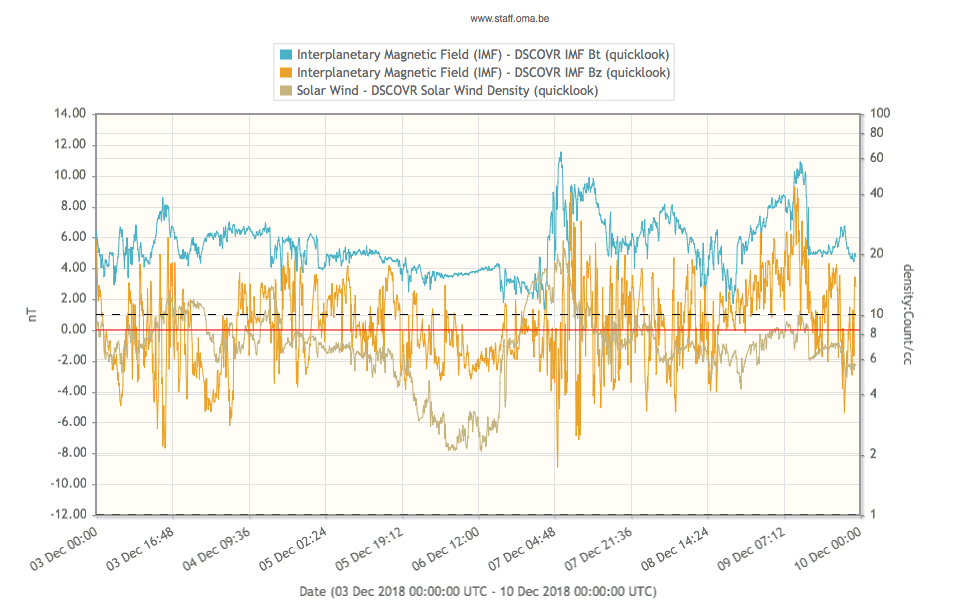
Before the arrival of the fast solar wind, the interplanetary magnetic field and the number of particles increased. The fast solar wind catches up with the slow solar wind. This results in a compressed structure in the solar wind called a co-rotating interaction region. The Bz-component of the interplanetary magnetic field fluctuated between -10 nT and 10 nT. A negative Bz can trigger disturbances in the Earth magnetic field.
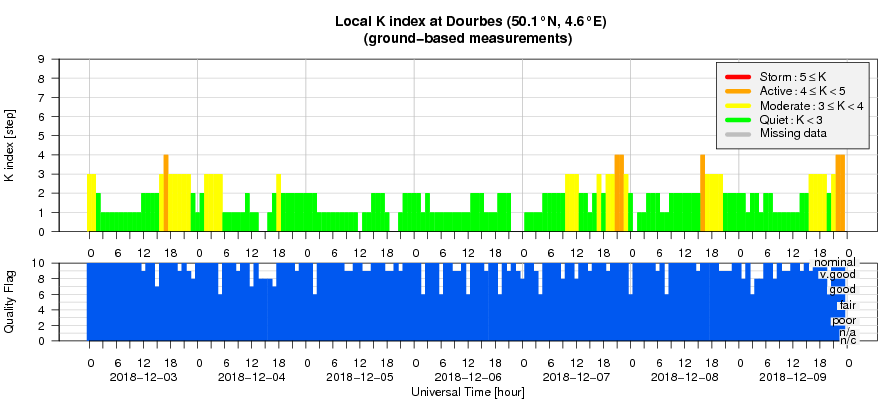
The response of the Earth magnetic field
The geomagnetic conditions were quiet to unsettled with a several but short periods of active condition observed by the local station in Dourbes and the NOAA K-index (K-Dourbs=4, Kp=4).
Geomagnetic Observations at Dourbes (3 Dec 2018 - 9 Dec 2018)
The SIDC space weather Briefing
The Space Weather Briefing presented by the forecaster on duty from December 03 to 09. It reflects in images and graphs what is written in the Solar and Geomagnetic Activity report.
The pdf-version: http://www.stce.be/briefings/20181210_SWbriefing.pdf
The automatically running presentation: http://www.stce.be/briefings/20181210_SWbriefing.ppsm
Review of ionospheric activity (3 Dec 2018 - 9 Dec 2018)
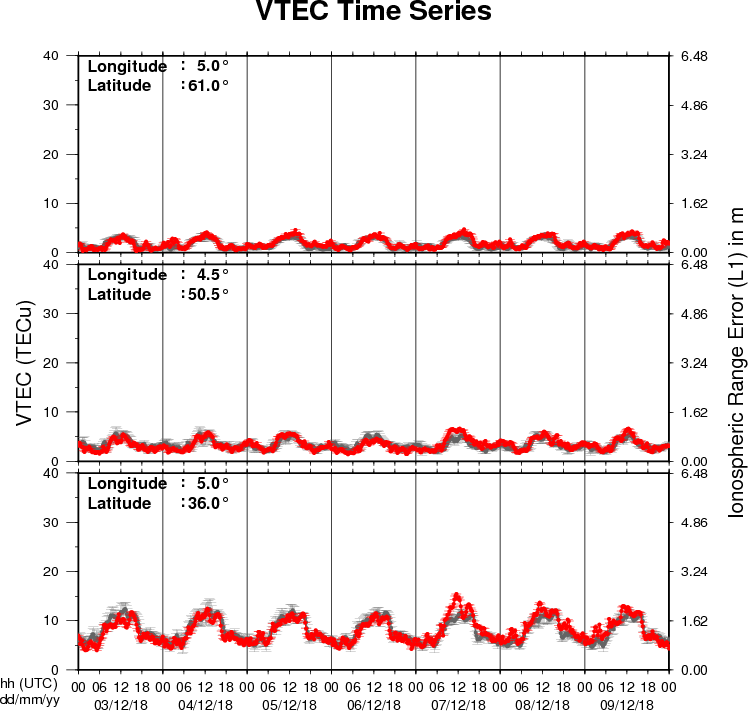
The figure shows the time evolution of the Vertical Total Electron Content (VTEC) (in red) during the last week at three locations:
a) in the northern part of Europe(N61°, 5°E)
b) above Brussels(N50.5°, 4.5°E)
c) in the southern part of Europe(N36°, 5°E)
This figure also shows (in grey) the normal ionospheric behaviour expected based on the median VTEC from the 15 previous days.
The VTEC is expressed in TECu (with TECu=10^16 electrons per square meter) and is directly related to the signal propagation delay due to the ionosphere (in figure: delay on GPS L1 frequency).
The Sun's radiation ionizes the Earth's upper atmosphere, the ionosphere, located from about 60km to 1000km above the Earth's surface.The ionization process in the ionosphere produces ions and free electrons. These electrons perturb the propagation of the GNSS (Global Navigation Satellite System) signals by inducing a so-called ionospheric delay.
See http://stce.be/newsletter/GNSS_final.pdf for some more explanations ; for detailed information, see http://gnss.be/ionosphere_tutorial.php