- Table of Content
- 1.Happy New Year...
- 2.Review of sola...
- 3.PROBA2 Observa...
- 4.Geomagnetic Ob...
- 5.The SIDC space...
- 6.Review of iono...
- 7.Review of sola...
- 8.PROBA2 Observa...
- 9.Geomagnetic Ob...
- 10.The SIDC space...
- 11.Review of iono...
- 12.The Internatio...
2. Review of solar and geomagnetic activity (17 Dec 2018 - 23 Dec 2018)
3. PROBA2 Observations (17 Dec 2018 - 23 Dec 2018)
4. Geomagnetic Observations at Dourbes (17 Dec 2018 - 23 Dec 2018)
5. The SIDC space weather briefing (17 Dec 2018 - 23 Dec 2018)
6. Review of ionospheric activity (17 Dec 2018 - 23 Dec 2018)
7. Review of solar and geomagnetic activity (24 Dec 2018 - 30 Dec 2018)
8. PROBA2 Observations (24 Dec 2018 - 30 Dec 2018)
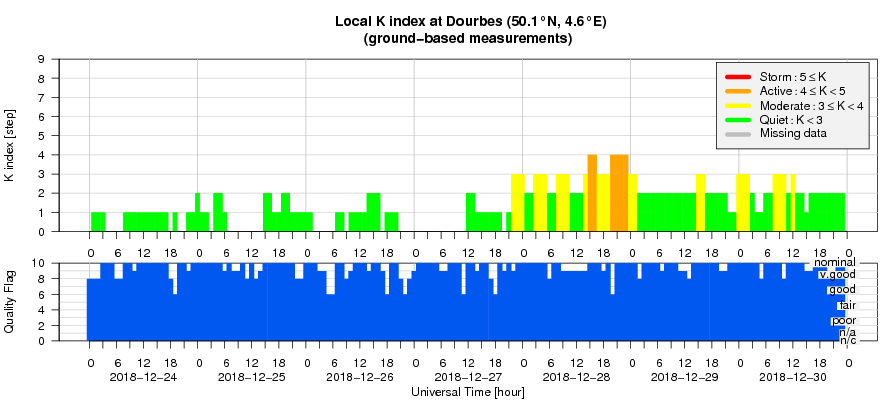
9. Geomagnetic Observations at Dourbes (24 Dec 2018 - 30 Dec 2018)
10. The SIDC space weather briefing (24 Dec 2018 - 30 Dec 2018)
11. Review of ionospheric activity (24 Dec 2018 - 30 Dec 2018)
12. The International Sunspot Number
Happy New Year!
Our warmest wishes for a wonderful 2019!

Review of solar and geomagnetic activity (17 Dec 2018 - 23 Dec 2018)
Solar activity
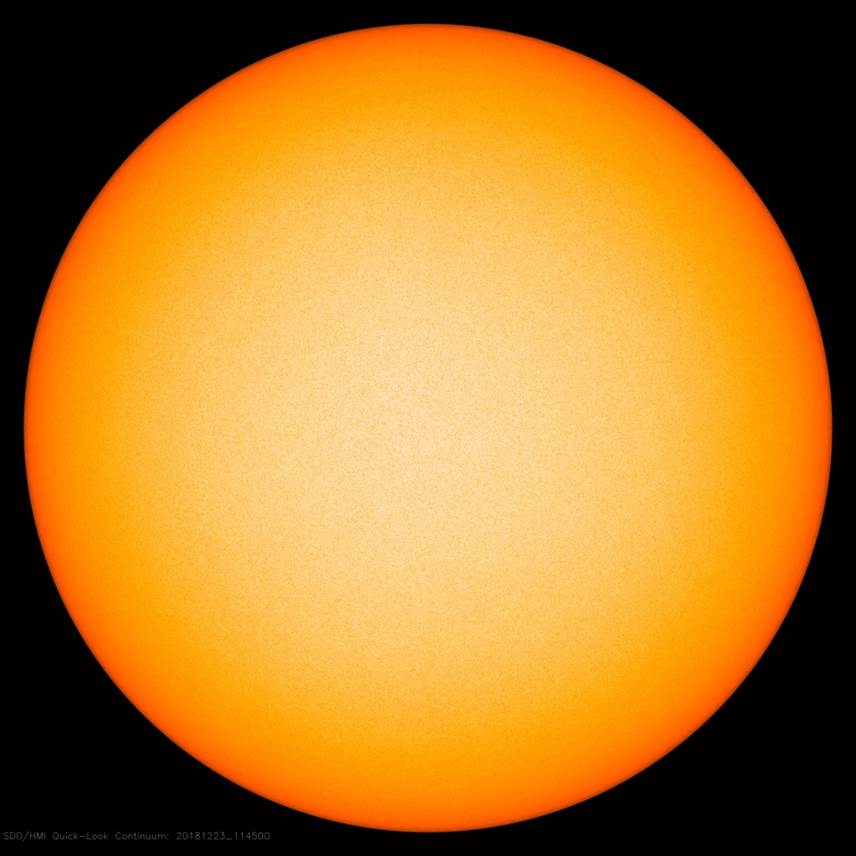
The Sun was spotless throughout the week, and only exhibited small coronal hole regions, as a consequence solar and heliospheric activity was low throughout the week. There were no significant flares recorded. There were no filament eruptions nor Earth-directed CMEs. The greater than 10 MeV proton flux was at nominal levels throughout the week.
Geomagnetic activity
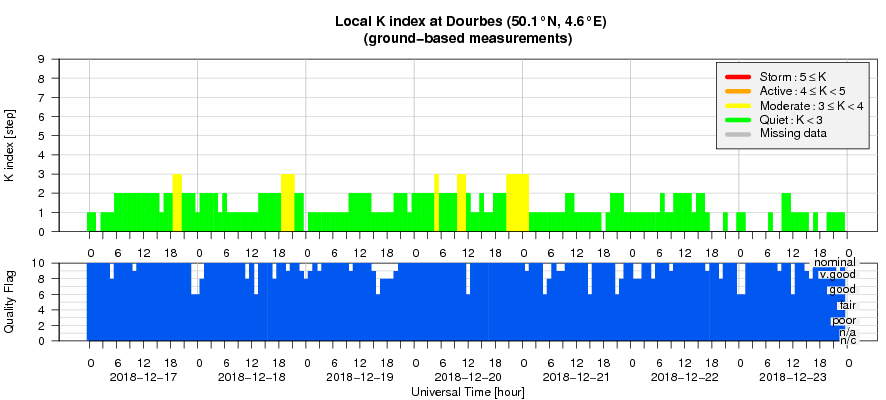
At the start of the week, the Earth came under the influence of a high speed stream associated with a negative polarity extension of the southern polar coronal hole. Solar wind speeds registered by DSCOVR rose from around 400 km/s peaking at 620 km/s on 20 December 2018 before declining back to background levels. The magnitude of the Interplanetary Magnetic Field (IMF) reached around 9 nT, with Bz fluctuating between -7 and +6 nT. Apart from a few moderate intervals of activity (K Dourbes = 3) on 17, 18 and 20 December, quiet geomagnetic conditions were registered throughout the week.

PROBA2 Observations (17 Dec 2018 - 23 Dec 2018)
Solar Activity
Solar flare activity remained very low during the week.
In order to view the activity of this week in more detail, we suggest to go to the following website from which all the daily (normal and difference) movies can be accessed: http://proba2.oma.be/ssa
This page also lists the recorded flaring events.
A weekly overview movie can be found here (SWAP week 456): http://proba2.oma.be/swap/data/mpg/movies/weekly_movies/weekly_movie_2018_12_17.mp4
Details about some of this week's events, can be found further below.
If any of the linked movies are unavailable they can be found in the P2SC movie repository here: http://proba2.oma.be/swap/data/mpg/movies/
Wednesday Dec 19
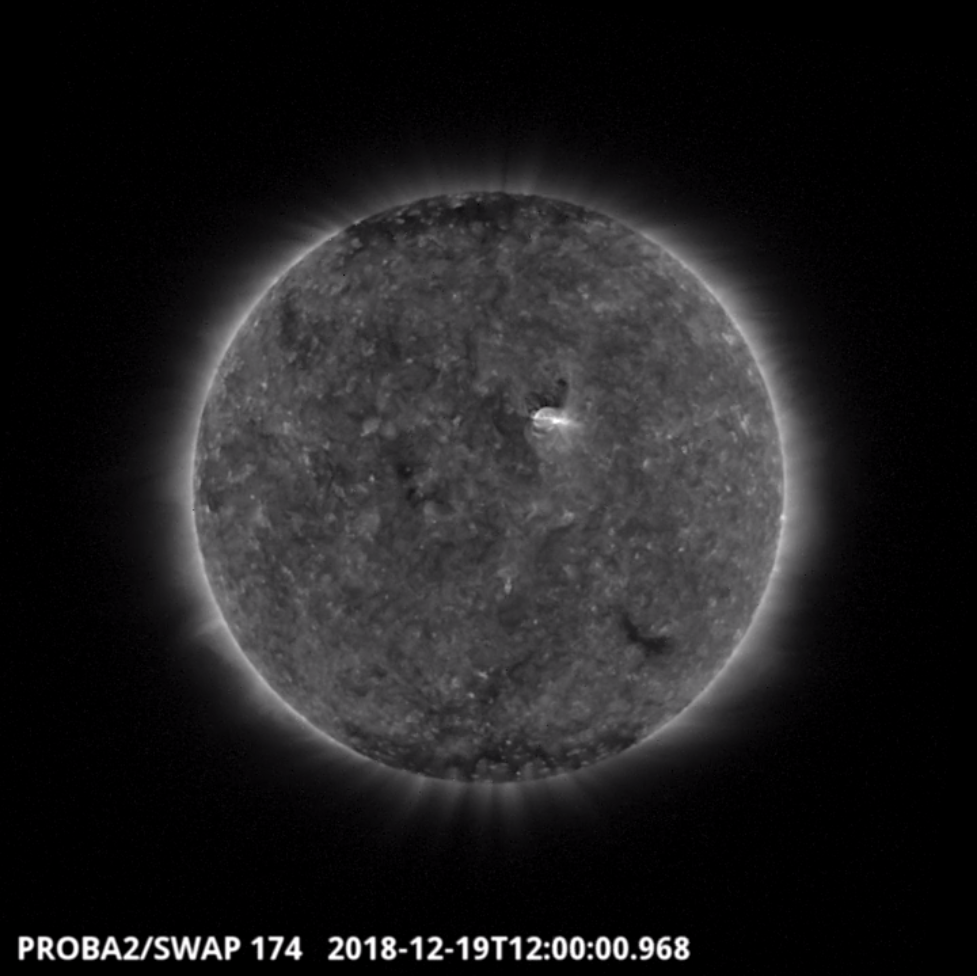
An eruption and dimming, associated with NOAA AR2731, was observed by SWAP on 2018-Dec-19 and is visible near the central meridian in the SWAP image above taken at 12:00 UT.
Find a movie of the event here http://proba2.oma.be/swap/data/mpg/movies/20181219_swap_movie.mp4 (SWAP movie) and here http://proba2.oma.be/swap/data/mpg/movies/20181219_swap_diff.mp4 (SWAP difference movie).
Thursday Dec 20
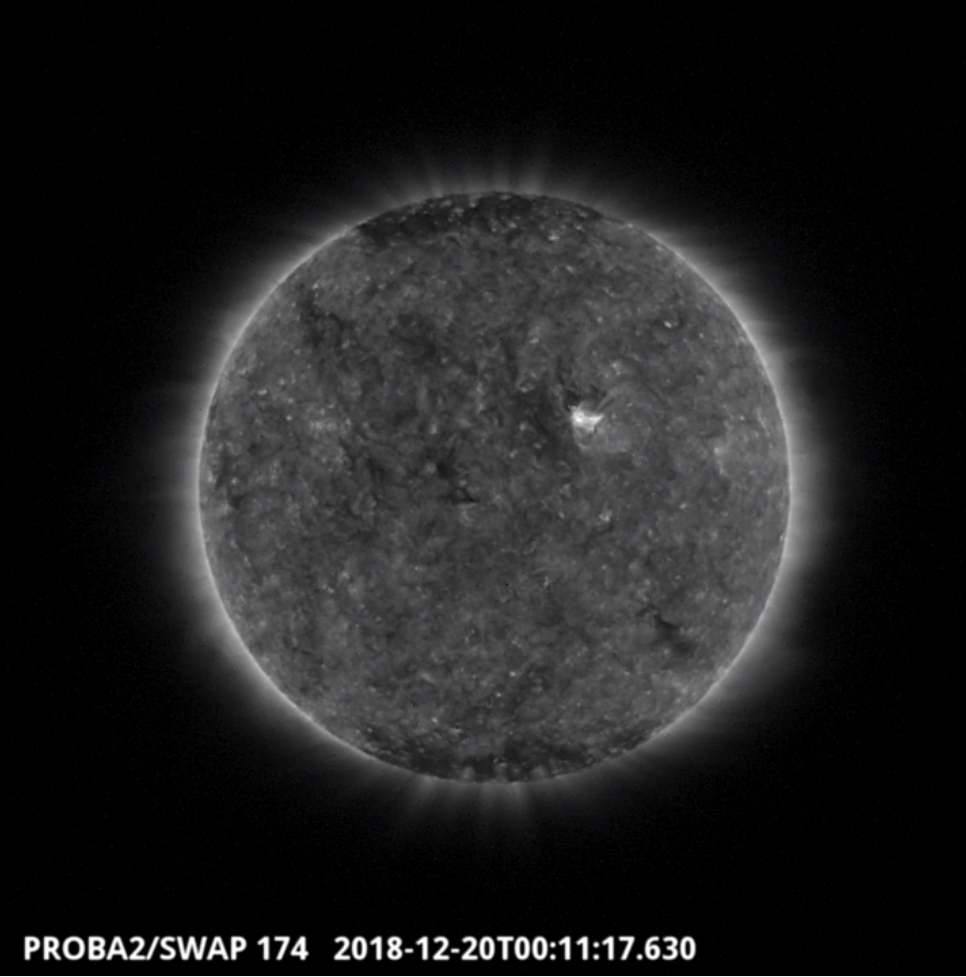
The largest flare of the week (A6.4), which was associated with NOAA AR2731, was observed by SWAP on 2018-Dec-20 and is visible in the north-west of the solar disk in the SWAP image above taken at 00:11 UT.
Find a movie of the event here http://proba2.oma.be/swap/data/mpg/movies/20181220_swap_movie.mp4 (SWAP movie) and here http://proba2.oma.be/swap/data/mpg/movies/20181220_swap_diff.mp4 (SWAP difference movie).
Geomagnetic Observations at Dourbes (17 Dec 2018 - 23 Dec 2018)
The SIDC space weather briefing (17 Dec 2018 - 23 Dec 2018)
The Space Weather Briefing presented by the forecaster on duty from 17-23 December. It reflects in images and graphs what is written in the Solar and Geomagnetic Activity report.

The pdf-version: http://www.stce.be/movies/20181224_SWbriefing.pdf
The automatically running presentation: http://www.stce.be/movies/20181224_SWbriefing_run.wmv
Review of ionospheric activity (17 Dec 2018 - 23 Dec 2018)
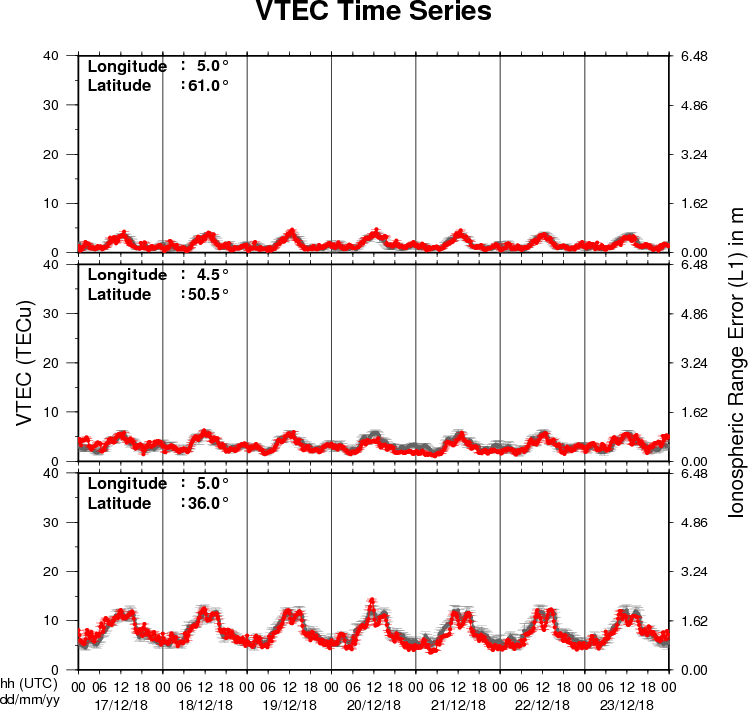
The figure shows the time evolution of the Vertical Total Electron Content (VTEC) (in red) during the last week at three locations:
a) in the northern part of Europe(N61°, 5°E)
b) above Brussels(N50.5°, 4.5°E)
c) in the southern part of Europe(N36°, 5°E)
This figure also shows (in grey) the normal ionospheric behaviour expected based on the median VTEC from the 15 previous days.
The VTEC is expressed in TECu (with TECu=10^16 electrons per square meter) and is directly related to the signal propagation delay due to the ionosphere (in figure: delay on GPS L1 frequency).
The Sun's radiation ionizes the Earth's upper atmosphere, the ionosphere, located from about 60km to 1000km above the Earth's surface.The ionization process in the ionosphere produces ions and free electrons. These electrons perturb the propagation of the GNSS (Global Navigation Satellite System) signals by inducing a so-called ionospheric delay.
See http://stce.be/newsletter/GNSS_final.pdf for some more explanations ; for detailed information, see http://gnss.be/ionosphere_tutorial.php
Review of solar and geomagnetic activity (24 Dec 2018 - 30 Dec 2018)
Solar activity
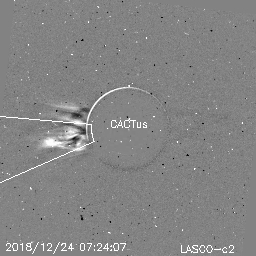
Solar activity was at very low levels. The solar disk was spotless for the entire week. No earth-directed coronal mass ejections (CMEs) were observed. The most significant CME occurred in a region on the Sun's farside on 24 December (see CACTus difference image underneath). The greater than 10 MeV proton flux was at nominal levels. Two coronal holes (CH) were observed: An extension of the positive polarity polar CH transited the central meridian (CM) on 23-25 December, and a negative polarity equatorial CH started its CM transit on 30 December.
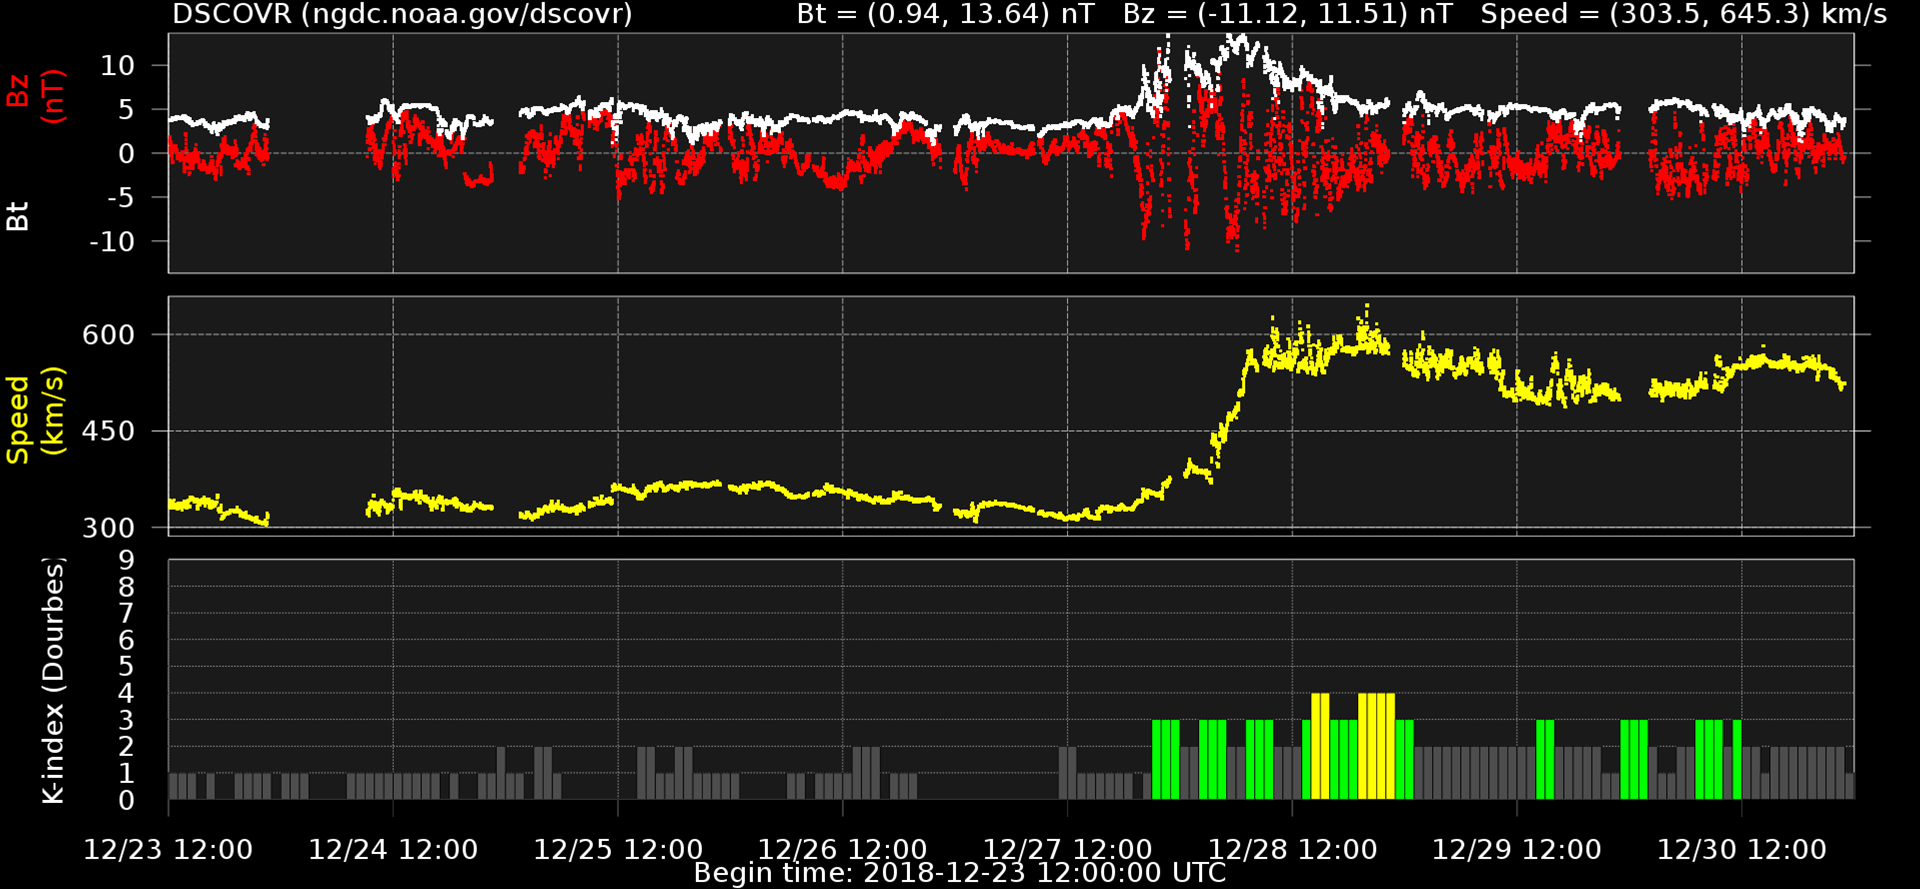
Geomagnetic activity
Solar wind parameters were at nominal levels until late on 27 December. DSCOVR recorded wind speeds varying between 300 and 370 km/s, Bz between -5 and +5 nT, and the interplanetary magnetic field (IMF) was directed towards the Sun (negative sector). The Co-rotating Interaction Region (CIR) associated with the positive polarity coronal hole (CH) arrived at L1 (1st Lagrange point) around 19UT on 27 December. Bz varied between -11 and +10 nT, while the wind speed gradually increased under the influence of the subsequent High Speed Stream (HSS) reaching a maximum around 610 km/s on 28 December. Around 22UT on 27 December, the direction of the IMF switched to away from the Sun (positive sector). The week ended with the earth environment still under the influence of the weakening CH wind stream, with Bz varying between -3 and +4 nT, and wind speed near 520 km/s.
Quiet geomagnetic conditions were observed (Kp and K Dourbes) until the arrival of the CIR and HSS. Kp reached minor storming levels on 28 December (06-09UT interval) with several active episodes late on 27 and on 28 December. The local K index at Dourbes reached only active conditions, on 28 December during the 12-15UT and 18-21UT intervals. For the remainder of the week, K Dourbes and Kp were at quiet to unsettled levels.
PROBA2 Observations (24 Dec 2018 - 30 Dec 2018)
Solar Activity
Solar flare activity remained very low during the week.
In order to view the activity of this week in more detail, we suggest to go to the following website from which all the daily (normal and difference) movies can be accessed: http://proba2.oma.be/ssa
This page also lists the recorded flaring events.
A weekly overview movie can be found here (SWAP week 457): http://proba2.oma.be/swap/data/mpg/movies/weekly_movies/weekly_movie_2018_12_24.mp4
Details about some of this week's events, can be found further below.
If any of the linked movies are unavailable they can be found in the P2SC movie repository here: http://proba2.oma.be/swap/data/mpg/movies/
Friday Dec 28
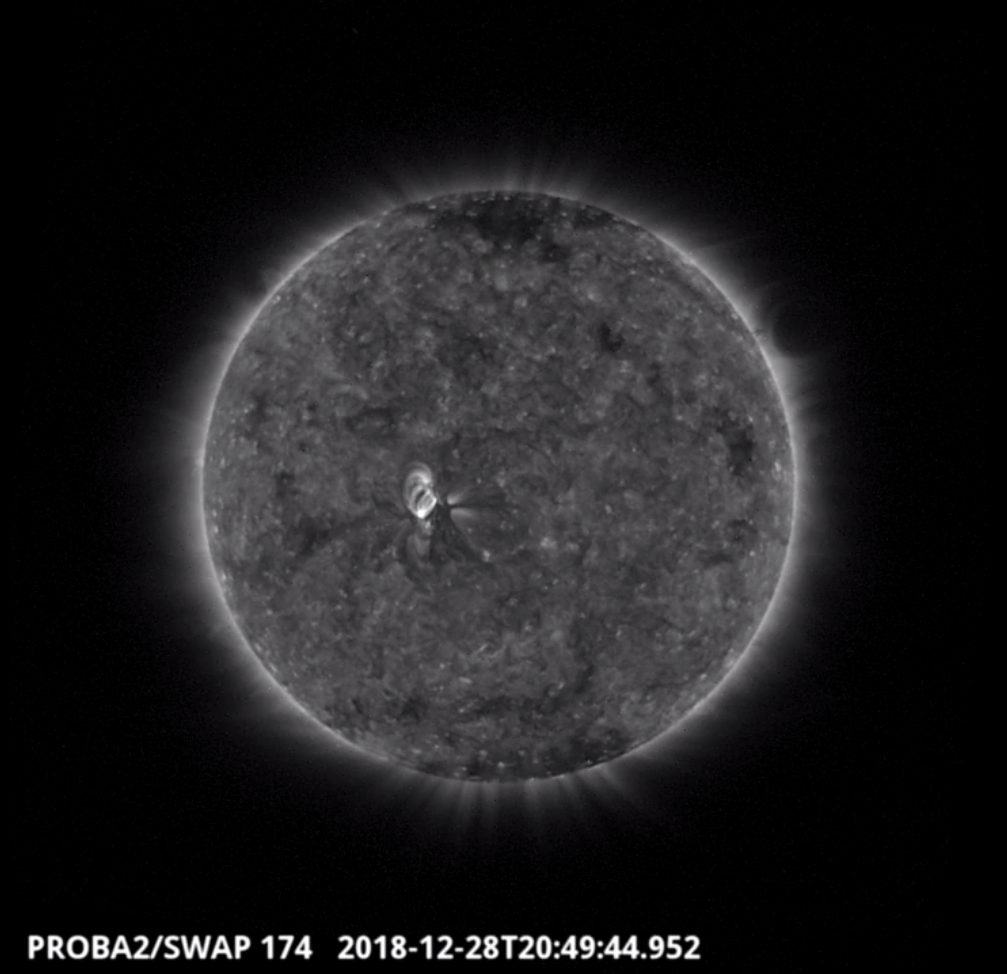
Bright loops were observed above NOAA AR2732 by SWAP on 2018-Dec-28 as shown in the SWAP image above taken at 20:49 UT.
Find a movie of the event here (SWAP movie): http://proba2.oma.be/swap/data/mpg/movies/20181228_swap_movie.mp4
Geomagnetic Observations at Dourbes (24 Dec 2018 - 30 Dec 2018)
The SIDC space weather briefing (24 Dec 2018 - 30 Dec 2018)
The Space Weather Briefing presented by the forecaster on duty from 24-30 December. It reflects in images and graphs what is written in the Solar and Geomagnetic Activity report.

The pdf-version: http://www.stce.be/movies/20181231_SWbriefing.pdf
The automatically running presentation: http://www.stce.be/movies/20181231_SWbriefing_run.wmv
Review of ionospheric activity (24 Dec 2018 - 30 Dec 2018)
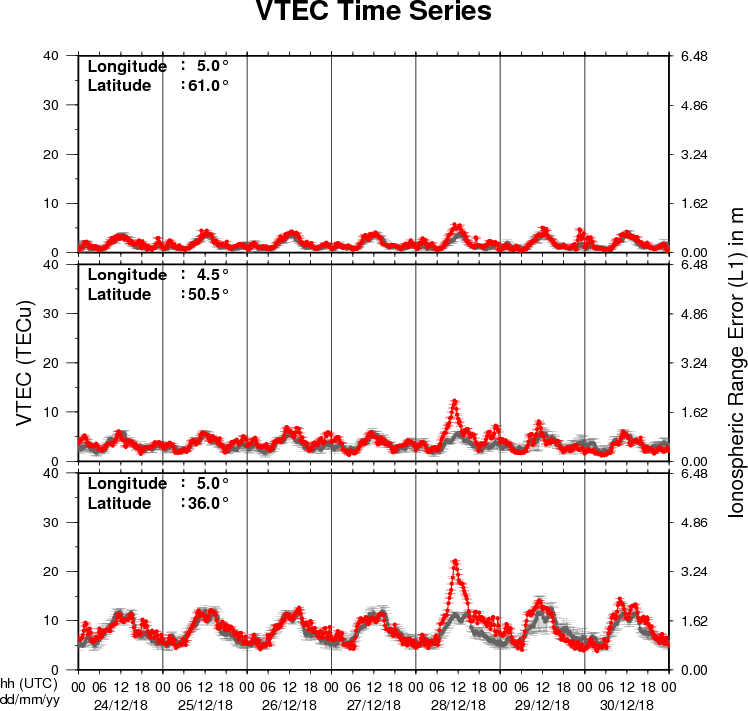
The figure shows the time evolution of the Vertical Total Electron Content (VTEC) (in red) during the last week at three locations:
a) in the northern part of Europe(N61°, 5°E)
b) above Brussels(N50.5°, 4.5°E)
c) in the southern part of Europe(N36°, 5°E)
This figure also shows (in grey) the normal ionospheric behaviour expected based on the median VTEC from the 15 previous days.
The VTEC is expressed in TECu (with TECu=10^16 electrons per square meter) and is directly related to the signal propagation delay due to the ionosphere (in figure: delay on GPS L1 frequency).
The Sun's radiation ionizes the Earth's upper atmosphere, the ionosphere, located from about 60km to 1000km above the Earth's surface.The ionization process in the ionosphere produces ions and free electrons. These electrons perturb the propagation of the GNSS (Global Navigation Satellite System) signals by inducing a so-called ionospheric delay.
See http://stce.be/newsletter/GNSS_final.pdf for some more explanations ; for detailed information, see http://gnss.be/ionosphere_tutorial.php
The International Sunspot Number
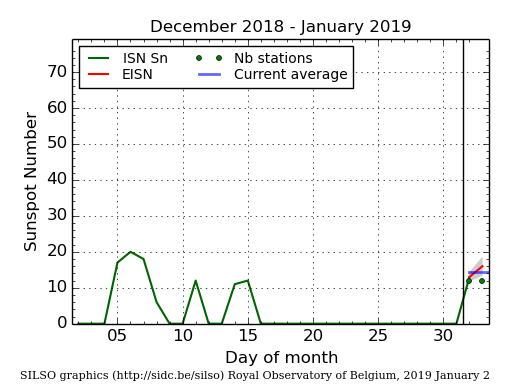
The daily Estimated International Sunspot Number (EISN, red curve with shaded error) derived by a simplified method from real-time data from the worldwide SILSO network. It extends the official Sunspot Number from the full processing of the preceding month (green line). The plot shows the last 30 days (about one solar rotation). The horizontal blue line shows the current monthly average, while the green dots give the number of stations included in the calculation of the EISN for each day.