- Table of Content
- 1.A new Topical ...
- 2.PROBA2 Observa...
- 3.Review of sola...
- 4.The Internatio...
- 5.Review of geom...
- 6.Geomagnetic Ob...
- 7.The SIDC Space...
- 8.Review of iono...
2. PROBA2 Observations (31 Dec 2018 - 6 Jan 2019)
3. Review of solar activity
4. The International Sunspot Number
5. Review of geomagnetic activity
6. Geomagnetic Observations at Dourbes (31 Dec 2018 - 6 Jan 2019)
7. The SIDC Space Weather Briefing
8. Review of ionospheric activity (31 Dec 2018 - 6 Jan 2019)
A new Topical Issue for the SWSC Journal
Benefiting from the highly successful ESWW15 (http://www.stce.be/esww2018/ ), the open-access Journal of Space Weather and Space Climate (JSWSC - https://www.swsc-journal.org/ ) has opened a new topical issue (TI), as listed underneath. Questions regarding this topical issue are to be addressed to the topical editor-in-chief, Ryan McGranaghan. For questions concerning the submission process, please contact the Editorial Office (jswsc@edpsciences.org ). Manuscripts have to be submitted in PDF format via the JSWSC online submission tool (https://articlestatus.edpsciences.org/is/swsc/ ) before the 30 April 2019 deadline.
This topical issue is completely open to all contributors, i.e. they are NOT limited to ESWW15 conference participants.
Topical Issue: Space Weather research in the Digital Age and across the full data lifecycle
Scope and guidelines are at https://www.swsc-journal.org/news
The Topical Editor-in-Chief is Ryan McGranaghan (rmcgranaghan@astraspace.net )
Deadline for submission: 30 April 2019

PROBA2 Observations (31 Dec 2018 - 6 Jan 2019)
Solar Activity
Solar flare activity fluctuated between very low and low during the week.
In order to view the activity of this week in more detail, we suggest to go to the following website from which all the daily (normal and difference) movies can be accessed: http://proba2.oma.be/ssa
This page also lists the recorded flaring events.
A weekly overview movie can be found here (SWAP week 458).
http://proba2.oma.be/swap/data/mpg/movies/weekly_movies/weekly_movie_2018_12_31.mp4
Details about some of this week's events, can be found further below.
If any of the linked movies are unavailable they can be found in the P2SC movie repository here
http://proba2.oma.be/swap/data/mpg/movies/
Monday Jan 31
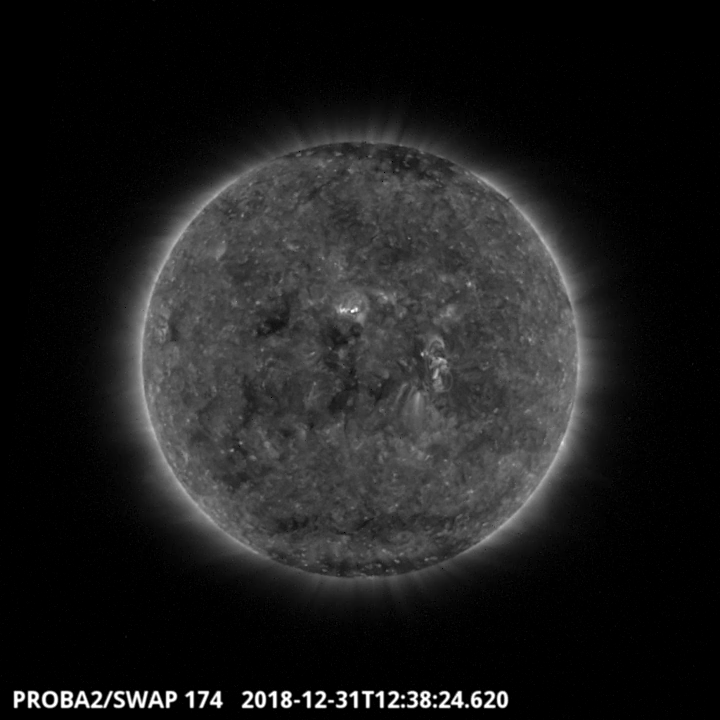
A Coronal hole was visible throughout the week, it transited the central meridian on the 2018-Dec-31 (see SWAP image above). Find a movie of the events here (SWAP movie)
http://proba2.oma.be/swap/data/mpg/movies/weekly_movies/weekly_movie_2018_12_31.mp4
Sunday Jan 06
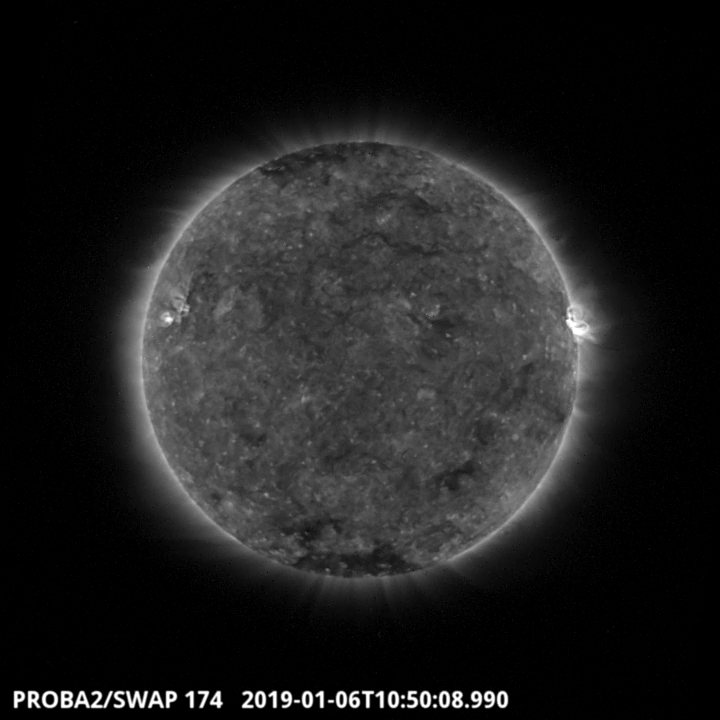
The biggest flare of the week was a C1.6 which occurred on 2019-Jan-06 peaking around 10:50 UT. It erupted from the NOAA region 2732. Find a movie of the events here (SWAP movie)
http://proba2.oma.be/swap/data/mpg/movies/20190106_swap_movie.mp4
Review of solar activity
Solar activity was low. Only one active region got numbered: NOAA 2732. It appeared on 1 January in the solar corona. It produced ten B class flares and a C1.6 flare peaking at 10:51 UT January 6.
No earth-directed coronal mass ejections (CMEs) were observed.
The greater than 10 MeV proton flux was at nominal levels.
A negative polarity equatorial coronal hole reached the central meridian on 30 December.
The International Sunspot Number
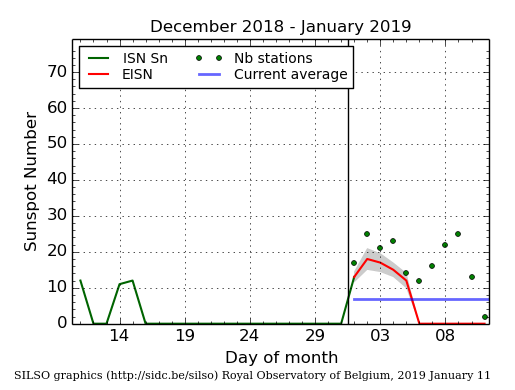
The daily Estimated International Sunspot Number (EISN, red curve with shaded error) derived by a simplified method from real-time data from the worldwide SILSO network. It extends the official Sunspot Number from the full processing of the preceding month (green line). The plot shows the last 30 days (about one solar rotation). The horizontal blue line shows the current monthly average, while the green dots give the number of stations included in the calculation of the EISN for each day.
Review of geomagnetic activity
The Co-rotating Interaction Region (CIR) associated with the negative polarity coronal hole that reached the central meridian on December 30, arrived at L1 (1st Lagrange point) on 4 January. The z-component of the magnetic field (Bz) carried by the solar wind varied between -9 and +9 nT from that point in time until January 5, noon. The solar wind speed increased from 300 km/s on January 4 to 550 km/s on January 6. This High Speed Stream (HSS) carried a less strong magnetic field with a value of around 4 nT.
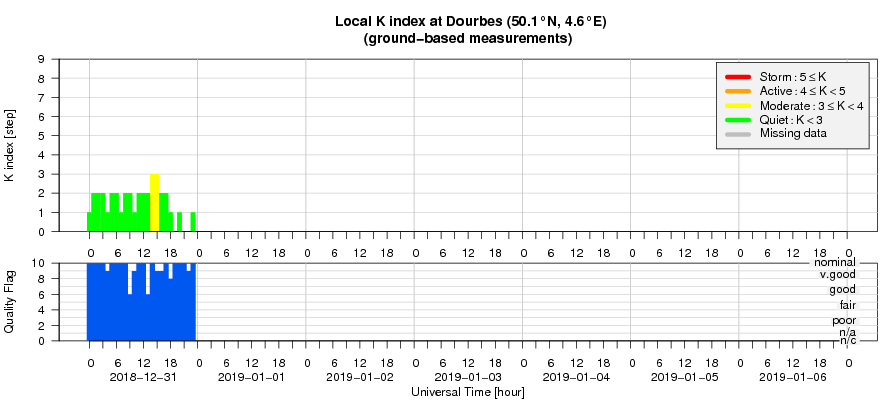
The CIR and HSS induced a minor planetary geostorm on 5 January (00-03UT interval) followed by an active conditions (03-06UT). The local K index in Dourbes reached the value of 4 on 5 January (03-06 UT) and on 6 January (00-03UT).
Geomagnetic Observations at Dourbes (31 Dec 2018 - 6 Jan 2019)
The SIDC Space Weather Briefing
The Space Weather Briefing presented by the forecaster on duty from 31 Dec 2018 to 6 Jan 2019. It reflects in images and graphs what is written in the Solar and Geomagnetic Activity report.
The pdf-version: http://www.stce.be/briefings/20190107_SWbriefing.pdf
The automatically running presentation: http://www.stce.be/briefings/20190107_SWbriefing.ppsm
Review of ionospheric activity (31 Dec 2018 - 6 Jan 2019)
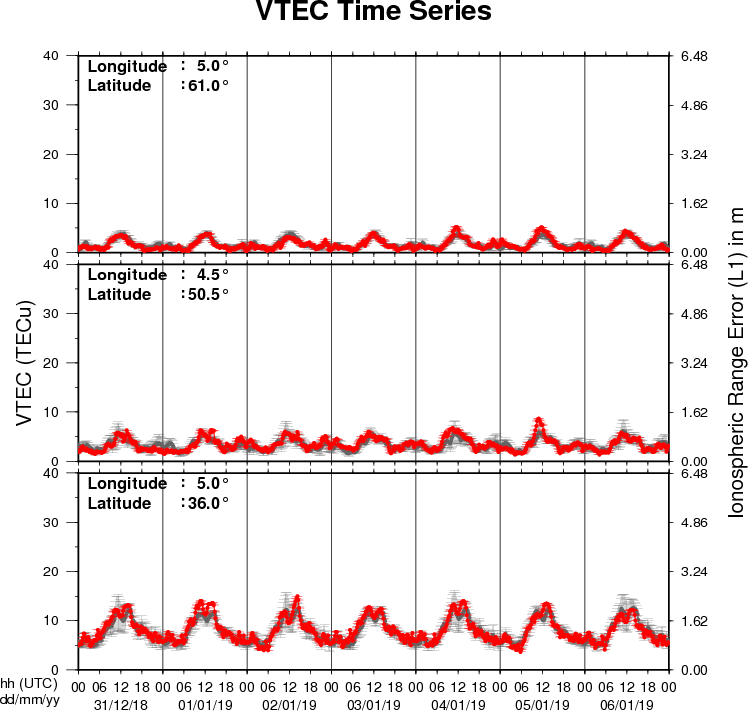
The figure shows the time evolution of the Vertical Total Electron Content (VTEC) (in red) during the last week at three locations:
a) in the northern part of Europe(N61°, 5°E)
b) above Brussels(N50.5°, 4.5°E)
c) in the southern part of Europe(N36°, 5°E)
This figure also shows (in grey) the normal ionospheric behaviour expected based on the median VTEC from the 15 previous days.
The VTEC is expressed in TECu (with TECu=10^16 electrons per square meter) and is directly related to the signal propagation delay due to the ionosphere (in figure: delay on GPS L1 frequency).
The Sun's radiation ionizes the Earth's upper atmosphere, the ionosphere, located from about 60km to 1000km above the Earth's surface.The ionization process in the ionosphere produces ions and free electrons. These electrons perturb the propagation of the GNSS (Global Navigation Satellite System) signals by inducing a so-called ionospheric delay.
See http://stce.be/newsletter/GNSS_final.pdf for some more explanations ; for detailed information, see http://gnss.be/ionosphere_tutorial.php