- Table of Content
- 1.C-class flare!
- 2.PROBA2 Observa...
- 3.Review of sola...
- 4.The Internatio...
- 5.Review of geom...
- 6.Geomagnetic Ob...
- 7.The SIDC Space...
- 8.Review of iono...
2. PROBA2 Observations (7 Jan 2019 - 13 Jan 2019)
3. Review of solar activity
4. The International Sunspot Number
5. Review of geomagnetic activity
6. Geomagnetic Observations at Dourbes (7 Jan 2019 - 13 Jan 2019)
7. The SIDC Space Weather Briefing
8. Review of ionospheric activity (7 Jan 2019 - 13 Jan 2019)
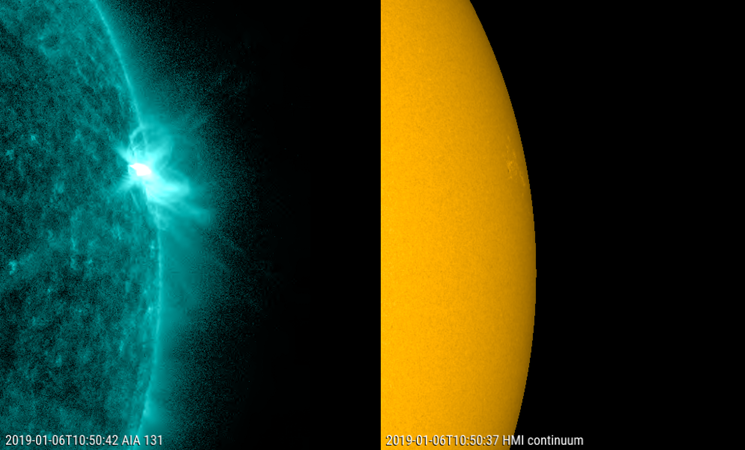
C-class flare!
With the Sun being spotless for so many days, it is no surprise that almost no solar flares are observed. Yet the Sun produced an isolated C1 flare on 6 January, peaking at 10:51UT. The source region was the almost spotless active region NOAA 2732, close to the Sun's west limb. No coronal mass ejection was associated with this solar flare. The full disk imagery underneath shows the flare at its peak in extreme ultraviolet (SDO/AIA 131; top), followed by a comparison with a white light image (SDO/HMI), zooming in on the active region. The flare appears to have taken place over the trailing portion of NOAA 2732, where still a tiny sunspot can be seen.

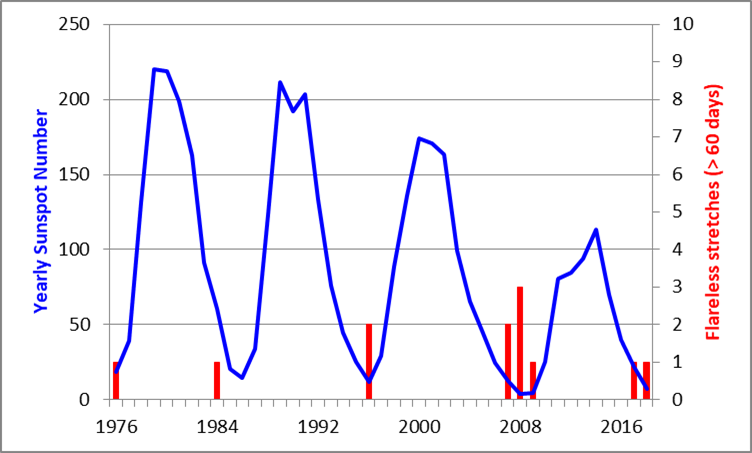
This is the first C-class flare since 6 July 2018, when a C1 event was recorded from a region behind the east limb (see this STCE newsitem at http://www.stce.be/news/430/welcome.html ). This means we have had 184 days with no significant flaring (C-class or higher), which is a typical value for deep solar cycle minima. Since the GOES observations started in 1976, the longest stretch without C-class flares was from 3 April till 3 November 2008. That's 214 consecutive days of very low solar activity! Only a dozen of these "flareless" periods (no C-, M- or X-class flares for more than 60 days) have been observed, and half have occurred during the previous solar cycle minimum.
PROBA2 Observations (7 Jan 2019 - 13 Jan 2019)
Solar Activity
Solar flare activity remained very low during the week.
In order to view the activity of this week in more detail, we suggest to go to the following website from which all the daily (normal and difference) movies can be accessed: http://proba2.oma.be/ssa
This page also lists the recorded flaring events.
A weekly overview movie can be found here (SWAP week 459): http://proba2.oma.be/swap/data/mpg/movies/weekly_movies/weekly_movie_2019_01_07.mp4
Details about some of this week's events, can be found further below.
If any of the linked movies are unavailable they can be found in the P2SC movie repository here: http://proba2.oma.be/swap/data/mpg/movies/
Monday Jan 07
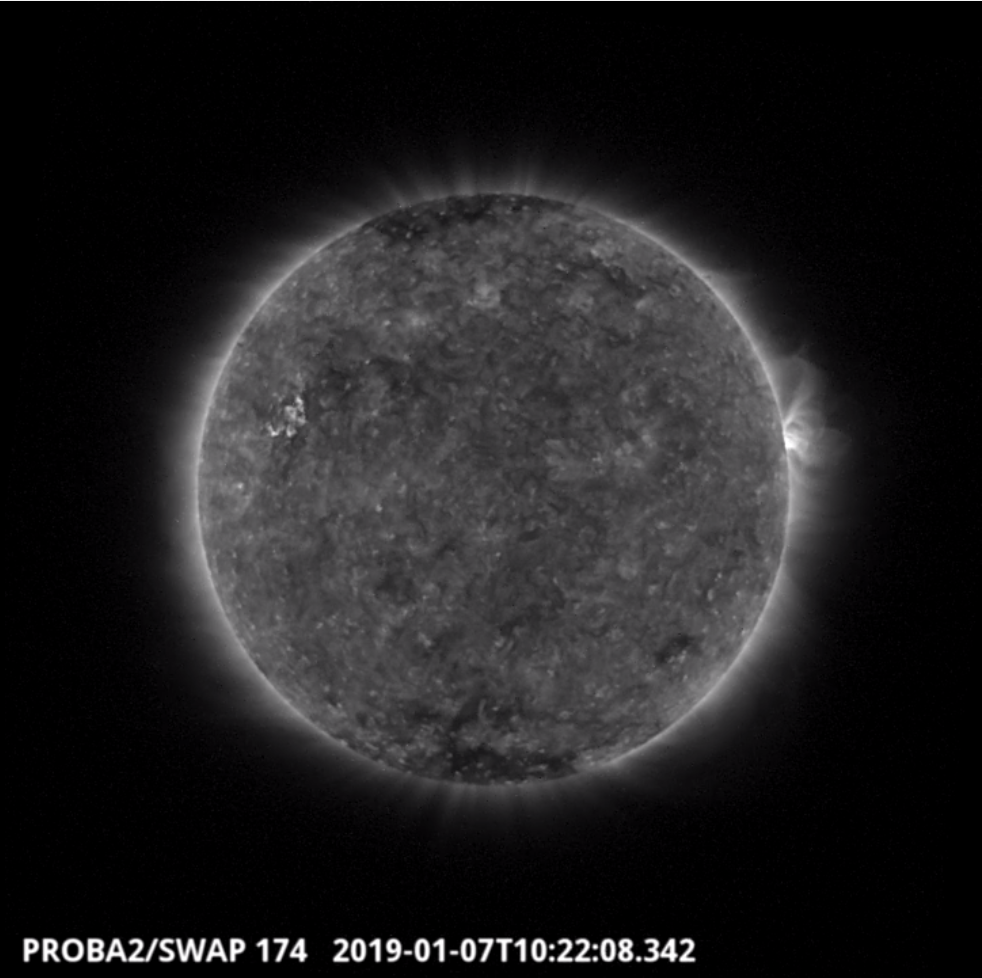
The largest flare of the week (B1.1), which was associated with NOAA AR 2732, was observed by SWAP on 2019-Jan-07 and is visible on the western limb in the SWAP image above taken at 10:22 UT.
Find a movie of the event here (SWAP movie): http://proba2.oma.be/swap/data/mpg/movies/20190107_swap_movie.mp4
Tuesday Jan 08
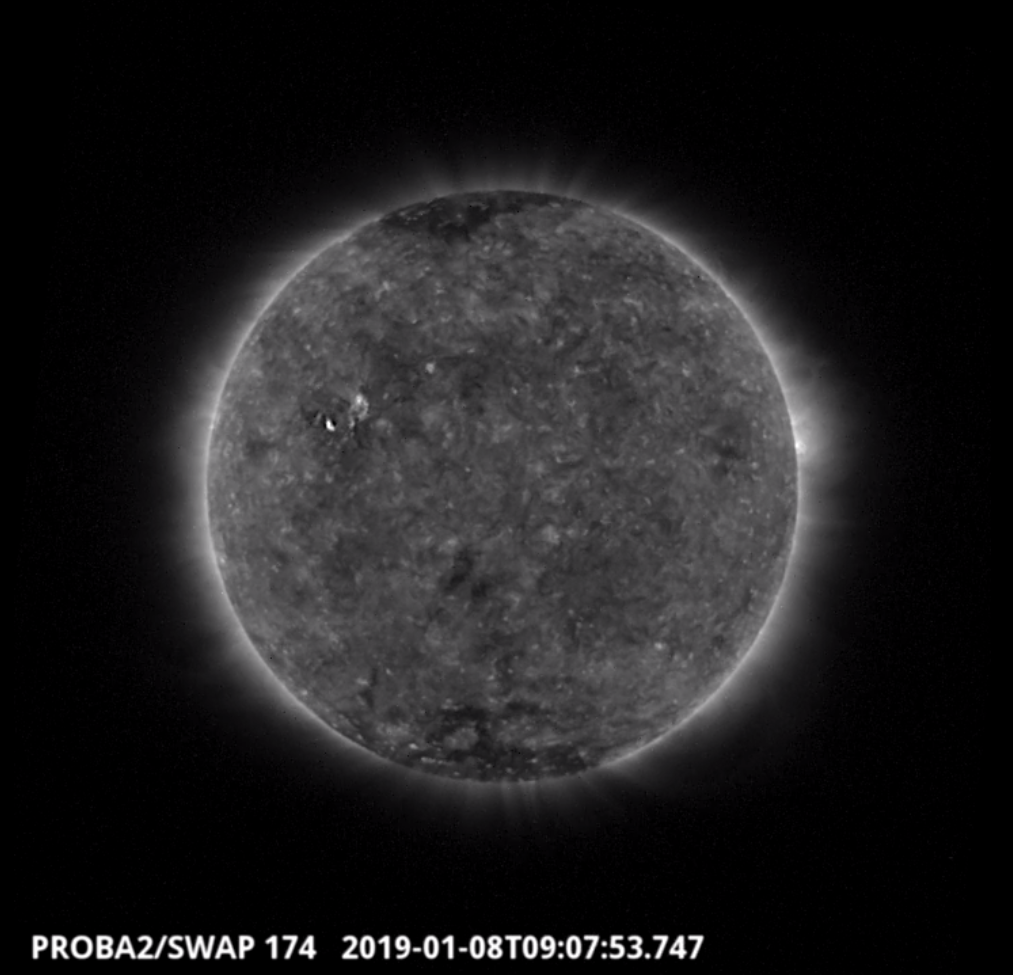
A small brightening and associated flows were observed by SWAP on 2019-Jan-08, visible in the north-eastern quadrant of the solar disk in the image above taken at 09:07 UT.
Find a movie of the event here (SWAP movie) http://proba2.oma.be/swap/data/mpg/movies/20190108_swap_movie.mp4 and here (SWAP difference movie) http://proba2.oma.be/swap/data/mpg/movies/20190108_swap_diff.mp4
Review of solar activity
The solar activity has been very low.
On Jan 07, Catania sunspot group 5 (NOAA active region 2732) produced a small B-flare at 10:23 UT C. That day, the sunspot group turned behind the west limb.
Further in the week, the visible solar disc remained spotless and the X-ray flux remained below the B-level.
Some few narrow and slow solar Coronal Mass Ejections have been observed at the limb but with no Earth directed component.
The greater than 10 MeV solar protons flux remained at nominal levels.
The International Sunspot Number
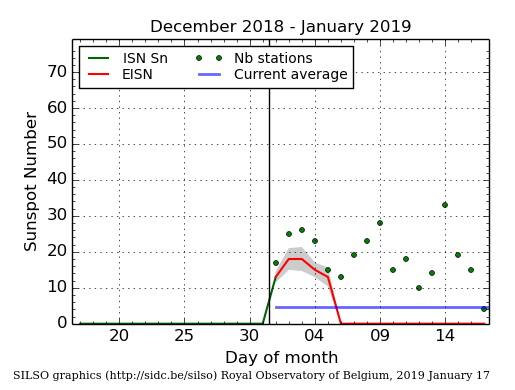
The daily Estimated International Sunspot Number (EISN, red curve with shaded error) derived by a simplified method from real-time data from the worldwide SILSO network. It extends the official Sunspot Number from the full processing of the preceding month (green line). The plot shows the last 30 days (about one solar rotation). The horizontal blue line shows the current monthly average, while the green dots give the number of stations included in the calculation of the EISN for each day.
Review of geomagnetic activity
Until January 10, the Earth environment was under the awakening influence of the coronal hole that reached the central meridian on December 30, 2018. The wind decreased from 550 km/s on January 6 to 350 km/s on January 10.
From January 10 to January 13, the signature of a second, small coronal hole was visible in solar wind data.
The influence of a third coronal hole became visible in the solar wind data from January 13.

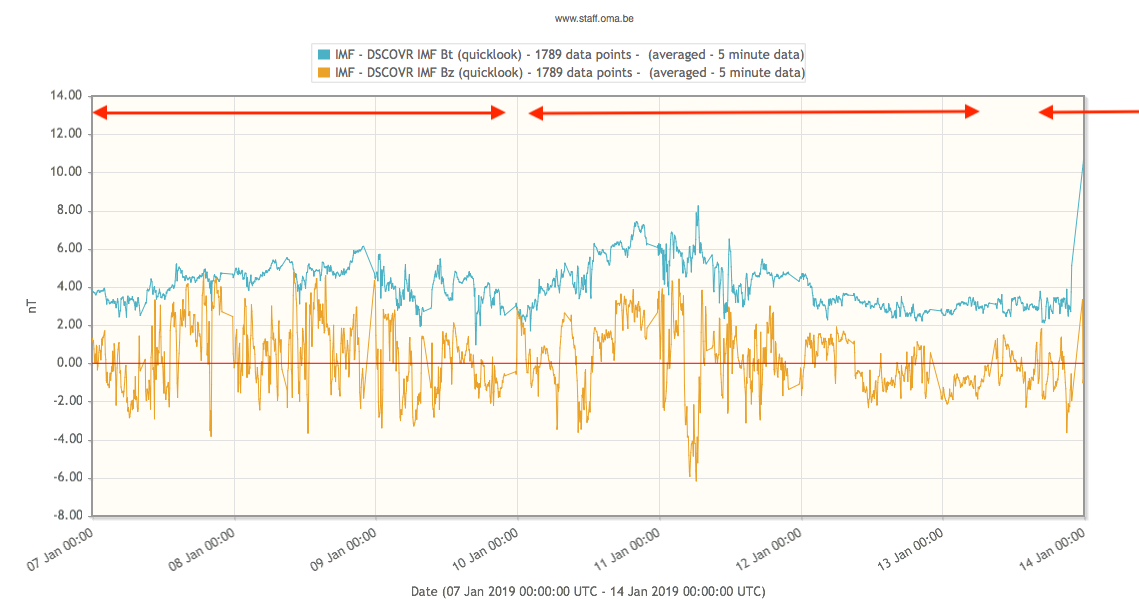
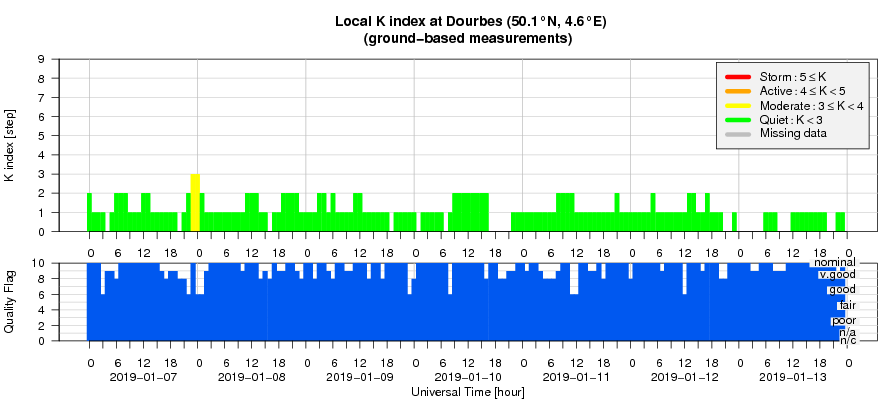
On January 11 at 06:00 UT, the geomagnetic field responded to the slightly disturbed interplanetary magnetic field. This resulted locally in Dourbes in an active 3-hour period (Kp = 4).
Geomagnetic Observations at Dourbes (7 Jan 2019 - 13 Jan 2019)
The SIDC Space Weather Briefing
The Space Weather Briefing presented by the forecaster on duty from … to …. It reflects in images and graphs what is written in the Solar and Geomagnetic Activity report.
The pdf-version: http://www.stce.be/briefings/20190114_SWbriefing.pdf
The automatically running presentation: http://www.stce.be/briefings/20190114_SWbriefing.ppsm
Review of ionospheric activity (7 Jan 2019 - 13 Jan 2019)
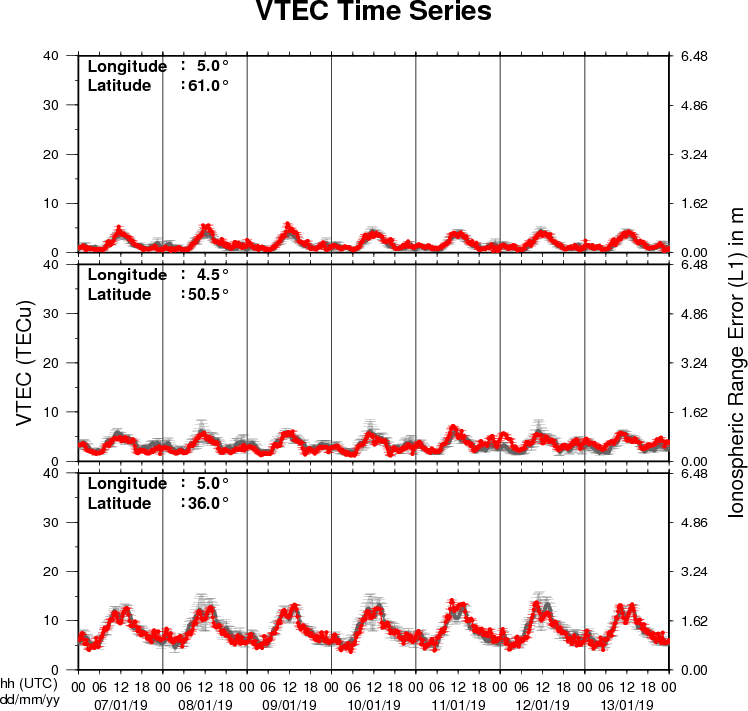
The figure shows the time evolution of the Vertical Total Electron Content (VTEC) (in red) during the last week at three locations:
a) in the northern part of Europe(N61°, 5°E)
b) above Brussels(N50.5°, 4.5°E)
c) in the southern part of Europe(N36°, 5°E)
This figure also shows (in grey) the normal ionospheric behaviour expected based on the median VTEC from the 15 previous days.
The VTEC is expressed in TECu (with TECu=10^16 electrons per square meter) and is directly related to the signal propagation delay due to the ionosphere (in figure: delay on GPS L1 frequency).
The Sun's radiation ionizes the Earth's upper atmosphere, the ionosphere, located from about 60km to 1000km above the Earth's surface.The ionization process in the ionosphere produces ions and free electrons. These electrons perturb the propagation of the GNSS (Global Navigation Satellite System) signals by inducing a so-called ionospheric delay.
See http://stce.be/newsletter/GNSS_final.pdf for some more explanations ; for detailed information, see http://gnss.be/ionosphere_tutorial.php