- Table of Content
- 1.ESWW16 - call ...
- 2.PROBA2 Observa...
- 3.Review of sola...
- 4.The Internatio...
- 5.Geomagnetic Ob...
- 6.The SIDC Space...
- 7.Review of iono...
2. PROBA2 Observations (14 Jan 2019 - 20 Jan 2019)
3. Review of solar and geomagnetic activity
4. The International Sunspot Number
5. Geomagnetic Observations at Dourbes (14 Jan 2019 - 20 Jan 2019)
6. The SIDC Space Weather Briefing
7. Review of ionospheric activity (14 Jan 2019 - 20 Jan 2019)
ESWW16 - call for sessions
European Space Weather Week 16 - http://www.stce.be/esww2019/index.php
November 18-22, 2019, Liège, Belgium
Call for sessions - OPEN
Dear Colleagues
The online submission for ESWW2019 session is open: http://www.stce.be/esww2019/call4sessions.php
Deadline is February 20 2019
You can choose between 3 different flavours of sessions: Service Domain Plenary sessions; Parallel Science and Research sessions; Parallel Open sessions.
more on http://www.stce.be/esww2019/sessionflavours.php
Happy submission!
The programme committee
Our machinery to process your submissions is ready. We are looking forward to it.
PROBA2 Observations (14 Jan 2019 - 20 Jan 2019)
Solar Activity
Solar flare activity was very low during the week.
In order to view the activity of this week in more detail, we suggest to go to the following website from which all the daily (normal and difference) movies can be accessed: http://proba2.oma.be/ssa
This page also lists the recorded flaring events.
A weekly overview movie can be found here (SWAP week 460).
http://proba2.oma.be/swap/data/mpg/movies/weekly_movies/weekly_movie_2019_01_14.mp4
Details about some of this week’s events, can be found further below.
If any of the linked movies are unavailable they can be found in the P2SC movie repository here
http://proba2.oma.be/swap/data/mpg/movies/
Monday Jan 14

A southern coronal hole is visible in the SWAP image above when it transited the central meridian on 2019-Jan-14. Find a movie of the events here (SWAP movie)
http://proba2.oma.be/swap/data/mpg/movies/20190114_swap_movie.mp4
Sunday Jan 20
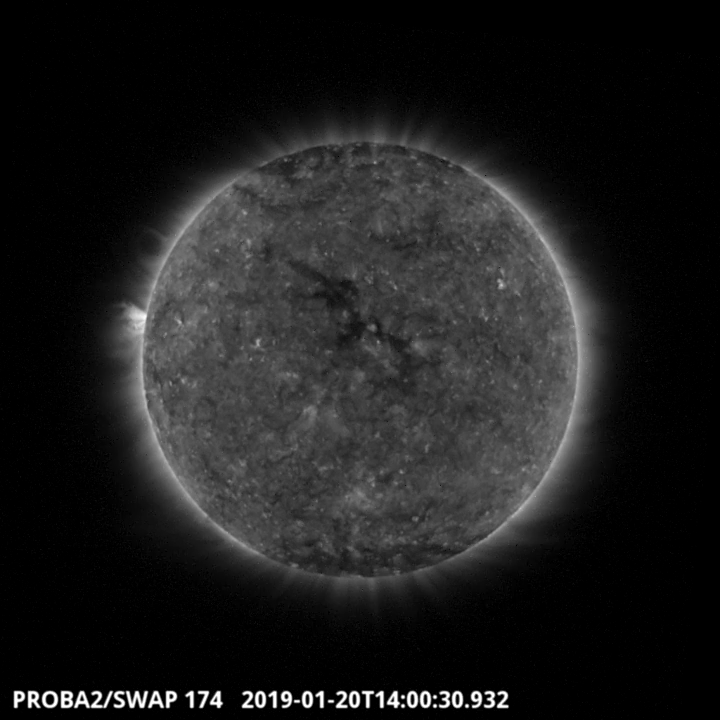
An equatorial coronal hole was visible in SWAP images since 2019-Jan-15, and is shown above on 2019-Jan-20 as it transited the central meridian.
Find a movie of the events here (SWAP movie)
http://proba2.oma.be/swap/data/mpg/movies/20190120_swap_movie.mp4
Review of solar and geomagnetic activity
SOLAR ACTIVITY
Solar X-ray flux remained below B level. The solar disk was spotless the entire week.
No Earth directed CMEs have been recorded.
The proton flux levels were at background values.
GEOMAGNETIC ACTIVITY
Negative polarity coronal holes in the southern solar hemisphere influenced the solar wind near the L1 point. On January 17, the total magnetic field carried by the solar wind peaked at 11nT. Immediately after, the speed of the wind peaked at 520 km/s.
The solar wind caused quiet to unsettled geomagnetic conditions: local K Dourbes and NOAA Kp 0-3.
The International Sunspot Number
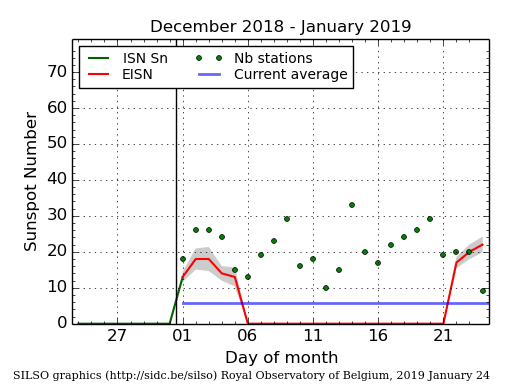
The daily Estimated International Sunspot Number (EISN, red curve with shaded error) derived by a simplified method from real-time data from the worldwide SILSO network. It extends the official Sunspot Number from the full processing of the preceding month (green line). The plot shows the last 30 days (about one solar rotation). The horizontal blue line shows the current monthly average, while the green dots give the number of stations included in the calculation of the EISN for each day.
Geomagnetic Observations at Dourbes (14 Jan 2019 - 20 Jan 2019)

The SIDC Space Weather Briefing
The Space Weather Briefing presented by the forecaster on duty from January 14 to 20. It reflects in images and graphs what is written in the Solar and Geomagnetic Activity report.
The pdf-version: http://www.stce.be/briefings/20190121_SWbriefing.pdf
The automatically running presentation: http://www.stce.be/briefings/20190121_SWbriefing.ppsm
Review of ionospheric activity (14 Jan 2019 - 20 Jan 2019)

The figure shows the time evolution of the Vertical Total Electron Content (VTEC) (in red) during the last week at three locations:
a) in the northern part of Europe(N61°, 5°E)
b) above Brussels(N50.5°, 4.5°E)
c) in the southern part of Europe(N36°, 5°E)
This figure also shows (in grey) the normal ionospheric behaviour expected based on the median VTEC from the 15 previous days.
The VTEC is expressed in TECu (with TECu=10^16 electrons per square meter) and is directly related to the signal propagation delay due to the ionosphere (in figure: delay on GPS L1 frequency).
The Sun's radiation ionizes the Earth's upper atmosphere, the ionosphere, located from about 60km to 1000km above the Earth's surface.The ionization process in the ionosphere produces ions and free electrons. These electrons perturb the propagation of the GNSS (Global Navigation Satellite System) signals by inducing a so-called ionospheric delay.
See http://stce.be/newsletter/GNSS_final.pdf for some more explanations ; for detailed information, see http://gnss.be/ionosphere_tutorial.php