- Table of Content
- 1.C5 flares in N...
- 2.Review of sola...
- 3.PROBA2 Observa...
- 4.The Internatio...
- 5.Review of geom...
- 6.Geomagnetic Ob...
- 7.The SIDC Space...
- 8.Review of iono...
2. Review of solar activity
3. PROBA2 Observations (21 Jan 2019 - 27 Jan 2019)
4. The International Sunspot Number
5. Review of geomagnetic activity
6. Geomagnetic Observations at Dourbes (21 Jan 2019 - 27 Jan 2019)
7. The SIDC Space Weather Briefing
8. Review of ionospheric activity (21 Jan 2019 - 27 Jan 2019)
C5 flares in NOAA 2733
Active region NOAA 2733 started its development late on 21 January, remaining all-in-all a relatively small sunspot group. The trailing portion showed some magnetic mixing, with (small) sunspots of opposite magnetic polarity close to each other. This was the source location of the first C5 flare on 26 January (C5.0 peaking at 13:22UT). The active region then simplified, getting a more open structure and becoming less active. However while approaching the Sun's west limb, some new opposite polarity appeared south of the main leading spot, which had continued to grow over these few days. The new flux rejuvenated the flaring activity in NOAA 2733, which produced several C-class flares on 29 and 30 January. The strongest of the series was a C5.2 flare peaking on 30 January at 06:11UT. These were the strongest flares since the C8.1 flare produced by NOAA 2699 on 7 February 2018. None of the flares were associated with coronal mass ejections.
Underneath some imagery to illustrate the events of the last few days, courtesy SDO/HMI and AIA (https://sdo.gsfc.nasa.gov/ ), and JHelioviewer (http://www.jhelioviewer.org/ ). Movies can be found at the STCE webpage http://www.stce.be/news/447/welcome.html
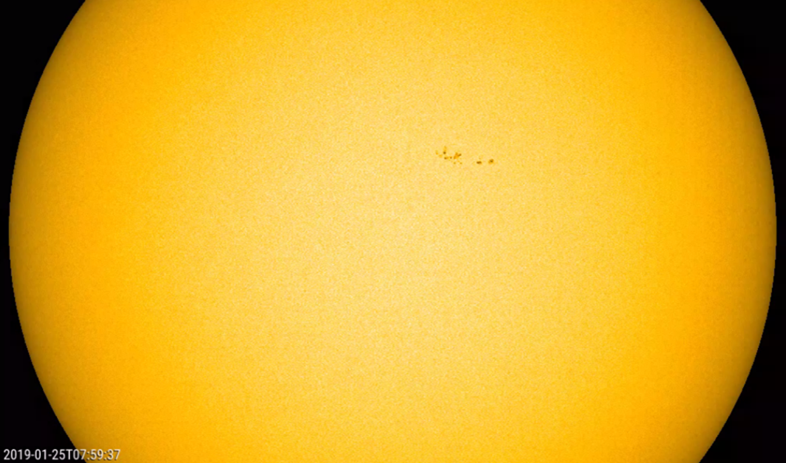
This white light image shows the Sun's full disk with active region NOAA 2733 being magnetically most complex around 25-26 January. Note that the leading spot continued to grow over the subsequent days.
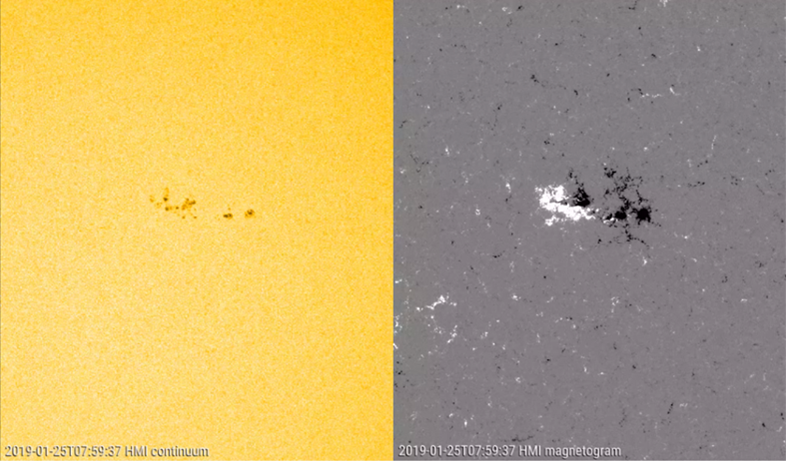
Imagery showing a magnified view of NOAA 2733 in white light as well as a magnetogram, with white meaning magnetic field lines coming out of the Sun, and black meaning field lines returning to the solar interior. Note the small spots of opposite polarity close to each other in the trailing section of the region on 25 and 26 January.
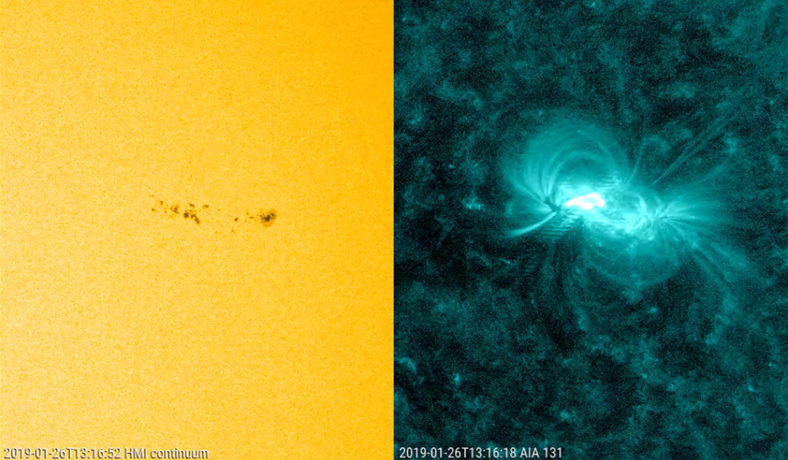
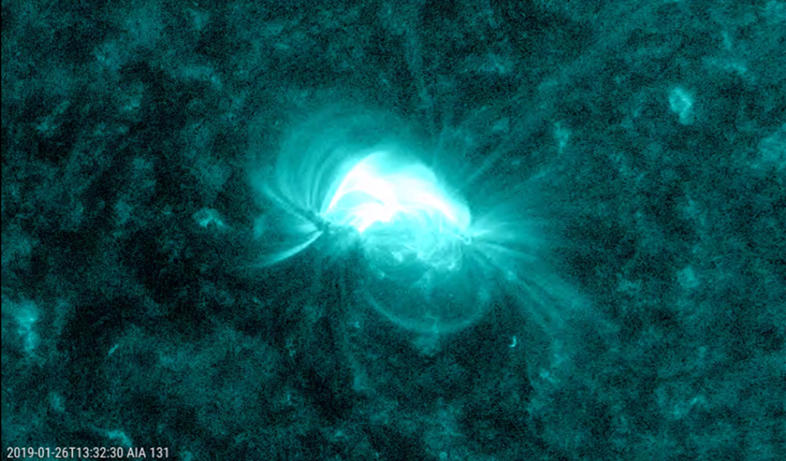
Imagery displaying the first C5 flare, with white light images teamed with extreme ultraviolet (EUV) images from SDO/AIA 131 showing the hot corona at 10 million degrees. The above images show the onset of the C5 flare -clearly in the trailing portion of the region- (top) and a zoom of the flaring region in EUV shortly after the flare's peak (bottom).
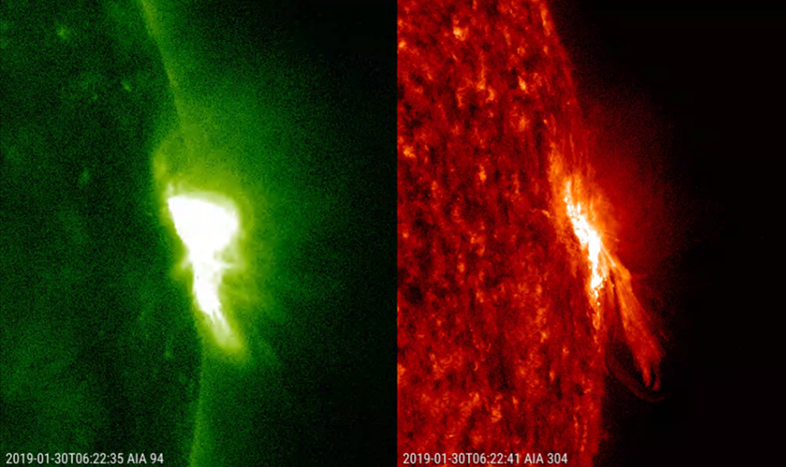
Another magnified view, this time combining EUV images taken by SDO/AIA 094 ("hot" corona at temperatures of about 6 million degrees) and SDO/AIA 304 ("cold" temperatures of only about 80.000 degrees). Displayed is the C5.2 flare shortly after its peak intensity showing a "cold" jet to the south (AIA 304) and a hot area more to the north of the active region.
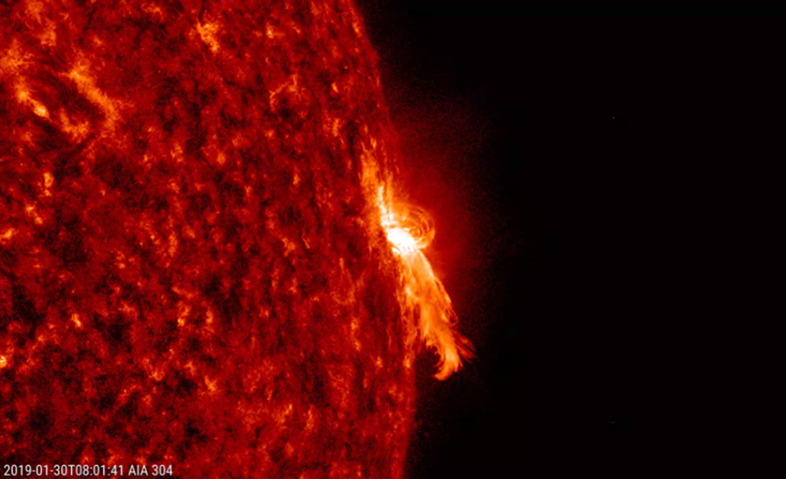
This final image shows the event in EUV at low temperatures (SDO/AIA 304, 80.000 degrees), about 1.5 hours after the peak of the C5.2 flare. Post-flare coronal loops can be seen to the north of the region, as well as another jet to the south. The appearance of these jets seem to indicate that the magnetic environment in NOAA 2733 may have changed compared to the first C5 flare a few days earlier when no such jets were observed in AIA 304.
Review of solar activity
During this week, only one active region was observed on the visible side of the Sun. NOAA Active Region 2733 (no Catania number) emerged on 21 January and was numbered two days later. From then onwards, it had a beta photospheric magnetic field configuration. It was the source of 18 B-class flares and an isolated GOES C5.0 flare (peaked at 13:22 UT on January 26). Only few narrow coronal mass ejections (CMEs) were observed this week, and none of them were earth-directed. The solar protons remained at the background level during the whole week.
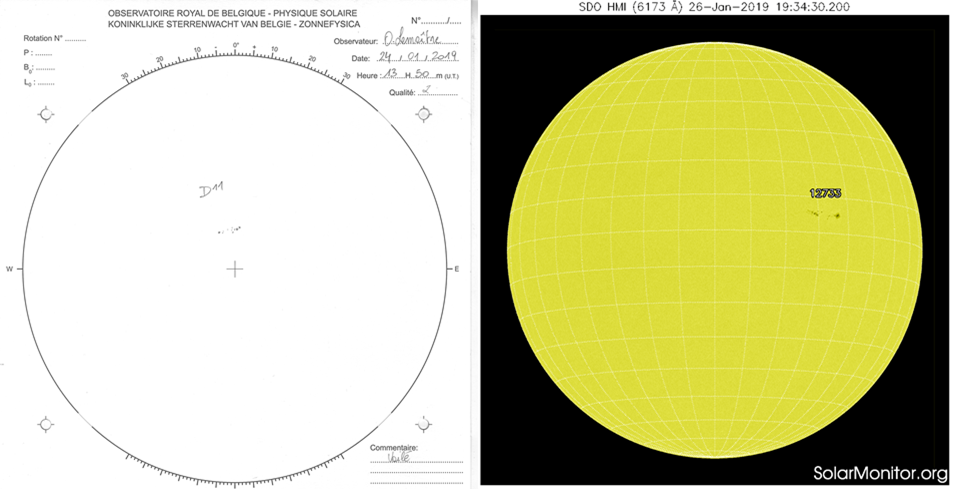
Underneath on the left a drawing of active region NOAA 2733 made by solar observers on 24 January using the USET solar telescope (http://www.sidc.be/uset/ ), and on the right the same region imaged by the SDO/HMI (https://sdo.gsfc.nasa.gov/ ) on 26 January (white light).
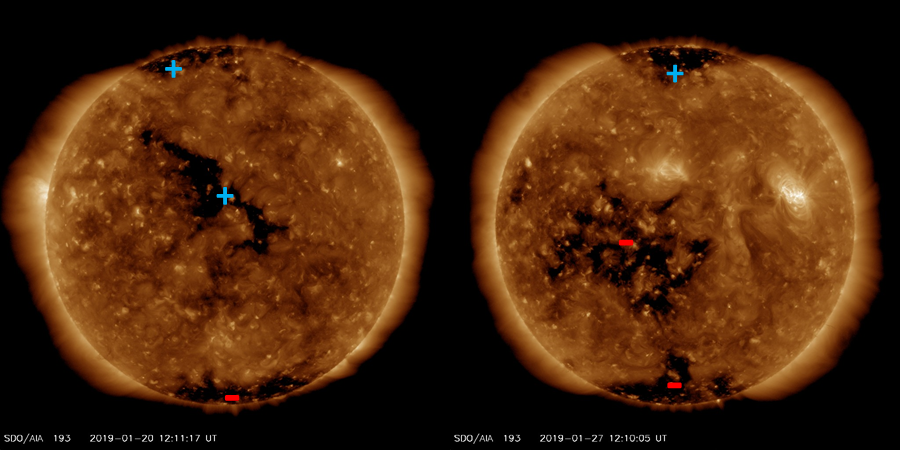
Two coronal holes were observed on the visible side of the Sun this week, both of them equatorial. The first one had a large extent on the northern solar hemisphere and was of a positive polarity. It had reached the central meridian already on 19 January (previous week). The second coronal hole observed this week was a very patchy, negative polarity coronal hole that reached the central meridian in the morning of 27 January. This quite large coronal hole might be connected with the southern polar coronal hole.
Underneath the aforementioned coronal holes as observed with the SDO/AIA instrument in extreme ultraviolet (AIA 193). The "+" and "-" reflect the polarity of the coronal holes, i.e. "positive" (outgoing) and negative (returning to the solar surface).
PROBA2 Observations (21 Jan 2019 - 27 Jan 2019)
Solar Activity
Solar flare activity fluctuated between very low and low during the week.
In order to view the activity of this week in more detail, we suggest to go to the following website from which all the daily (normal and difference) movies can be accessed: http://proba2.oma.be/ssa
This page also lists the recorded flaring events.
A weekly overview movie can be found here (SWAP week 461): http://proba2.oma.be/swap/data/mpg/movies/weekly_movies/weekly_movie_2019_01_21.mp4
Details about some of this week's events can be found further below.
If any of the linked movies are unavailable they can be found in the P2SC movie repository here: http://proba2.oma.be/swap/data/mpg/movies/
Friday Jan 25
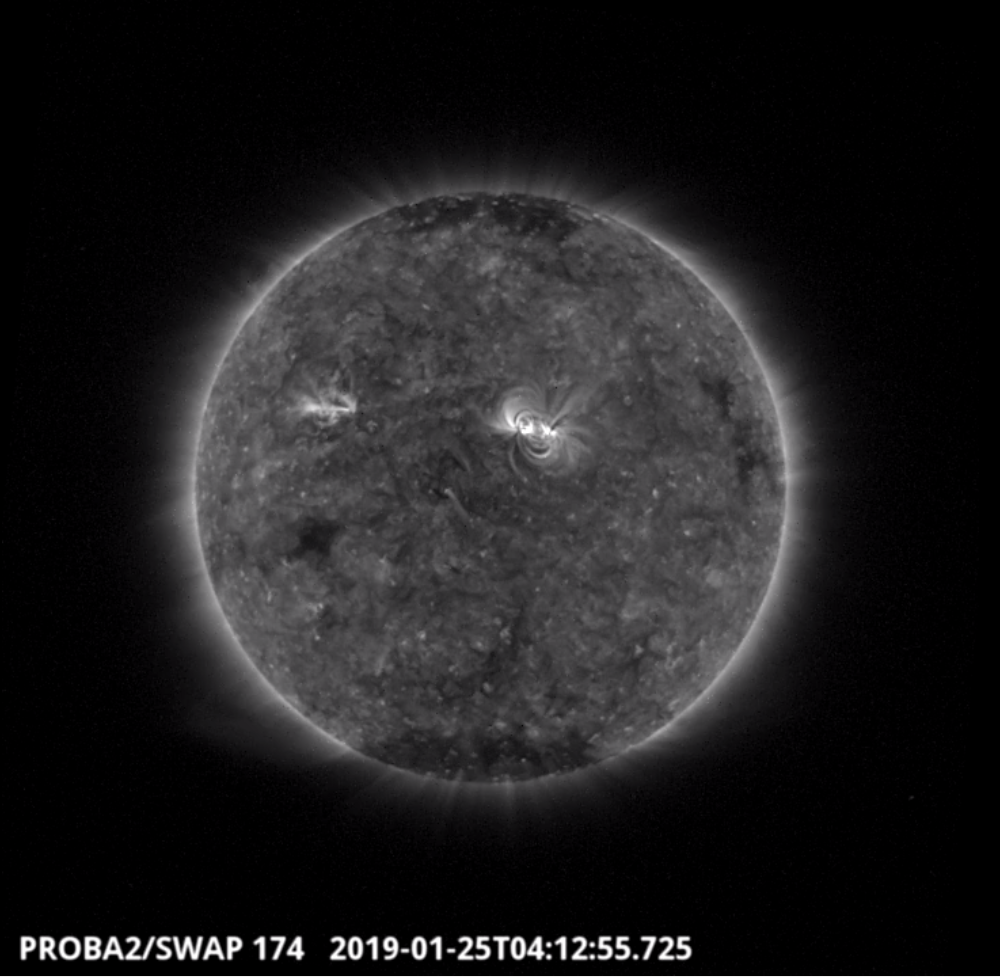
The second largest flare of the week (B6.9), which was associated with NOAA AR 2733, was observed by SWAP on 2019-Jan-25 and is visible near the centre of the disk in the SWAP image above, taken at 04:12 UT.
Find a movie of the event here (SWAP movie): http://proba2.oma.be/swap/data/mpg/movies/20190125_swap_movie.mp4
Saturday Jan 26
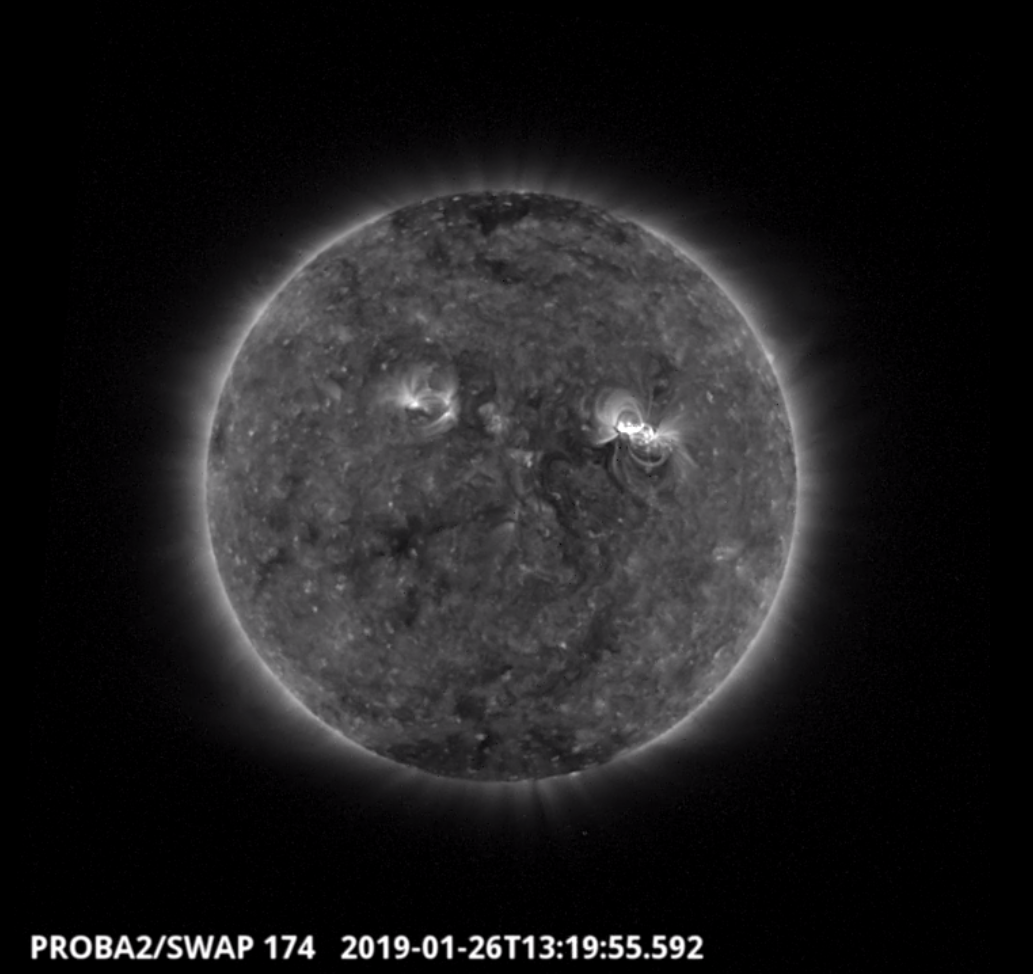
The largest flare of the week (C5.0), which was also associated with NOAA AR 2733, was observed by SWAP on 2019-Jan-26 and is visible in the north west quadrant of the solar disk in the SWAP image above taken at 13:19 UT.
Find a movie of the event here (SWAP movie): http://proba2.oma.be/swap/data/mpg/movies/20190126_swap_movie.mp4
The International Sunspot Number
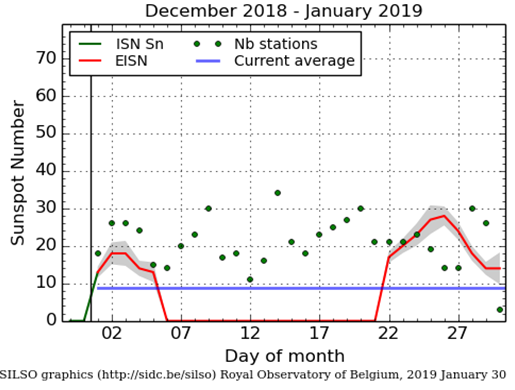
The daily Estimated International Sunspot Number (EISN, red curve with shaded error) derived by a simplified method from real-time data from the worldwide SILSO network. It extends the official Sunspot Number from the full processing of the preceding month (green line). The plot shows the last 30 days (about one solar rotation). The horizontal blue line shows the current monthly average, while the green dots give the number of stations included in the calculation of the EISN for each day.
Review of geomagnetic activity
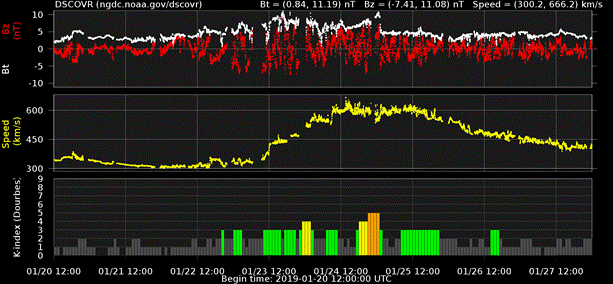
The week started with the low solar wind speed and interplanetary magnetic field (IMF) magnitude of 320 km/s and 3 nT, respectively. The intensity of the interplanetary magnetic field and its Bz component increased and started to oscillate at about 23:30 UT on 22 January, indicating the arrival of the compression region between the slow and fast solar wind associated with the fast flow from the equatorial coronal hole which reached central meridian in the morning of 19 January. The solar wind speed started to increase rather rapidly in the mid-day of 23 January, and it reached a maximum value (during this fast flow) of about 650 km/s, approximately at 14:30 UT on 24 January.
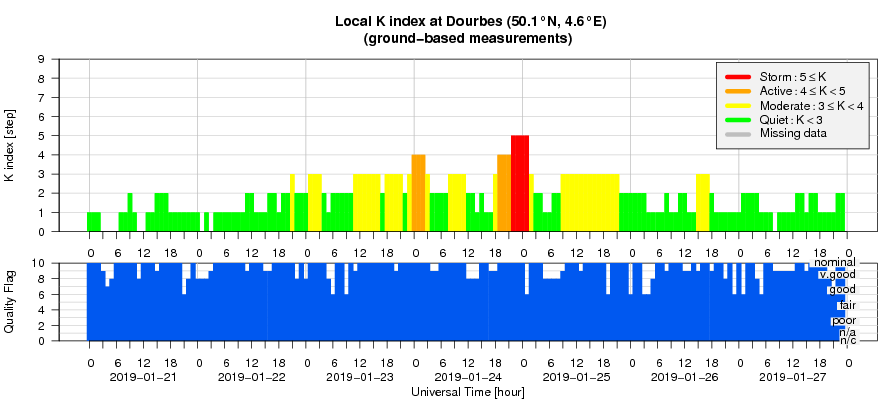
The arrival of the fast solar wind associated with the positive polarity coronal hole induced disturbed geomagnetic conditions. Except for 21 and 27 January, geomagnetic conditions were at unsettled to active levels, with one longer interval of minor storm conditions from late on 24 January until the early morning of 25 January, as reported by the local station at Dourbes (K=5) and by NOAA (Kp=5).
The chart underneath shows the solar wind observations by DSCOVR and the geomagnetic observations from Dourbes for the reporting period. The intensity of the IMF and the Bz component are respectively in white and red, and the solar wind speed is in yellow.
Geomagnetic Observations at Dourbes (21 Jan 2019 - 27 Jan 2019)
The SIDC Space Weather Briefing
The Space Weather Briefing presented by the forecaster on duty from 21 till 27 January 2019. It reflects in images and graphs what is written in the Solar and Geomagnetic Activity reports.
The pdf-version: http://www.stce.be/movies/20190128_SWbriefing.pdf
The automatically running presentation: http://www.stce.be/movies/20190128_SWbriefing.wmv
Review of ionospheric activity (21 Jan 2019 - 27 Jan 2019)
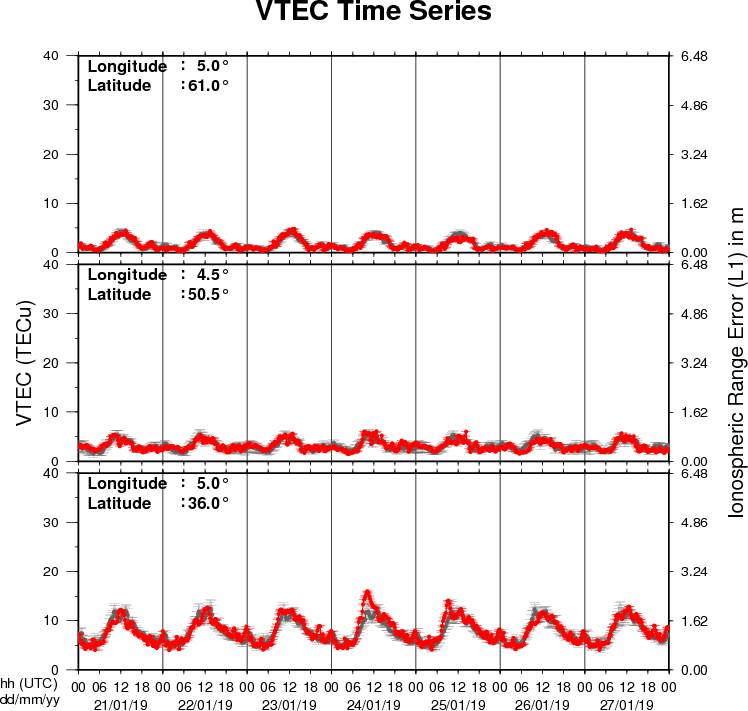
The figure shows the time evolution of the Vertical Total Electron Content (VTEC) (in red) during the last week at three locations:
a) in the northern part of Europe(N61°, 5°E)
b) above Brussels(N50.5°, 4.5°E)
c) in the southern part of Europe(N36°, 5°E)
This figure also shows (in grey) the normal ionospheric behaviour expected based on the median VTEC from the 15 previous days.
The VTEC is expressed in TECu (with TECu=10^16 electrons per square meter) and is directly related to the signal propagation delay due to the ionosphere (in figure: delay on GPS L1 frequency).
The Sun's radiation ionizes the Earth's upper atmosphere, the ionosphere, located from about 60km to 1000km above the Earth's surface.The ionization process in the ionosphere produces ions and free electrons. These electrons perturb the propagation of the GNSS (Global Navigation Satellite System) signals by inducing a so-called ionospheric delay.
See http://stce.be/newsletter/GNSS_final.pdf for some more explanations ; for detailed information, see http://gnss.be/ionosphere_tutorial.php