- Table of Content
- 1.Feeling the he...
- 2.Review of sola...
- 3.PROBA2 Observa...
- 4.The Internatio...
- 5.Geomagnetic Ob...
- 6.The SIDC Space...
- 7.Review of iono...
2. Review of solar and geomagnetic activity
3. PROBA2 Observations
4. The International Sunspot Number
5. Geomagnetic Observations at Dourbes
6. The SIDC Space Weather Briefing
7. Review of ionospheric activity (28 Jan 2019 - 3 Feb 2019)
Feeling the heat!...
Solar Orbiter is an ESA mission to perform close-up, high-resolution studies of our Sun and inner heliosphere. The project is managed and financed mainly by ESA, but with strong international collaboration. Also Belgium is involved with the Extreme Ultraviolet Imager (EUI ; see this STCE press release at - http://www.stce.be/press/EUIreadyForLaunch ) which was developed by the Centre Spatial de Liège (CSL) and the Royal Observatory of Belgium (ROB), in collaboration with the Belgian industry and foreign partners. NASA is involved as well, providing the launcher and contributing instruments to the scientific payload in the context of the International Living With a Star initiative. "SolO" 's launch is currently scheduled for 2020.
Solar Orbiter will address some central questions of heliophysics: How does the Sun create and control the heliosphere? What drives the solar wind and where does the coronal magnetic field originate from? How do solar eruptions produce energetic particle radiation that fills the heliosphere?... The spacecraft will also be the first to provide close-up views of the Sun's polar regions, which are very difficult to see from Earth, providing images from latitudes higher than 25 degrees. Solar Orbiter will also be able to nearly match the Sun's rotation around its axis for several days, allowing it to almost "hover" above active regions for an extended period of time and making it possible to see solar storms building up. As such, it will also deliver data of the side of the Sun not visible from Earth. Solar Orbiter will also coordinate its scientific mission with NASA's Parker Solar Probe to maximise their combined science return (see STCE at http://www.stce.be/news/442/welcome.html and NASA at https://www.nasa.gov/content/goddard/parker-solar-probe ).
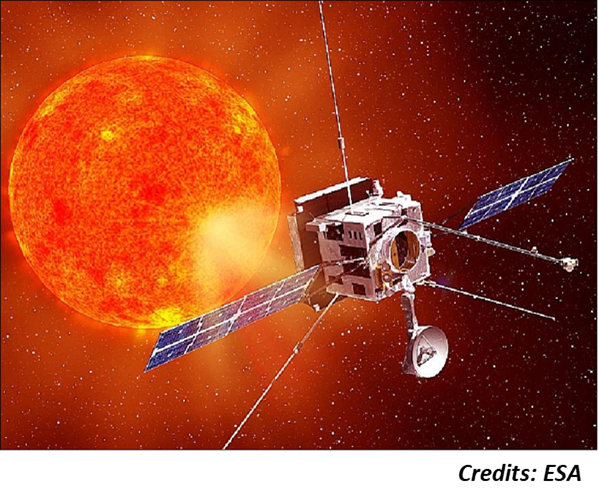
In order to answer these fundamental questions and achieve these challenging objectives, Solar Orbiter is intended to carry its telescopes and instruments to a distance of only 42 million km from our nearest star. That's less than one third the distance from the Earth to the Sun, and also well within Mercury's orbit. As a result, the spacecraft will be subjected to around 13 times the amount of solar heating that Earth-orbiting satellites experience, and to temperatures in excess of 500°C. To brave the fierce heat of the Sun, Solar Orbiter is equipped with a heat shield to protect the instruments from direct sunlight, as well as insulation blankets, radiators and other clever techniques to keep the instruments and other hardware at an operational temperature.

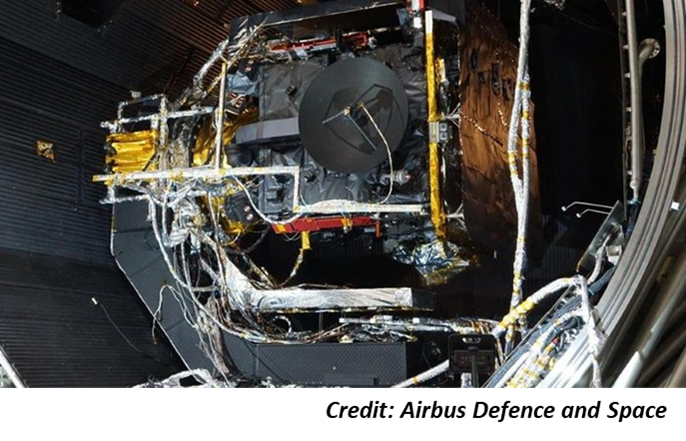
Of course, this essential piece of technology needs to be tested and so Solar Orbiter was sent to the thermal-vacuum chamber at the IABG test facility in Ottobrunn (Germany) in December last year. The test campaign – using powerful lamps to simulate the Sun's radiation – began by simulating the conditions the spacecraft will undergo as it manoeuvres to its operational orbit through flybys of Earth and Venus. Indeed, though during 99% of the mission operations time, the heat shield will protect Solar Orbiter, there will be more than a dozen manoeuvres when one of the side panels will be exposed to sunlight. Therefore, it is important to know how the spacecraft responds when the exterior of the insulation on these panels reaches a temperature of about 120–150 degrees Celsius. At a later stage in the testing, the spacecraft was rotated so that its heat shield was facing the lamps, and then hot and cold thermal balance phase tests were conducted to see if the spacecraft responds as expected. For practical reasons, some elements, such as the solar arrays and the instrument boom, were not integrated with the spacecraft during the test. They were integrated in January on the spacecraft, which will next undergo a series of mechanical and electromagnetic compatibility tests.
***References and additional reading***
This text was loosely based on a number of ESA articles.
- Thermal-vacuum testing: http://www.esa.int/spaceinimages/Images/2019/01/Thermal_testing_of_Solar_Orbiter
- Heat-protective measures: http://sci.esa.int/solar-orbiter/60988-solar-orbiter-receives-its-sunblock/
- Solar Orbiter overview: https://www.esa.int/Our_Activities/Space_Science/Solar_Orbiter
- SolO instruments: http://sci.esa.int/solar-orbiter/51217-instruments/
Review of solar and geomagnetic activity
SOLAR ACTIVITY
Only one active region (NOAA AR 2733) was visible, until it rotated behind the west limb on 30 January. It produced 25 B-class flares and four C-class flares, the strongest one was a C5.2 flare peaking at 06:11 UT on 30 January.
An equatorial coronal hole (with negative polarity) traversed central meridian on 26 January.
There were no Earth directed CMEs, and the proton flux stayed below background levels.
GEOMAGNETIC ACTIVITY
The high speed stream (HSS) associated with the negative polarity equatorial coronal hole that traversed the central meridian on January 26, affected the Earth starting from 30 January. Compressed solar wind plasma passed the L1 point, followed by a less dense, but high speed solar wind. The magnetic field reached 20nT and the solar wind speed peaked at 620 km/s.
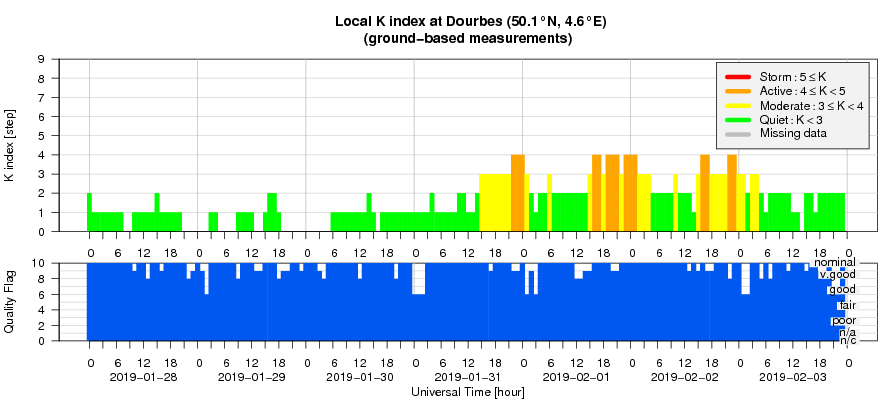
The geomagnetic field reached active conditions from 31 January to 2 February, both locally (K=4 at Dourbes) and at planetary levels (Kp=4). In addition, the Kp reached 5 during one 3-hour period, at 21:00 UT on 31 January. The effect of the HSS started to fade late on 2 January.
PROBA2 Observations
Solar Activity
Solar flare activity fluctuated between very low and low during the week.
In order to view the activity of this week in more detail, we suggest to go to the following website from which all the daily (normal and difference) movies can be accessed: http://proba2.oma.be/ssa
This page also lists the recorded flaring events.
A weekly overview movie can be found here (SWAP week 462): http://proba2.oma.be/swap/data/mpg/movies/weekly_movies/weekly_movie_2019_01_28.mp4
Details about some of this week’s events, can be found further below.
If any of the linked movies are unavailable they can be found in the P2SC movie repository here http://proba2.oma.be/swap/data/mpg/movies/
Wednesday Jan 30

The strongest flare of the week was a C5.2 flare peaking around 06:10 UT (see SWAP image above). It was produced by the NOAA active region 2733 which rotated over the west limb. Find a movie of the events here (SWAP movie) http://proba2.oma.be/swap/data/mpg/movies/20190130_swap_movie.mp4
The International Sunspot Number
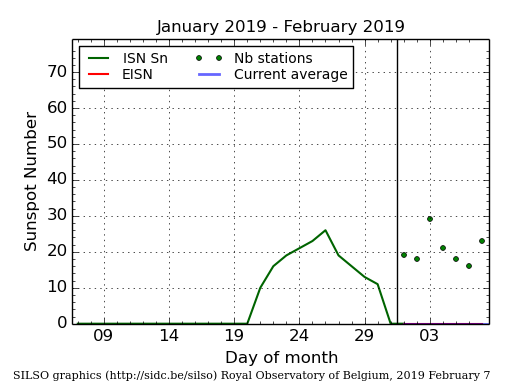
The daily Estimated International Sunspot Number (EISN, red curve with shaded error) derived by a simplified method from real-time data from the worldwide SILSO network. It extends the official Sunspot Number from the full processing of the preceding month (green line). The plot shows the last 30 days (about one solar rotation). The horizontal blue line shows the current monthly average, while the green dots give the number of stations included in the calculation of the EISN for each day.
Geomagnetic Observations at Dourbes
The SIDC Space Weather Briefing
The Space Weather Briefing presented by the forecaster on duty from January 28 to February 3. It reflects in images and graphs what is written in the Solar and Geomagnetic Activity report.
The pdf-version: http://www.stce.be/briefings/20190204_SWbriefing.pdf
The automatically running presentation: http://www.stce.be/briefings/20190204_SWbriefing.ppsm
Review of ionospheric activity (28 Jan 2019 - 3 Feb 2019)
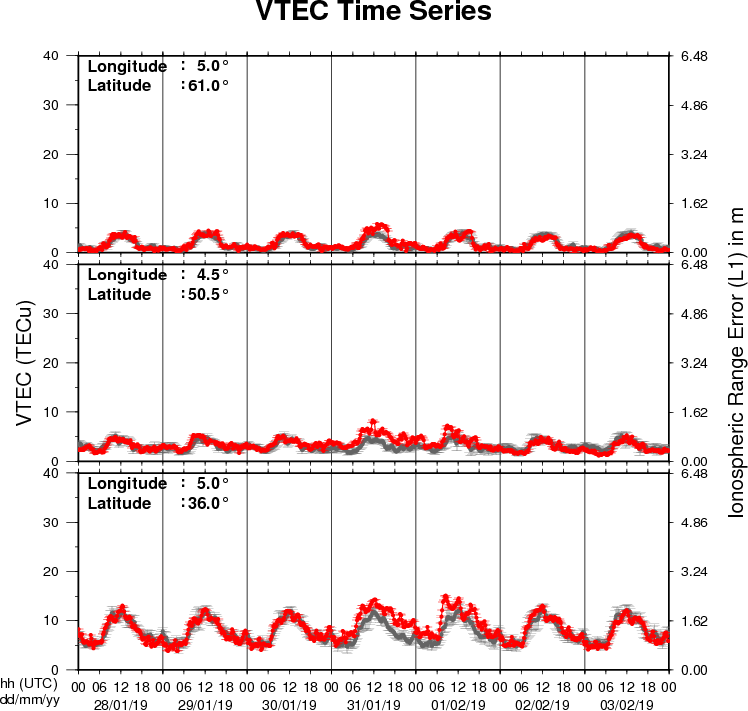
The figure shows the time evolution of the Vertical Total Electron Content (VTEC) (in red) during the last week at three locations:
a) in the northern part of Europe(N61°, 5°E)
b) above Brussels(N50.5°, 4.5°E)
c) in the southern part of Europe(N36°, 5°E)
This figure also shows (in grey) the normal ionospheric behaviour expected based on the median VTEC from the 15 previous days.
The VTEC is expressed in TECu (with TECu=10^16 electrons per square meter) and is directly related to the signal propagation delay due to the ionosphere (in figure: delay on GPS L1 frequency).
The Sun's radiation ionizes the Earth's upper atmosphere, the ionosphere, located from about 60km to 1000km above the Earth's surface.The ionization process in the ionosphere produces ions and free electrons. These electrons perturb the propagation of the GNSS (Global Navigation Satellite System) signals by inducing a so-called ionospheric delay.
See http://stce.be/newsletter/GNSS_final.pdf for some more explanations ; for detailed information, see http://gnss.be/ionosphere_tutorial.php