- Table of Content
- 1.The best of......
- 2.ESWW2019 - Cal...
- 3.Review of sola...
- 4.The Internatio...
- 5.Geomagnetic Ob...
- 6.The SIDC space...
- 7.Review of iono...
2. ESWW2019 - Call for sessions
3. Review of solar and geomagnetic activity
4. The International Sunspot Number
5. Geomagnetic Observations at Dourbes (4 Feb 2019 - 10 Feb 2019)
6. The SIDC space weather Briefing
7. Review of ionospheric activity (4 Feb 2019 - 10 Feb 2019)
The best of... 2018!
A compilation of the most memorable space weather moments of 2018 can be found at the STCE's dedicated Solar Cycle 24 page: http://www.stce.be/highlights
Using the versatile (J)Helioviewer software (http://www.jhelioviewer.org/ ), a ***MOVIE*** was created containing one or more clips of each event. Mostly SDO-images were used, occasionally supplemented with imagery from PROBA2, SOHO, GONG and STEREO.
The movie can be found at https://youtu.be/wEibWLgPcPA , whereas the page with the accompanying information is at http://www.stce.be/news/449/welcome.html
We wish you a happy viewing!
ESWW2019 - Call for sessions
The deadline is approaching and almost visible behind the corner of next week: February 20. Don't hesitate to submit a session. You can choose between 3 flavours: service domain plenary, parallel science and research session and parallel open session. When you go to the submission page, you see what is already submitted - please avoid duplication.
More on http://www.stce.be/esww2019/call4sessions.php

Review of solar and geomagnetic activity
SOLAR ACTIVITY
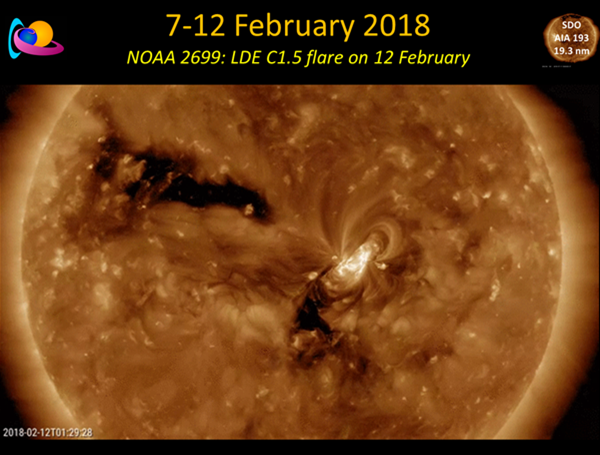
The solar activity has been very low: the visible solar disc was spotless, and the X-ray flux remained below B-level.
No Earth directed coronal mass ejection has been observed.
The greater than 10 MeV solar protons flux remained at nominal levels.
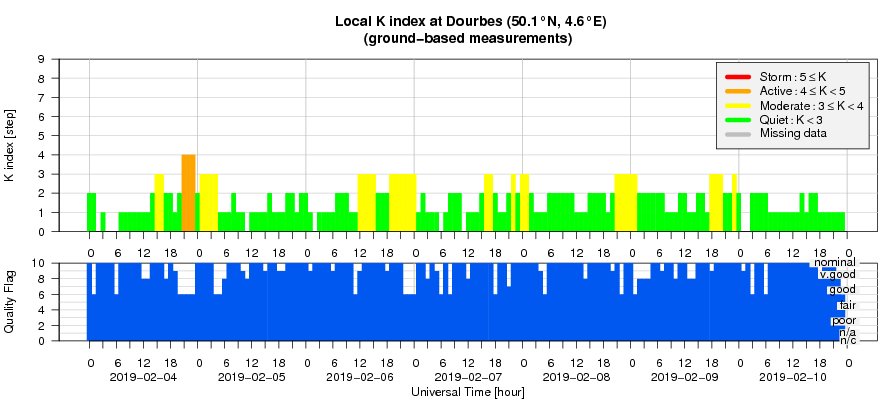
GEOMAGNETIC ACTIVITY
Due to several large and patchy negative polarity coronal holes, the solar wind parameters were slightly enhanced. The solar wind speed ranged between 320 and 560 km/s being most of the period close to 450 km/s. The total interplanetary magnetic field strength was higher than the usual background values but remained, however, below 8.5 nT. The southward magnetic component fluctuated between -7.5 and 6.5 nT.
The geomagnetic conditions were quiet to unsettled with isolated active periods due to the enhanced solar wind conditions.
The International Sunspot Number
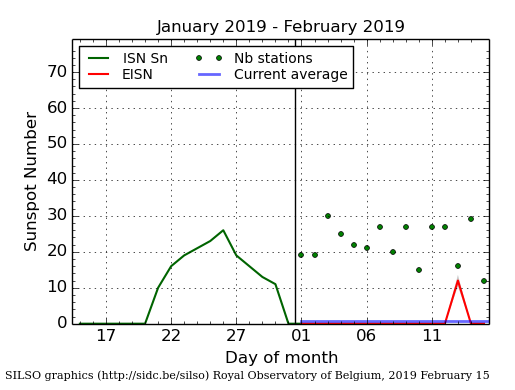
The daily Estimated International Sunspot Number (EISN, red curve with shaded error) derived by a simplified method from real-time data from the worldwide SILSO network. It extends the official Sunspot Number from the full processing of the preceding month (green line). The plot shows the last 30 days (about one solar rotation). The horizontal blue line shows the current monthly average, while the green dots give the number of stations included in the calculation of the EISN for each day.
Geomagnetic Observations at Dourbes (4 Feb 2019 - 10 Feb 2019)
The SIDC space weather Briefing
The Space Weather Briefing presented by the forecaster on duty from Feb 4 to 10. It reflects in images and graphs what is written in the Solar and Geomagnetic Activity report.
The pdf-version: http://www.stce.be/briefings/20190211_SWbriefing.pdf
The automatically running presentation: http://www.stce.be/briefings/20190211_SWbriefing.ppsm
Review of ionospheric activity (4 Feb 2019 - 10 Feb 2019)
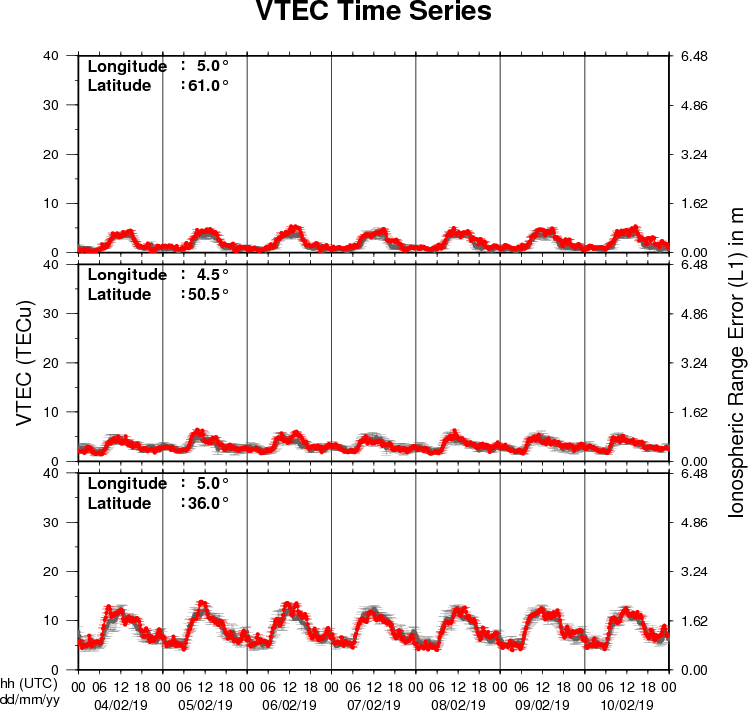
The figure shows the time evolution of the Vertical Total Electron Content (VTEC) (in red) during the last week at three locations:
a) in the northern part of Europe(N61°, 5°E)
b) above Brussels(N50.5°, 4.5°E)
c) in the southern part of Europe(N36°, 5°E)
This figure also shows (in grey) the normal ionospheric behaviour expected based on the median VTEC from the 15 previous days.
The VTEC is expressed in TECu (with TECu=10^16 electrons per square meter) and is directly related to the signal propagation delay due to the ionosphere (in figure: delay on GPS L1 frequency).
The Sun's radiation ionizes the Earth's upper atmosphere, the ionosphere, located from about 60km to 1000km above the Earth's surface.The ionization process in the ionosphere produces ions and free electrons. These electrons perturb the propagation of the GNSS (Global Navigation Satellite System) signals by inducing a so-called ionospheric delay.
See http://stce.be/newsletter/GNSS_final.pdf for some more explanations ; for detailed information, see http://gnss.be/ionosphere_tutorial.php