- Table of Content
- 1.Spotless for 1...
- 2.PROBA2 Observa...
- 3.Review of sola...
- 4.The Internatio...
- 5.Review of geom...
- 6.Geomagnetic Ob...
- 7.The SIDC space...
- 8.Review of iono...
2. PROBA2 Observations (18 Feb 2019 - 24 Feb 2019)
3. Review of solar activity
4. The International Sunspot Number
5. Review of geomagnetic activity
6. Geomagnetic Observations at Dourbes (18 Feb 2019 - 24 Feb 2019)
7. The SIDC space weather Briefing
8. Review of ionospheric activity (18 Feb 2019 - 24 Feb 2019)
Spotless for 1 month
This is actually a movie made of SDO/HMI images from Feb 1 to 28. You hardly see anything moving, no spots sliding from left to right, no spots popping up, it looks like a still image. This is because the sun seems to be spotless for the whole month.
Indeed, the green curve in the graph below is a horizontal line at zero from January 31 to February 28.
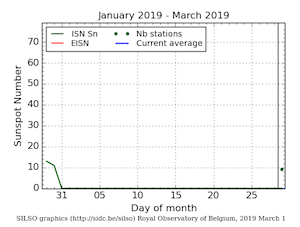
You don't need to be scientist to guess that the 'Monthly Mean Total Sunspot Number' is zero for February 2019. It takes longer to type the name of the number then to calculate it by heart. It is still a provisional number however, but it will probably stay zero.
The last time that the Monthly Mean Total Sunspot Number was zero was August 2009. This was at the very bottom of the last solar minimum. Another zero was reached in 1913. You can check the numbers at http://www.sidc.be/silso/datafiles
PROBA2 Observations (18 Feb 2019 - 24 Feb 2019)
Solar Activity
Solar flare activity remained very low during the week.
In order to view the activity of this week in more detail, we suggest to go to the following website from which all the daily (normal and difference) movies can be accessed: http://proba2.oma.be/ssa
This page also lists the recorded flaring events.
A weekly overview movie can be found here (SWAP week 465): http://proba2.oma.be/swap/data/mpg/movies/weekly_movies/weekly_movie_2019_02_18.mp4
Details about some of this week's events, can be found further below.
If any of the linked movies are unavailable they can be found in the P2SC movie repository here: http://proba2.oma.be/swap/data/mpg/movies/
Wednesday Feb 20
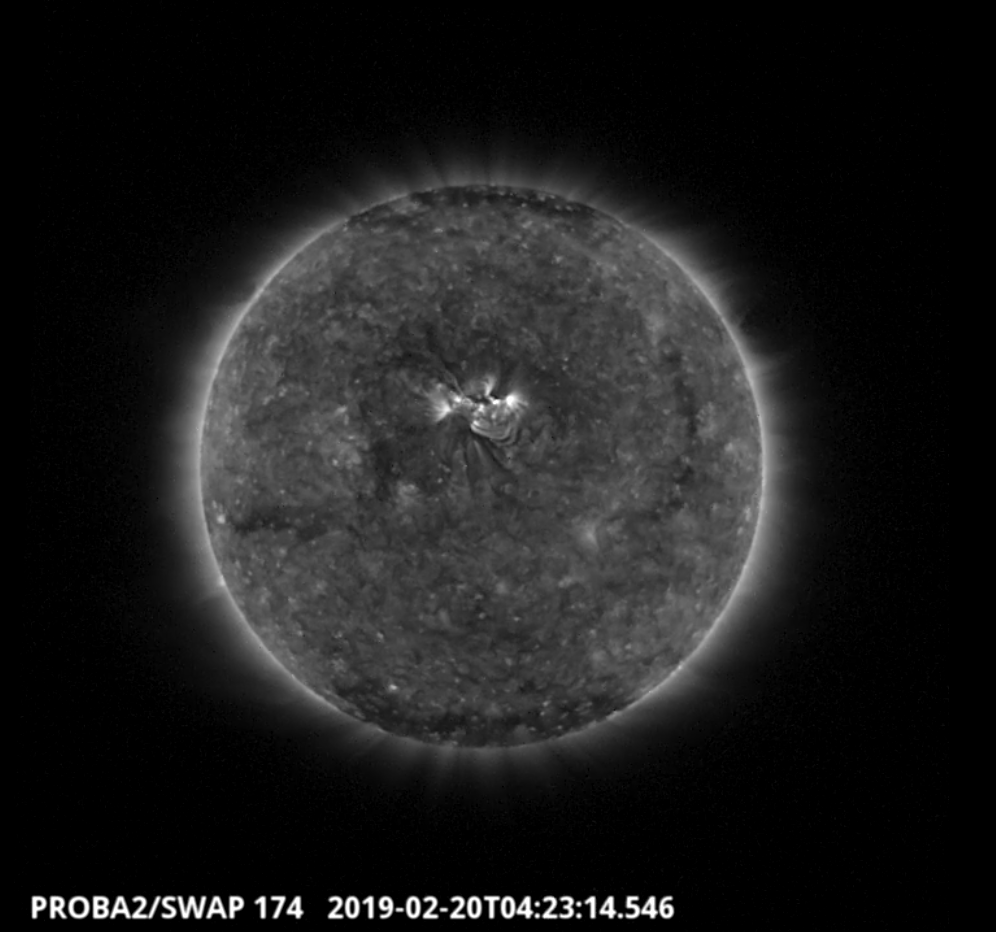
SWAP observed a prominence eruption and flare (A9.7) on 2019-Feb-20, visible in the image above near the centre of the solar disk at 4:23 UT.
Find a movie of the event here: http://proba2.oma.be/swap/data/mpg/movies/20190220_swap_movie.mp4 (SWAP movie) and here http://proba2.oma.be/swap/data/mpg/movies/20190220_swap_diff.mp4 (SWAP difference movie).
Review of solar activity
The solar disk was spotless for the entire week.
A 20-degrees long, dynamic filament (location N15) transited the solar disk, before finally erupting late on 23 February. Two coronal mass ejections (CMEs) were observed during the period, and were associated with eruptions in this filament (20 and on 24 February).
None of the observed CMEs had an earth-directed component.
The greater than 10 MeV proton flux was at nominal levels.
A patchy and narrow positive polarity polar coronal hole (CH) transited the central meridian (CM) on 15-17 February, and a negative polarity equatorial CH started its CM transit on 22 February.
The International Sunspot Number
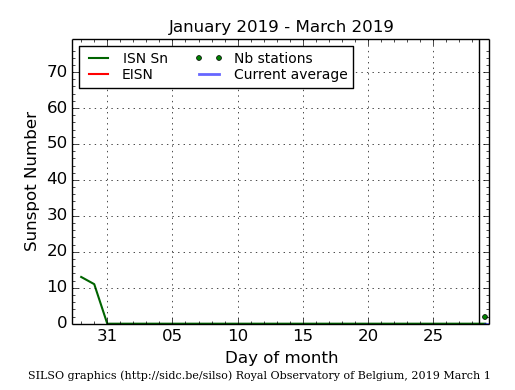
The daily Estimated International Sunspot Number (EISN, red curve with shaded error) derived by a simplified method from real-time data from the worldwide SILSO network. It extends the official Sunspot Number from the full processing of the preceding month (green line). The plot shows the last 30 days (about one solar rotation). The horizontal blue line shows the current monthly average, while the green dots give the number of stations included in the calculation of the EISN for each day.
Review of geomagnetic activity
Solar wind at the earth environment was at nominal levels until the arrival of the Co-rotating Interaction Region (CIR) and wind stream associated with the positive polarity coronal hole (CH) on 20 February. Bz varied between -8 and +10 nT, while the wind speed gradually increased reaching a maximum near 500 km/s early on 22 February (DSCOVR). The direction of the IMF switched from towards (negative sector) to mostly away from the Sun (positive sector) late on 20 February. The week ended with solar wind values at nominal levels, i.e. wind speed near 310 km/s and Bz varying between -3 and +3 nT.
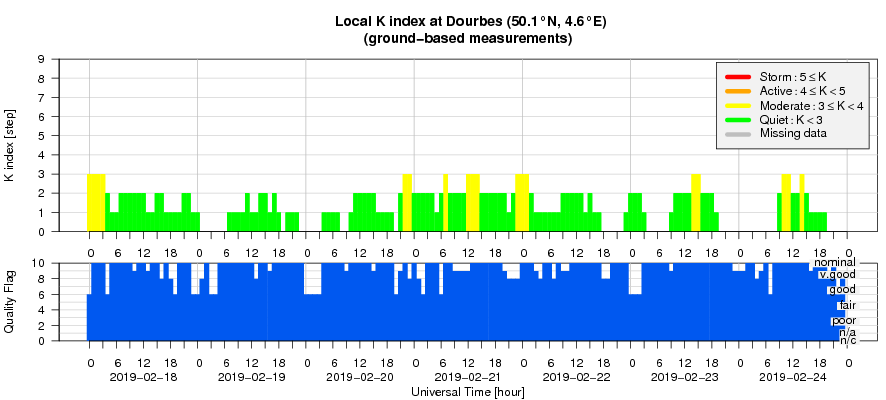
Quiet to unsettled geomagnetic conditions were observed throughout the week (Kp and K Dourbes). The arrival of the CIR and wind stream from the patchy positive polarity CH increased the number of unsettled episodes from late on 20 to early 22 February, and an active period was recorded by Kp during the 06-09UT interval on 21 February.
Geomagnetic Observations at Dourbes (18 Feb 2019 - 24 Feb 2019)
The SIDC space weather Briefing
The Space Weather Briefing presented by the forecaster on duty from February 18 to 24. It reflects in images and graphs what is written in the Solar and Geomagnetic Activity report.
The pdf-version: http://www.stce.be/briefings/20190225_SWbriefing.pdf
The automatically running presentation: http://www.stce.be/briefings/20190225_SWbriefing.ppsm
Review of ionospheric activity (18 Feb 2019 - 24 Feb 2019)
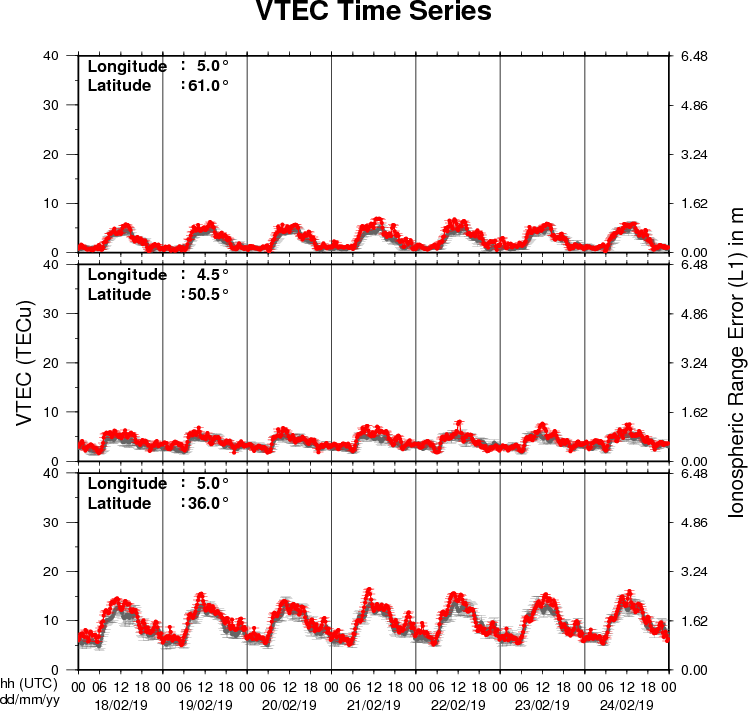
The figure shows the time evolution of the Vertical Total Electron Content (VTEC) (in red) during the last week at three locations:
a) in the northern part of Europe(N61°, 5°E)
b) above Brussels(N50.5°, 4.5°E)
c) in the southern part of Europe(N36°, 5°E)
This figure also shows (in grey) the normal ionospheric behaviour expected based on the median VTEC from the 15 previous days.
The VTEC is expressed in TECu (with TECu=10^16 electrons per square meter) and is directly related to the signal propagation delay due to the ionosphere (in figure: delay on GPS L1 frequency).
The Sun's radiation ionizes the Earth's upper atmosphere, the ionosphere, located from about 60km to 1000km above the Earth's surface.The ionization process in the ionosphere produces ions and free electrons. These electrons perturb the propagation of the GNSS (Global Navigation Satellite System) signals by inducing a so-called ionospheric delay.
See http://stce.be/newsletter/GNSS_final.pdf for some more explanations ; for detailed information, see http://gnss.be/ionosphere_tutorial.php