- Table of Content
- 1.GLEs and the s...
- 2.Almost zero su...
- 3.Review of sola...
- 4.The Internatio...
- 5.Review of geom...
- 6.Geomagnetic Ob...
- 7.The SIDC space...
- 8.PROBA2 Observa...
- 9.Review of iono...
2. Almost zero sunspot number in February
3. Review of solar activity
4. The International Sunspot Number by SILSO
5. Review of geomagnetic activity
6. Geomagnetic Observations at Dourbes (25 Feb 2019 - 3 Mar 2019)
7. The SIDC space weather Briefing
8. PROBA2 Observations (25 Feb 2019 - 3 Mar 2019)
9. Review of ionospheric activity (25 Feb 2019 - 3 Mar 2019)
GLEs and the solar cycle
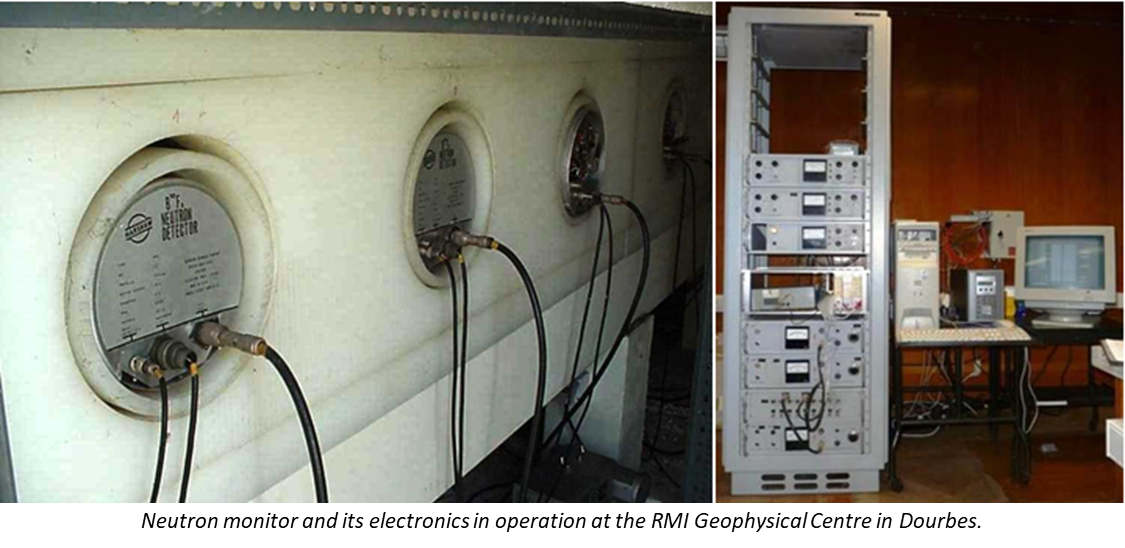
A Ground Level Enhancement (GLE) takes place when a proton event is associated with particles having energies well above the "regular" 10 MeV (Note 1), rather in the neighbourhood of around 1 GeV, i.e. about 50 to 100 times more energetic. When these particles collide with particles in the Earth's upper atmosphere, they can create a shower of secondary particles which can be detected by neutron monitors on the ground such as in Dourbes (http://ionosphere.meteo.be/instruments/neutron.php ). GLEs temporarily increase the natural background radiation, and can be the source of glitches in electronic equipment (computers,...) on the earth's surface.
Several conditions (number of stations, percentage increase above background) need to fulfilled before an increase in the observed neutron counts is validated as a genuine GLE. Since the start of the measurements in the 1940s, only 72 such events have been recorded. For solar cycles (SC) 21 to 23, about 13-16 events per solar cycle have been recorded. For SC24, the count stops at 2: one on 17 May 2012, and the other on 10 September 2017 which was associated with the 2nd strongest flare of SC24 (X8). See this STCE news item at http://www.stce.be/news/419/welcome.html for more info on the strength of SC24. One of the strongest GLEs ever registered took place on 23 February 1956, increasing the neutron counts at some locations by several 1000% compared to pre-event levels.
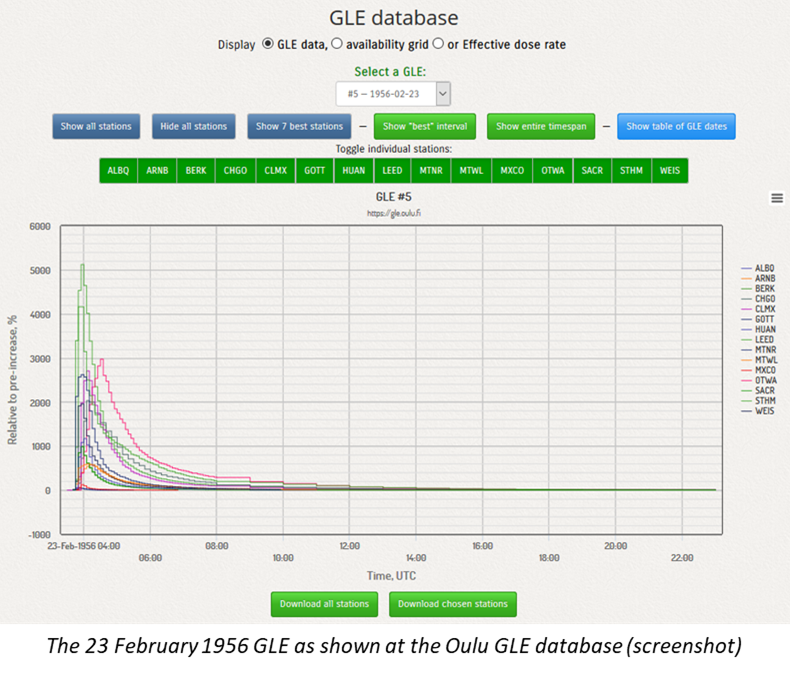
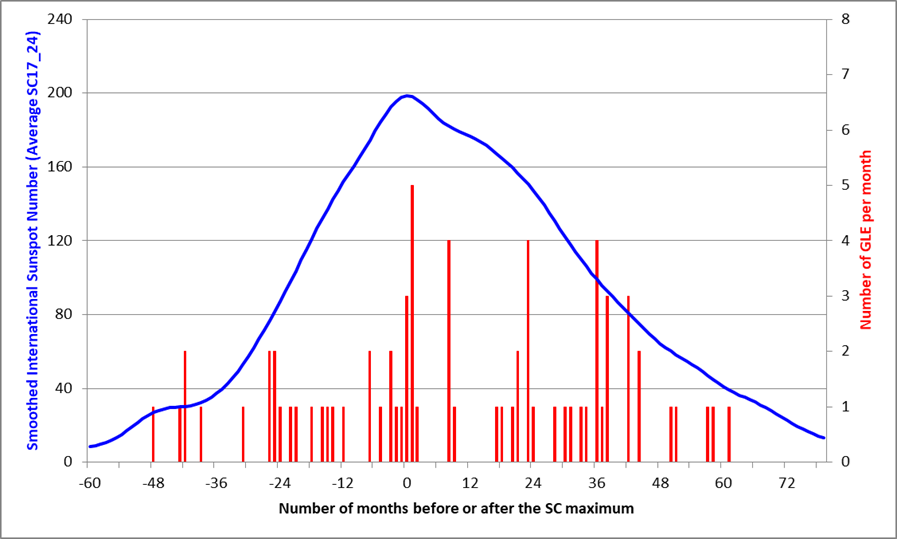
One can wonder if and how these rare events are spread over a solar cycle. As the first detected GLE occurred during SC17, an average solar cycle was created by centering the smoothed sunspot maximum of each solar cycle (SC17 to SC24), then averaging and smoothing the monthly sunspot numbers (SILSO: http://sidc.oma.be/silso/datafiles ). The thus created average solar cycle serves as a backdrop for the timings of the GLEs which can happen before or after the solar cycle maximum (point "0" on the horizontal axis). A list of these GLEs can be found at e.g. Oulu (https://gle.oulu.fi/#/ ) or at the Bartol Research Institute (http://neutronm.bartol.udel.edu/~pyle/GLE_List.txt ). In the chart underneath, the average solar cycle is represented by the blue curve, and the red bars display the monthly number of GLEs before or after the month of solar cycle maximum. It is clear that GLEs can occur during pretty much the entire solar cycle, from 4 years (48 months) before SC maximum to about 5 years after it. Nonetheless, it is equally clear that GLEs have a preference to happen during the period of maximum and during the declining phase of the solar cycle. Note the conclusion is based on a relatively small number of GLEs, and that some sunspot groups produced multiple GLEs during their transit over the solar disk.
Note 1 - 10 MeV = 10 million eV. The eV (electron volt) is a very tiny amount of energy corresponding to about 0.16 billionth of a billionth of a Joule. For comparison, a flying mosquito has a kinetic energy of about a trillion eV (= 1000 billion eV).
Almost zero sunspot number in February
In the STCE Newsletter, we wrote 'Spotless for 1 month'. This news item was sent just before the monthly SILSO report was published. The provisional sunspot numbers of for February 13 and 21 were changed from zero to 12 and 11 respectively giving a Provisional International Monthly Mean Sunspot Number for February 2019 of 0.8 and not zero.
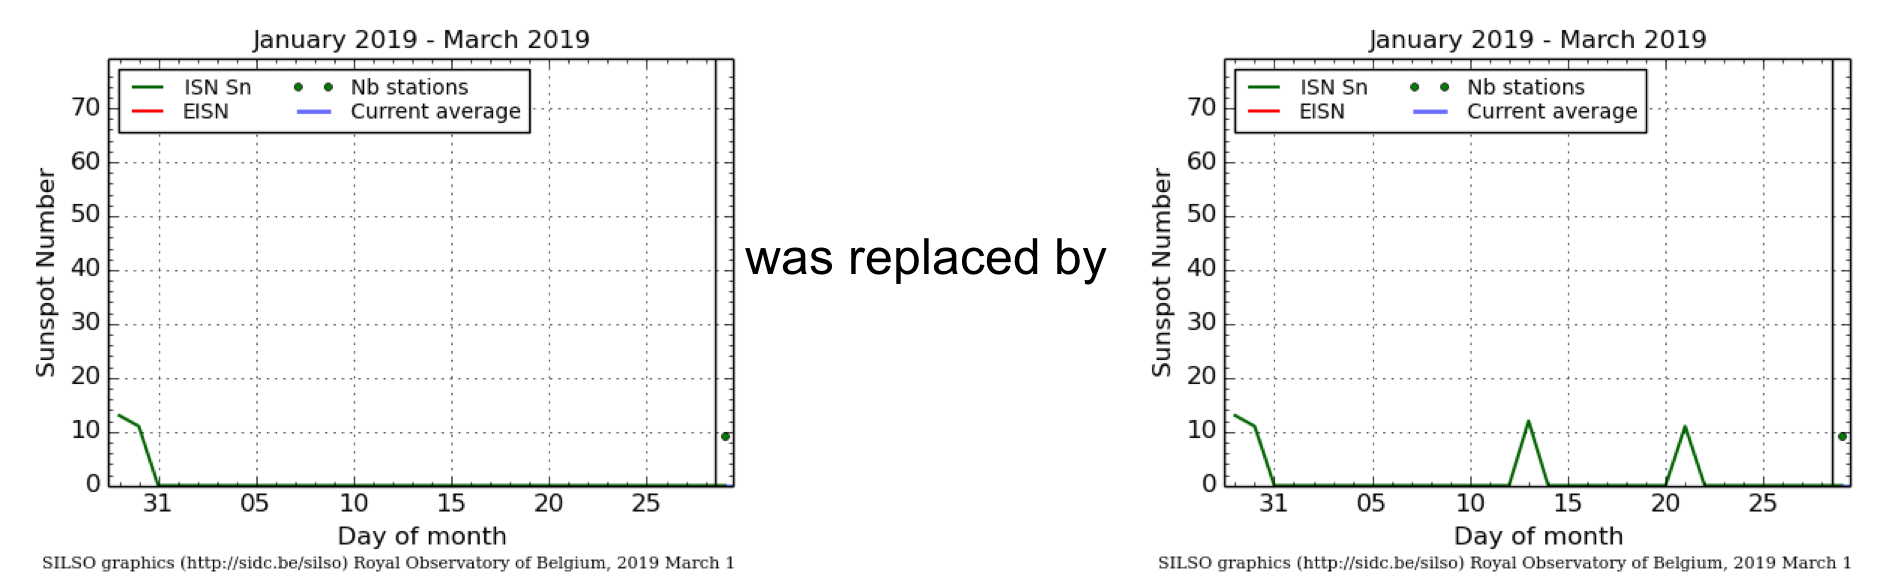
Conclusion: The monthly mean of February 2019 is not zero, but definitely very low.
Review of solar activity
Solar activity was very low.
No significant flares were recorded, and the solar disk was spotless for the majority of the week. A small Active Region (AR) rotated on to the East Solar limb on 02 Mar, but produced no flaring activity.
No filament channels that could possibly cause an eruption were observed on the disk. A filament channel is a narrow lane between extended areas of magnetic field of opposite polarity and denote the place where filament are formed. They are typically observed in the H-alpha line.
No Earth directed Coronal Mass Ejections (CMEs) were detected. However, a small CME was observed off of the West Solar limb on 27 Feb, and a second on 02 Mar. Neither of which has an Earth-directed component.
The greater than 10 MeV proton flux was nominal.
A small low latitude negative polarity coronal hole (CH) rotated from disk centre to the west solar limb. The CH was trailed by a region of low latitude patchy CH, which dominated the looks of the Sun at the end of the week.
The International Sunspot Number by SILSO
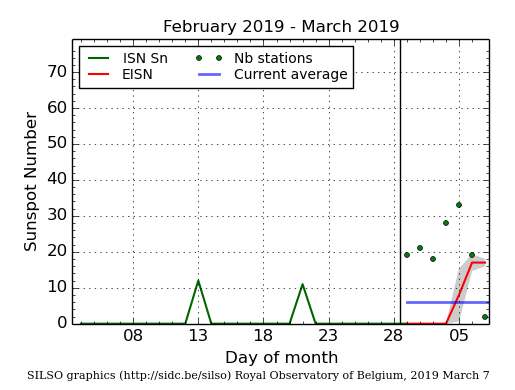
The daily Estimated International Sunspot Number (EISN, red curve with shaded error) derived by a simplified method from real-time data from the worldwide SILSO network. It extends the official Sunspot Number from the full processing of the preceding month (green line). The plot shows the last 30 days (about one solar rotation). The horizontal blue line shows the current monthly average, while the green dots give the number of stations included in the calculation of the EISN for each day.
Review of geomagnetic activity
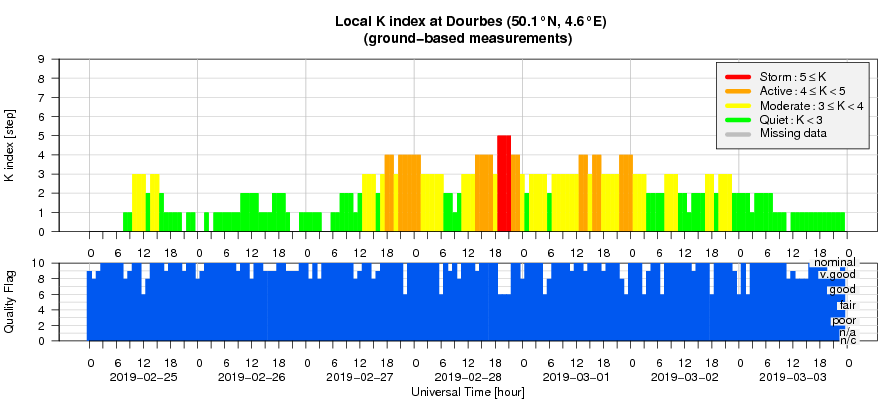
The solar wind at the Earth was at nominal levels at the beginning of the week but its speed increased following the arrival of the Co-rotating Interaction Region (CIR) and High Speed Stream (HSS), associated with the negative polarity coronal hole (CH), on Wednesday 27 Feb. The solar wind speed increased from 300 to approx 610 km/s (DSCOVR) before slowly decreasing. The total magnetic field B peaked around 12 nT, and Bz reached -12 nT, producing K_Dourbes/Kp_NOAA equal 5 for a couple of short intervals.
Geomagnetic Observations at Dourbes (25 Feb 2019 - 3 Mar 2019)
The SIDC space weather Briefing
The Space Weather Briefing presented by the forecaster on duty from Feb 25 to Mar 3. It reflects in images and graphs what is written in the Solar and Geomagnetic Activity report.

The pdf-version: http://www.stce.be/briefings/20190304_SWbriefing.pdf
The automatically running presentation: http://www.stce.be/briefings/20190304_SWbriefing.ppsm
PROBA2 Observations (25 Feb 2019 - 3 Mar 2019)
Solar Activity
Solar flare activity was very low during the week.
In order to view the activity of this week in more detail, we suggest to go to the following website from which all the daily (normal and difference) movies can be accessed: http://proba2.oma.be/ssa
This page also lists the recorded flaring events.
A weekly overview movie can be found here (SWAP week 466).
http://proba2.oma.be/swap/data/mpg/movies/weekly_movies/weekly_movie_2019_02_25.mp4
Details about some of this week’s events, can be found further below.
If any of the linked movies are unavailable they can be found in the P2SC movie repository here
http://proba2.oma.be/swap/data/mpg/movies/
Monday Mar 25
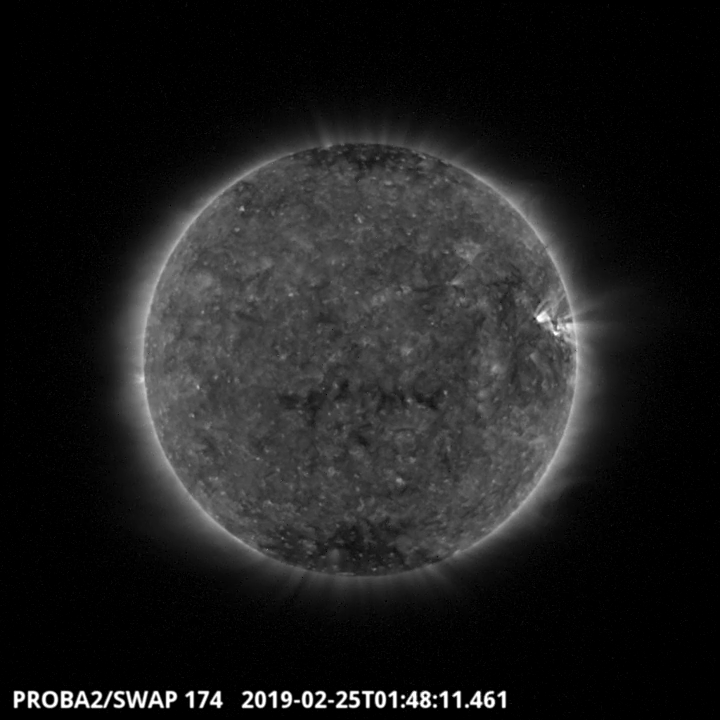
An equatorial coronal hole passed the central meridian on 2019-Feb-25, as can be seen in the SWAP image above
Find a movie of the events here (SWAP movie)
http://proba2.oma.be/swap/data/mpg/movies/20190225_swap_movie.mp4
Friday Mar 01
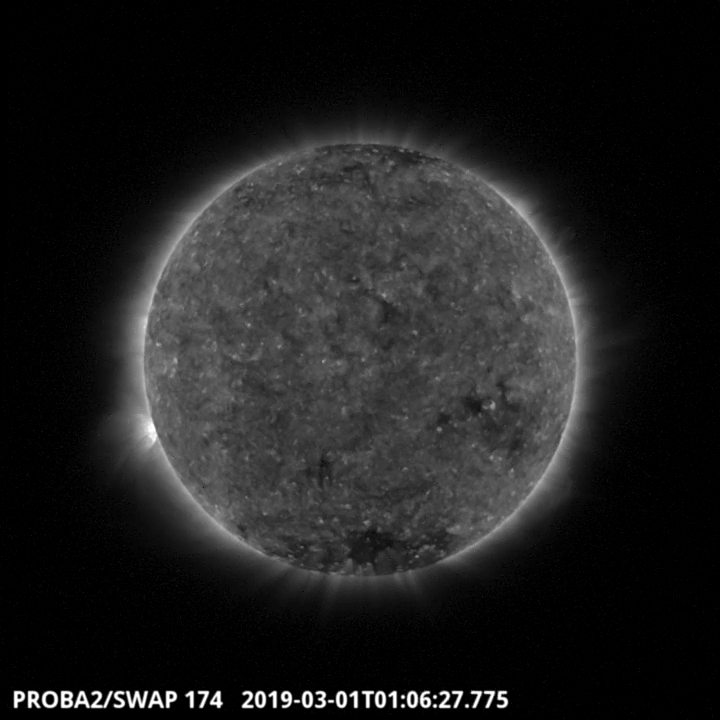
A patchy coronal hole is visible in the SWAP image above
Find a movie of the events here (SWAP movie)
http://proba2.oma.be/swap/data/mpg/movies/20190301_swap_movie.mp4
Review of ionospheric activity (25 Feb 2019 - 3 Mar 2019)
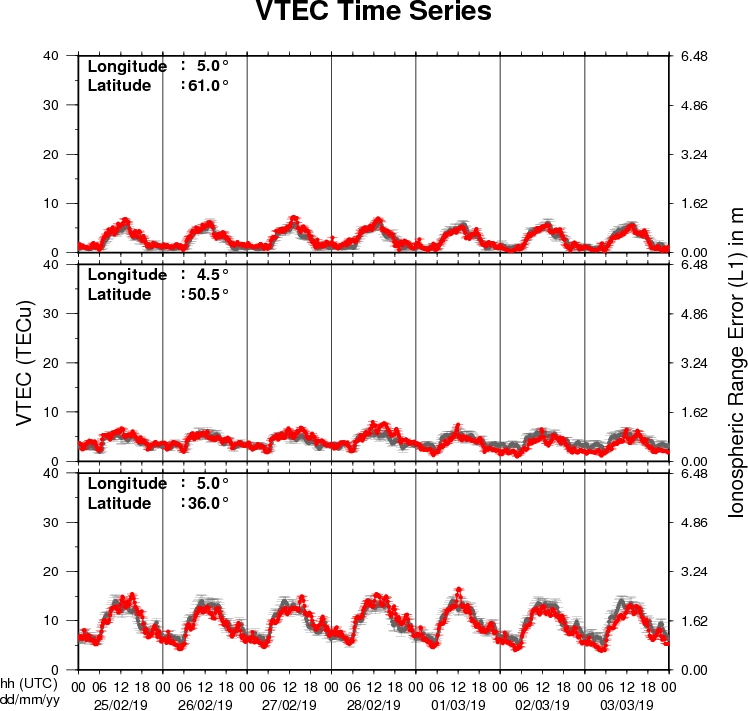
The figure shows the time evolution of the Vertical Total Electron Content (VTEC) (in red) during the last week at three locations:
a) in the northern part of Europe(N61°, 5°E)
b) above Brussels(N50.5°, 4.5°E)
c) in the southern part of Europe(N36°, 5°E)
This figure also shows (in grey) the normal ionospheric behaviour expected based on the median VTEC from the 15 previous days.
The VTEC is expressed in TECu (with TECu=10^16 electrons per square meter) and is directly related to the signal propagation delay due to the ionosphere (in figure: delay on GPS L1 frequency).
The Sun's radiation ionizes the Earth's upper atmosphere, the ionosphere, located from about 60km to 1000km above the Earth's surface.The ionization process in the ionosphere produces ions and free electrons. These electrons perturb the propagation of the GNSS (Global Navigation Satellite System) signals by inducing a so-called ionospheric delay.
See http://stce.be/newsletter/GNSS_final.pdf for some more explanations ; for detailed information, see http://gnss.be/ionosphere_tutorial.php