- Table of Content
- 1.A new Topical ...
- 2.PROBA2 Observa...
- 3.Review of sola...
- 4.The Internatio...
- 5.Review of geom...
- 6.Geomagnetic Ob...
- 7.The SIDC space...
- 8.Review of iono...
2. PROBA2 Observations (18 Mar 2019 - 24 Mar 2019)
3. Review of solar activity
4. The International Sunspot Number by SILSO
5. Review of geomagnetic activity
6. Geomagnetic Observations at Dourbes (18 Mar 2019 - 24 Mar 2019)
7. The SIDC space weather Briefing
8. Review of ionospheric activity (18 Mar 2019 - 24 Mar 2019)
A new Topical Issue for the SWSC Journal
The Journal of Space Weather and Space Climate (JSWSC - https://www.swsc-journal.org/ ) has opened a new Topical Issue entitled "Scientific Advances from the European Commission Horizon 2020 projects on Space Weather", as listed underneath. All EC-H2020 projects, funded by any of the H2020 work programme parts, which address space weather issues, are welcome to submit articles. The emphasis should be on novel scientific results. Copies of technical proposals or parts thereof should not be the main thrust of the articles.
Questions regarding this topical issue are to be addressed to the topical editor-in-chief, Jan Lastovicka (Institute of Atmospheric Physics CAS, Czech Republic). For questions concerning the submission process, please contact the Editorial Office (jswsc@edpsciences.org ). Manuscripts have to be submitted in PDF format via the JSWSC online submission tool before the 30 September 2019 deadline. If you need additional time to complete your submission, please do not hesitate to contact the JSWSC Editorial Office at jswsc@edpsciences.org
Topical Issue: Scientific Advances from the European Commission Horizon 2020 projects on Space Weather
Scope and guidelines are at https://www.swsc-journal.org/news
The Topical Editor-in-Chief is Jan Lastovicka (jla@ufa.cas.cz )
Deadline for submission: 30 September 2019

PROBA2 Observations (18 Mar 2019 - 24 Mar 2019)
Solar Activity
Solar flare activity fluctuated between very low and low during the week.
In order to view the activity of this week in more detail, we suggest to go to the following website from which all the daily (normal and difference) movies can be accessed: http://proba2.oma.be/ssa
This page also lists the recorded flaring events.
A weekly overview movie can be found here (SWAP week 469): http://proba2.oma.be/swap/data/mpg/movies/weekly_movies/weekly_movie_2019_03_18.mp4
Details about some of this week's events, can be found further below.
If any of the linked movies are unavailable they can be found in the P2SC movie repository here: http://proba2.oma.be/swap/data/mpg/movies/
Wednesday Mar 20
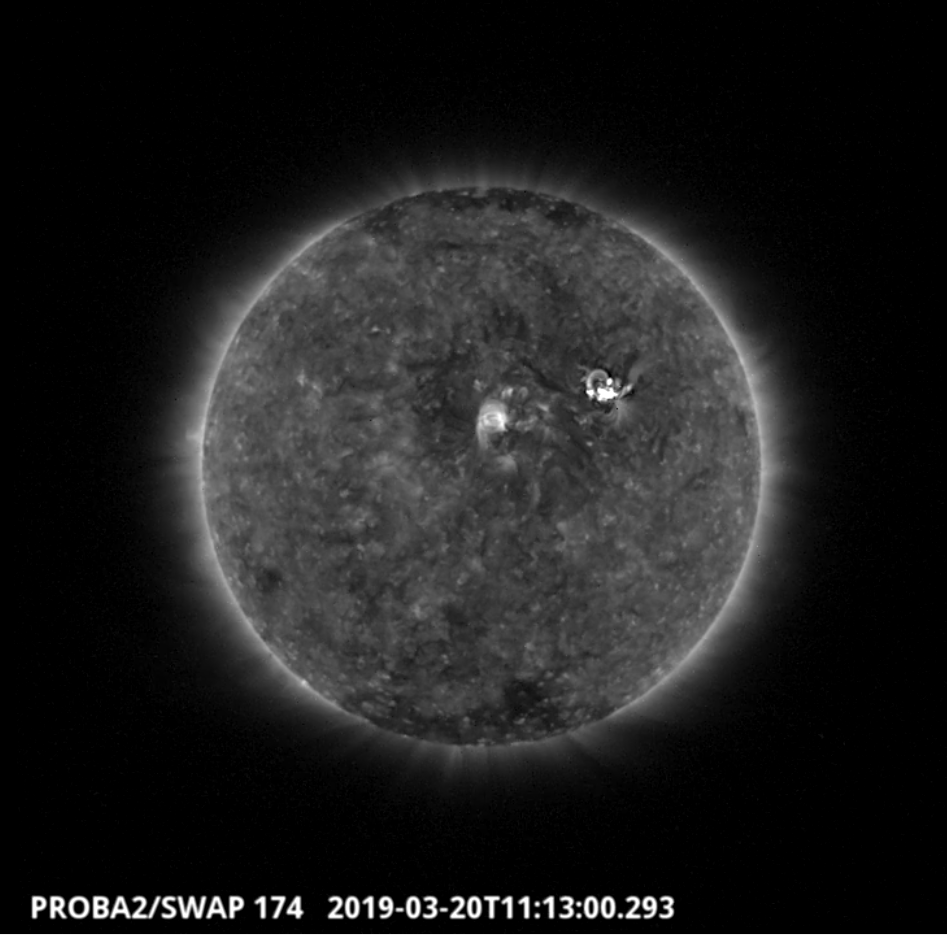
The first C-class (C4.8) flare of the week from NOAA AR 2736 was observed by SWAP and LYRA on 2019-Mar-20. The flare and associated eruption is visible in the SWAP image above at 11:13 UT, located in the north-west of the solar disk.
Find a movie of the event here http://proba2.oma.be/swap/data/mpg/movies/20190320_swap_movie.mp4 (SWAP movie) and here http://proba2.oma.be/swap/data/mpg/movies/20190320_swap_diff.mp4 (SWAP difference movie).
Thursday Mar 21
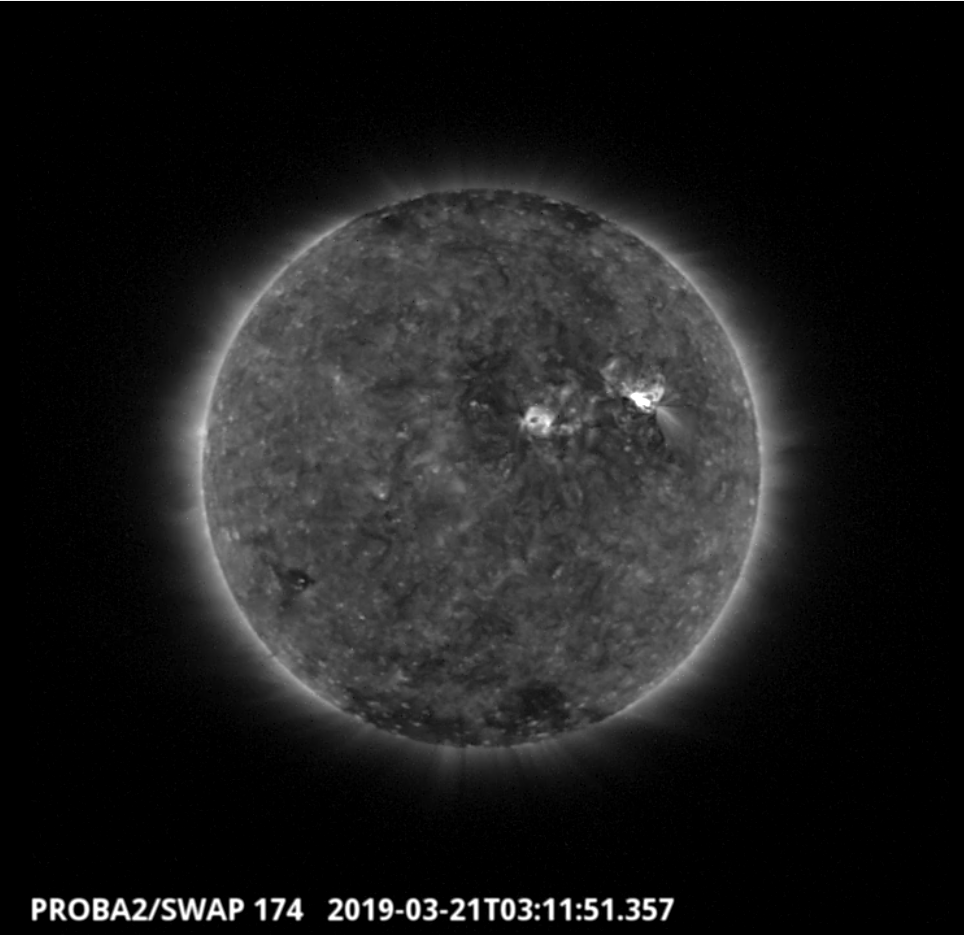
SWAP and LYRA observed another C-class flare (C5.6) on 2019-Mar-21. The flare is visible in the SWAP image above at 3:11 UT, located in the north-west of the solar disk.
Find a movie of the event here http://proba2.oma.be/swap/data/mpg/movies/20190321_swap_movie.mp4 (SWAP movie) and here http://proba2.oma.be/swap/data/mpg/movies/20190321_swap_diff.mp4 (SWAP difference movie).
Review of solar activity
Solar activity was dominated by NOAA AR 2736.
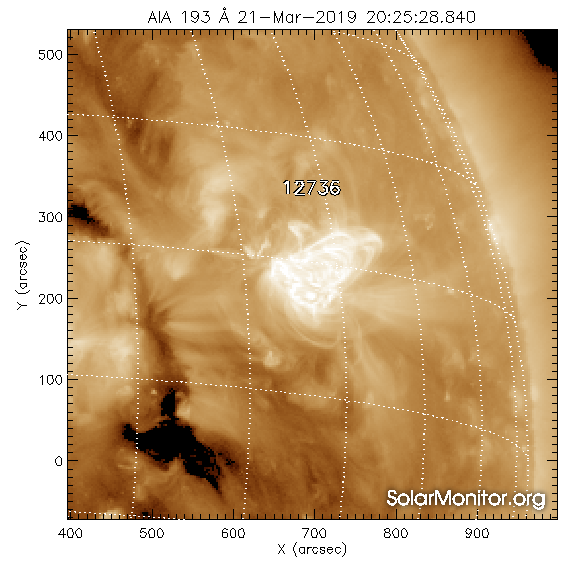
NOAA numbered it on March 21 although the region was already visible (northwest of the more quiet NOAA AR 2735) before that day. By March 22, this active region had a beta-gamma-delta magnetic field configuration. It produced 13 C-class flares. This region was the source of a halo CME on March 20 at 12:00 UT, mostly directed towards the northwest but with an Earth directed component. CACTus estimated that the CME had a speed of 750 km/s. This estimation is based on LASCO images.
The International Sunspot Number by SILSO
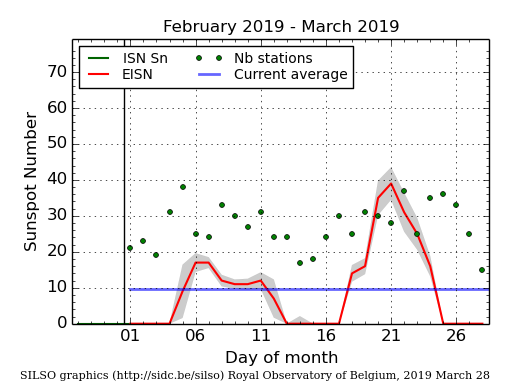
The daily Estimated International Sunspot Number (EISN, red curve with shaded error) derived by a simplified method from real-time data from the worldwide SILSO network. It extends the official Sunspot Number from the full processing of the preceding month (green line). The plot shows the last 30 days (about one solar rotation). The horizontal blue line shows the current monthly average, while the green dots give the number of stations included in the calculation of the EISN for each day.
Review of geomagnetic activity
Geomagnetic activity was quiet to unsettled.
On March 19, signatures of the compression region in front of a high speed stream were seen in solar wind data from DSCOVR at the L1 point. The high speed stream is associated with a positive polarity coronal hole.
Nevertheless, the speed of the compressed solar wind was not higher than 420 km/s and the Bz component of the imbedded magnetic field was only -4 nT. In consequence, no geomagnetic storm was observed.
The flank of the 20 March CME was expected near Earth March 23. But on its way to Earth, the CME was slowed down by the extremely slow solar wind in front (with speeds around 260 km/s). As a consequence, the flank, seen as a shock arrived only on March 24 (at 20:43 UT).
Geomagnetic Observations at Dourbes (18 Mar 2019 - 24 Mar 2019)
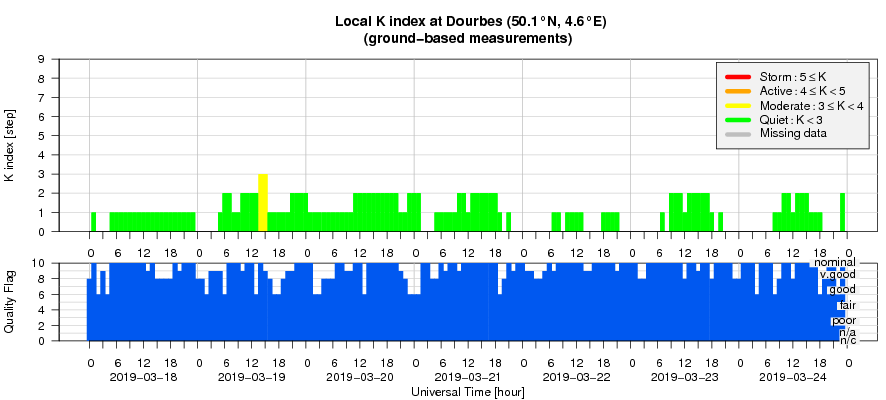
The SIDC space weather Briefing
The Space Weather Briefing presented by the forecaster on duty from March 18 to 24. It reflects in images and graphs what is written in the Solar and Geomagnetic Activity report.

The pdf-version: http://www.stce.be/briefings/20190325_SWbriefing.pdf
The automatically running presentation: http://www.stce.be/briefings/20190325_SWbriefing.ppsm
Review of ionospheric activity (18 Mar 2019 - 24 Mar 2019)
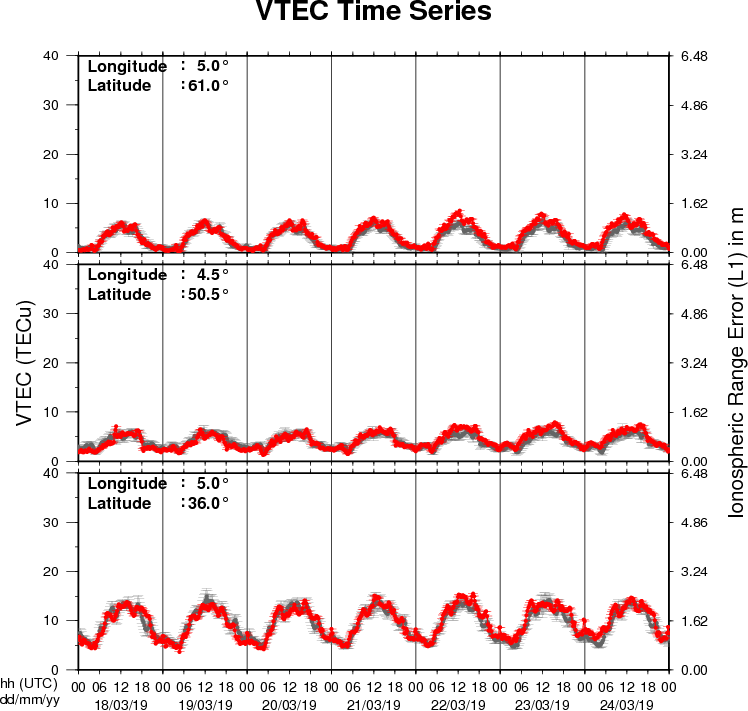
The figure shows the time evolution of the Vertical Total Electron Content (VTEC) (in red) during the last week at three locations:
a) in the northern part of Europe(N61°, 5°E)
b) above Brussels(N50.5°, 4.5°E)
c) in the southern part of Europe(N36°, 5°E)
This figure also shows (in grey) the normal ionospheric behaviour expected based on the median VTEC from the 15 previous days.
The VTEC is expressed in TECu (with TECu=10^16 electrons per square meter) and is directly related to the signal propagation delay due to the ionosphere (in figure: delay on GPS L1 frequency).
The Sun's radiation ionizes the Earth's upper atmosphere, the ionosphere, located from about 60km to 1000km above the Earth's surface.The ionization process in the ionosphere produces ions and free electrons. These electrons perturb the propagation of the GNSS (Global Navigation Satellite System) signals by inducing a so-called ionospheric delay.
See http://stce.be/newsletter/GNSS_final.pdf for some more explanations ; for detailed information, see http://gnss.be/ionosphere_tutorial.php