- Table of Content
- 1.Space junk
- 2.Cosmic Rays wo...
- 3.PROBA2 Observa...
- 4.Review of sola...
- 5.The Internatio...
- 6.Review of geom...
- 7.Geomagnetic Ob...
- 8.The SIDC space...
- 9.Review of iono...
2. Cosmic Rays workshop
3. PROBA2 Observations (25 Mar 2019 - 31 Mar 2019)
4. Review of solar activity
5. The International Sunspot Number by SILSO
6. Review of geomagnetic activity
7. Geomagnetic Observations at Dourbes (25 Mar 2019 - 31 Mar 2019)
8. The SIDC space weather Briefing
9. Review of ionospheric activity (25 Mar 2019 - 31 Mar 2019)
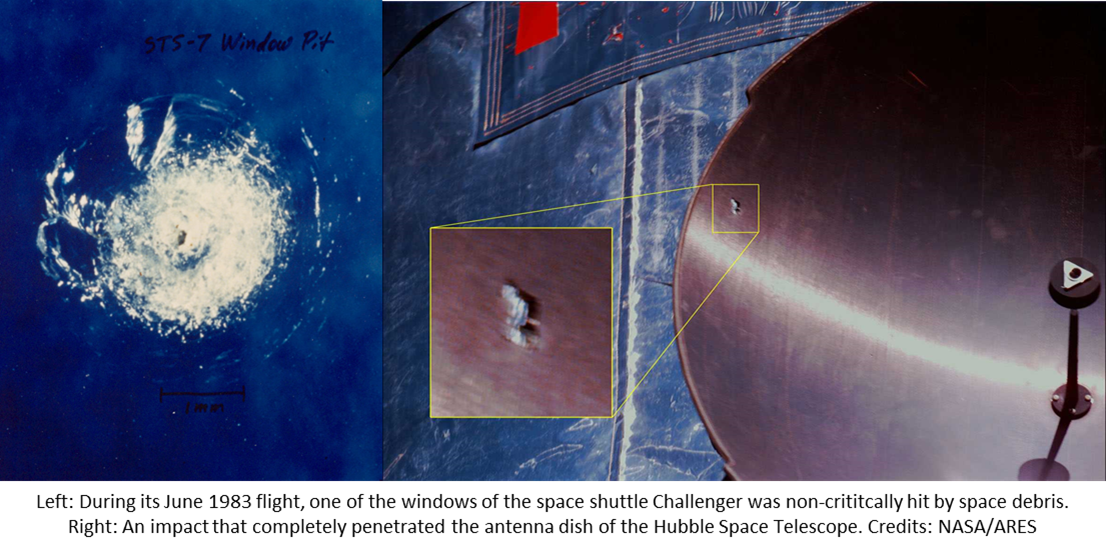
Space junk
On 27 March, India deliberately destroyed one of its own satellites as a test of their anti-satellite missile system. The so-called "Mission Shakti" shrapnelized the satellite, creating a debris cloud of mostly mm- and cm-sized high-velocity (several km/s) particles. The event took place at an altitude of about 300 km, barely 100 km beneath the orbit of the International Space Station, and thus immediately triggering alerts at NASA and other satellite operators. Indeed, those "speeding bullets" constitute a threat to the safe operations of satellites and thus also for astronauts. NASA Administrator Jim Bridenstine said the anti-satellite weapon created at least 400 pieces of debris, including 60 trackable fragments that are four inches across or larger. Of that total, 24 ended up in orbits with high points above the orbiting altitude of the space station. Over a period of 10 days following the Indian test, the risk of a debris impact with the space station jumped by 44 percent.
The energetic EUV and x-ray radiation from solar flares, and the dumping of tons of charged particles into the Earth’s atmosphere by coronal mass ejections (CMEs), heat up the Earth's atmosphere and make it expand. Satellites sense this expansion as an increase in density at the altitude at which they are flying. This atmospheric drag slows the satellite down, similar to your hand moving much slower through water than through air. Due to this drag, the satellite will gradually lose height and -if not raised back to its normal altitude- eventually return to Earth, mostly burning up during its passage through the atmosphere. Hence a solar cycle minimum, with only few flares and CMEs, is a good period for satellites as they can stay much longer in their earth's orbit (see also this newsitem at http://www.stce.be/news/201/welcome.html ). However, these very same low solar activity conditions also mean that space debris such as from India's test event can stay much longer in their orbit than usual, and thus can pose a threat to the operating satellites for a much longer time. Hence, the timing of the test with the anti-satellite weapon couldn't have come at a worse moment, as we are in the midst of a solar cycle minimum.
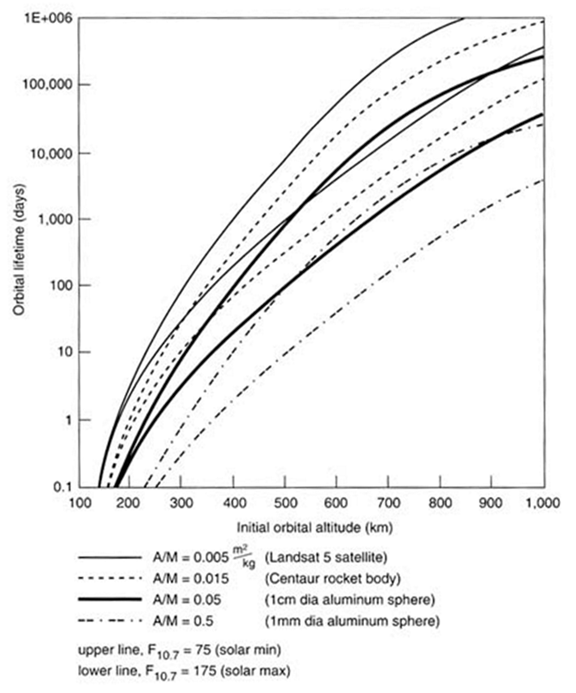
The diagram above (National Research Council) shows the predicted orbital lifetimes for a number of different objects in circular low earth orbits (LEOs) at different periods in the solar cycle, illustrating the importance of cross-sectional-area-to-mass ratio, altitude, and solar activity in determining orbital lifetimes in LEO. First, objects with low ratios of cross-sectional-area-to-mass decay much more slowly than objects with high area-to-mass ratios. Second, objects at low altitude experience more rapid orbital decay than objects at high altitude. Finally, objects decay much more rapidly during periods of solar maximum than during the solar minimum. The particles we are mainly concerned with here are the 1cm diameter aluminum spheres (A/M around 0.05), resembling very well the debris from the Indian event. Taking into account that some of the pieces are somewhat heavier (lower A/M, about 0.005) and have a higher altitude, as well as the current very low 10.7cm solar radio flux (a proxy for the Sun's EUV and x-ray radiation) barely reaching values of around 70 sfu (solar flux units), one can deduce from this graph that the orbital lifetimes of these particles can reach several weeks to months easily, instead of a few days to a week during solar maximum conditions. For this particular case, it is estimated that most of the space junk likely will fall back into the atmosphere and burn up over the next three weeks or so, although some fragments in higher orbits could stay aloft for about a year.
Credits and further reading
- This newsitem was loosely based on articles from Phys.org (https://phys.org/news/2019-03-indian-satellite-destruction-debris-field.html ), Spaceflight Now (https://spaceflightnow.com/2019/04/02/nasa-chief-slams-india-anti-satellite-test/ ), and Space.com (https://www.space.com/india-anti-satellite-test-significance.html ).
- The pictures showing space debris impacts were taken from NASA's Astromaterials Research and Exploration Science (ARES) webpage at https://www.orbitaldebris.jsc.nasa.gov/photo-gallery.html More pictures and a complete brochure on space debris can be found at ESA's dedicated webpage https://www.esa.int/Our_Activities/Operations/Space_Safety_Security/Space_Debris .
- The satellite's lifetime-altitude diagram was taken from National Research Council 1995. Orbital Debris: A Technical Assessment. Washington, DC: The National Academies Press. https://doi.org/10.17226/4765. It's freely downloadable at https://www.nap.edu/read/4765/chapter/1
Cosmic Rays workshop
Cosmic rays and energetic particles an issue for humans in high altitude polar flights, humans travelling in space, space technology, radio communication near the Earth poles and more. No need to say that these particles need our attention.
On Tuesday April 23, you will have the chance to listen to and discuss with particle radiation experts, to learn about 'Monitoring and measuring cosmic particles and radiation for space weather research and applications'
The place to be: Space Pole, Brussels, Belgium - https://events.oma.be/indico/event/62/

Welcome!
PROBA2 Observations (25 Mar 2019 - 31 Mar 2019)
Solar Activity
Solar flare activity was very low during the week.
In order to view the activity of this week in more detail, we suggest to go to the following website from which all the daily (normal and difference) movies can be accessed: http://proba2.oma.be/ssa
This page also lists the recorded flaring events.
A weekly overview movie can be found here (SWAP week 470): http://proba2.oma.be/swap/data/mpg/movies/weekly_movies/weekly_movie_2019_03_25.mp4
Details about some of this week’s events, can be found further below.
If any of the linked movies are unavailable they can be found in the P2SC movie repository here: http://proba2.oma.be/swap/data/mpg/movies/
Monday Mar 25
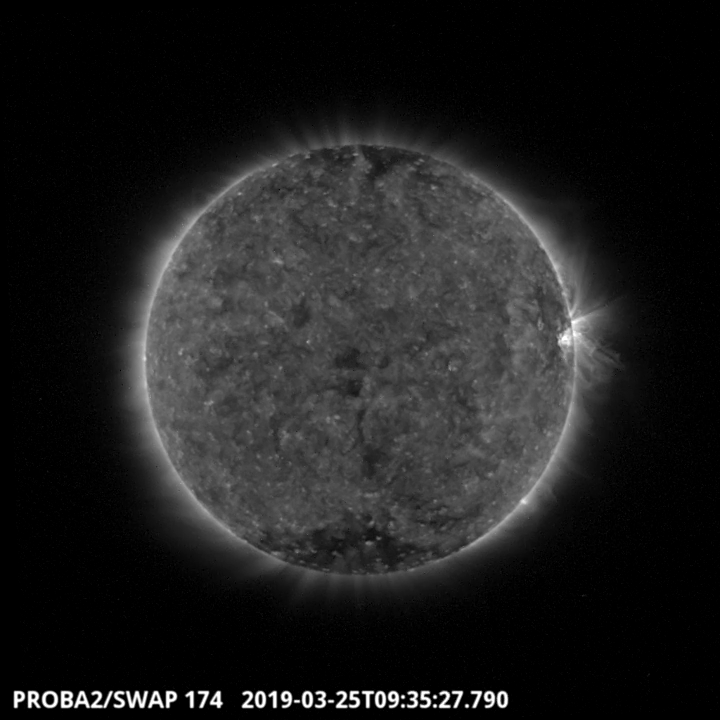
An extended coronal hole transited the solar meridian on 2019-Mar-25 around 9:35 UT and is visible in the SWAP image above. Find a movie of the events here (SWAP movie): http://proba2.oma.be/swap/data/mpg/movies/20190325_swap_movie.mp4
Monday Mar 25
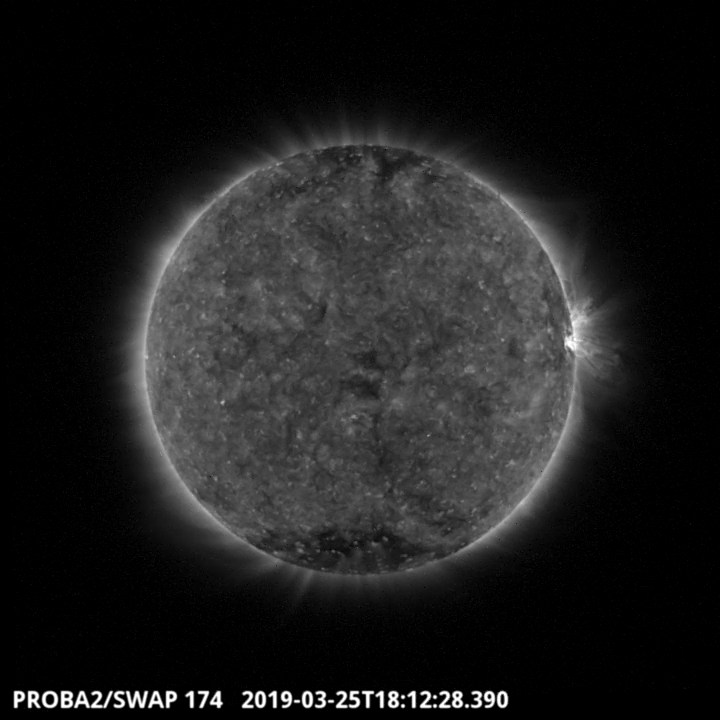
A series of B-class flares have been produced this week, from NOAA AR 2736. The biggest one, a B4.1 class flare with an associated eruption is visible in the SWAP image above at 18:12 UT on 2019-Mar-25, located in the western hemisphere of the solar disk. Find a movie of the event here (SWAP movie): http://proba2.oma.be/swap/data/mpg/movies/20190325_swap_movie.mp4
Review of solar activity
The Sun produced 9 B-class flares at the beginning of the week. The flaring sunspots rotated behind the West limb on March 26 and left the Sun spotless.
A few narrow CMEs were observed this week but none of them was Earth directed.
The solar proton flux near Earth remained at the background level.
Two coronal holes transited the visible side of the Sun, both equatorial and with negative polarity. One coronal hole reached the central meridian on March 22, previous week, the other coronal hole reached the central meridian on March 25.
The International Sunspot Number by SILSO
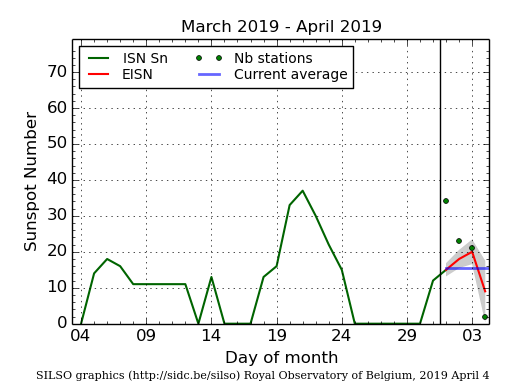
The daily Estimated International Sunspot Number (EISN, red curve with shaded error) derived by a simplified method from real-time data from the worldwide SILSO network. It extends the official Sunspot Number from the full processing of the preceding month (green line). The plot shows the last 30 days (about one solar rotation). The horizontal blue line shows the current monthly average, while the green dots give the number of stations included in the calculation of the EISN for each day.
Review of geomagnetic activity
The solar wind near the L1 point (near Earth) had a speed of about 330 km/s, this is low. The magnetic field carried by the solar wind had a magnitude around 5 nT.
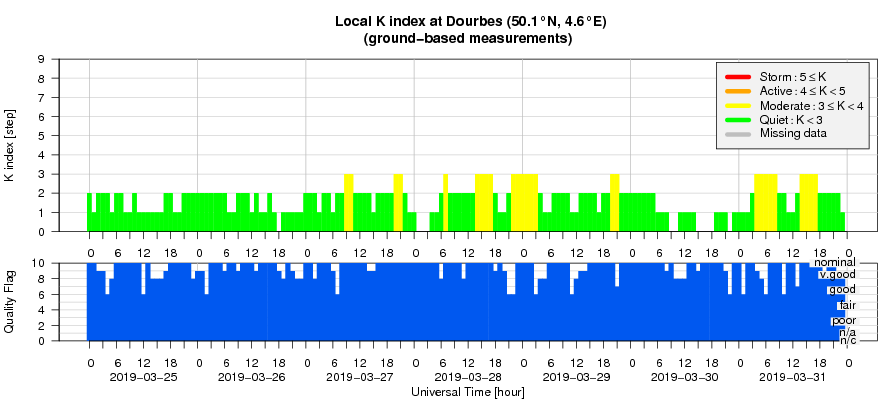
The solar wind emanating from the coronal hole that reached the central meridian on March 22 changed this from March 28 as the wind was slightly speeded up. The impact on the Earth magnetic field resulted in unsettled conditions: the station at Dourbes reported K indexes of 3 and NOAA estimated planetary Kp indexes of 3.
NOAA estimated a Kp index of 4 during one 3 hour interval on March 31.
Geomagnetic Observations at Dourbes (25 Mar 2019 - 31 Mar 2019)
The SIDC space weather Briefing
The Space Weather Briefing presented by the forecaster on duty from March 25 to 31. It reflects in images and graphs what is written in the Solar and Geomagnetic Activity report.

The pdf-version: http://www.stce.be/briefings/20190401_SWbriefing.pdf
The automatically running presentation: http://www.stce.be/briefings/20190401_SWbriefing.ppsm
Review of ionospheric activity (25 Mar 2019 - 31 Mar 2019)
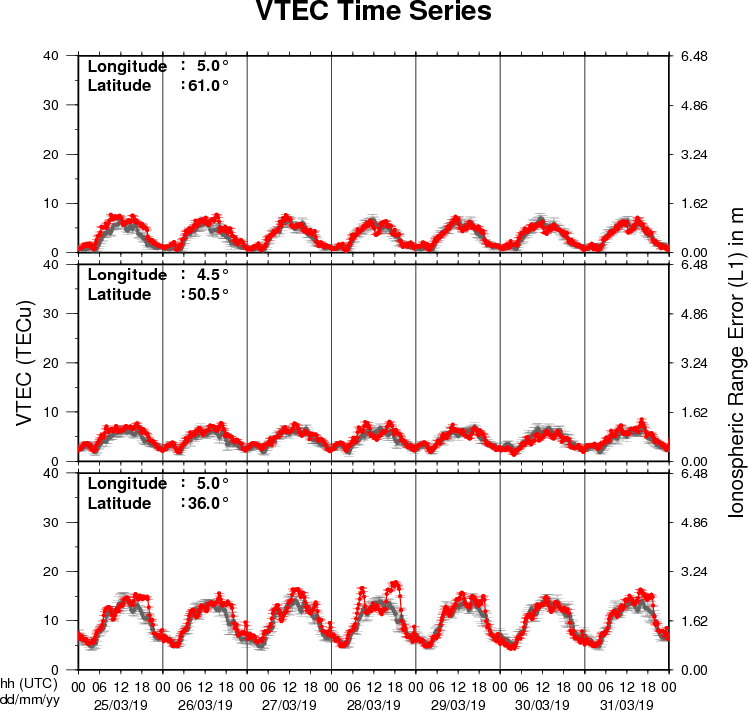
The figure shows the time evolution of the Vertical Total Electron Content (VTEC) (in red) during the last week at three locations:
a) in the northern part of Europe(N61°, 5°E)
b) above Brussels(N50.5°, 4.5°E)
c) in the southern part of Europe(N36°, 5°E)
This figure also shows (in grey) the normal ionospheric behaviour expected based on the median VTEC from the 15 previous days.
The VTEC is expressed in TECu (with TECu=10^16 electrons per square meter) and is directly related to the signal propagation delay due to the ionosphere (in figure: delay on GPS L1 frequency).
The Sun's radiation ionizes the Earth's upper atmosphere, the ionosphere, located from about 60km to 1000km above the Earth's surface.The ionization process in the ionosphere produces ions and free electrons. These electrons perturb the propagation of the GNSS (Global Navigation Satellite System) signals by inducing a so-called ionospheric delay.
See http://stce.be/newsletter/GNSS_final.pdf for some more explanations ; for detailed information, see http://gnss.be/ionosphere_tutorial.php