- Table of Content
- 1.Dynamic NOAA 2...
- 2.ESWW2019 - the...
- 3.The SIDC space...
- 4.PROBA2 Observa...
- 5.Review of sola...
- 6.Review of geom...
- 7.The Internatio...
- 8.Geomagnetic Ob...
- 9.Review of iono...
2. ESWW2019 - the floor is yours!
3. The SIDC space weather Briefing
4. PROBA2 Observations (8 Apr 2019 - 14 Apr 2019)
5. Review of solar activity
6. Review of geomagnetic activity
7. The International Sunspot Number by SILSO
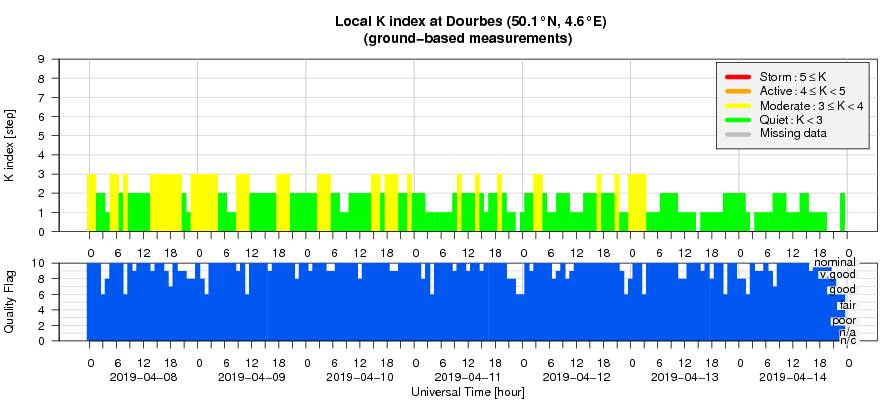
8. Geomagnetic Observations at Dourbes (8 Apr 2019 - 14 Apr 2019)
9. Review of ionospheric activity (8 Apr 2019 - 14 Apr 2019)
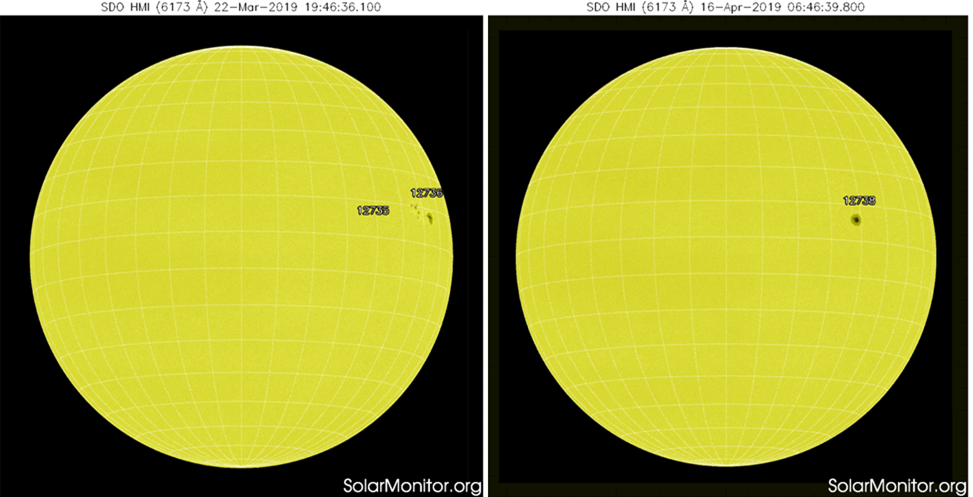
Dynamic NOAA 2738
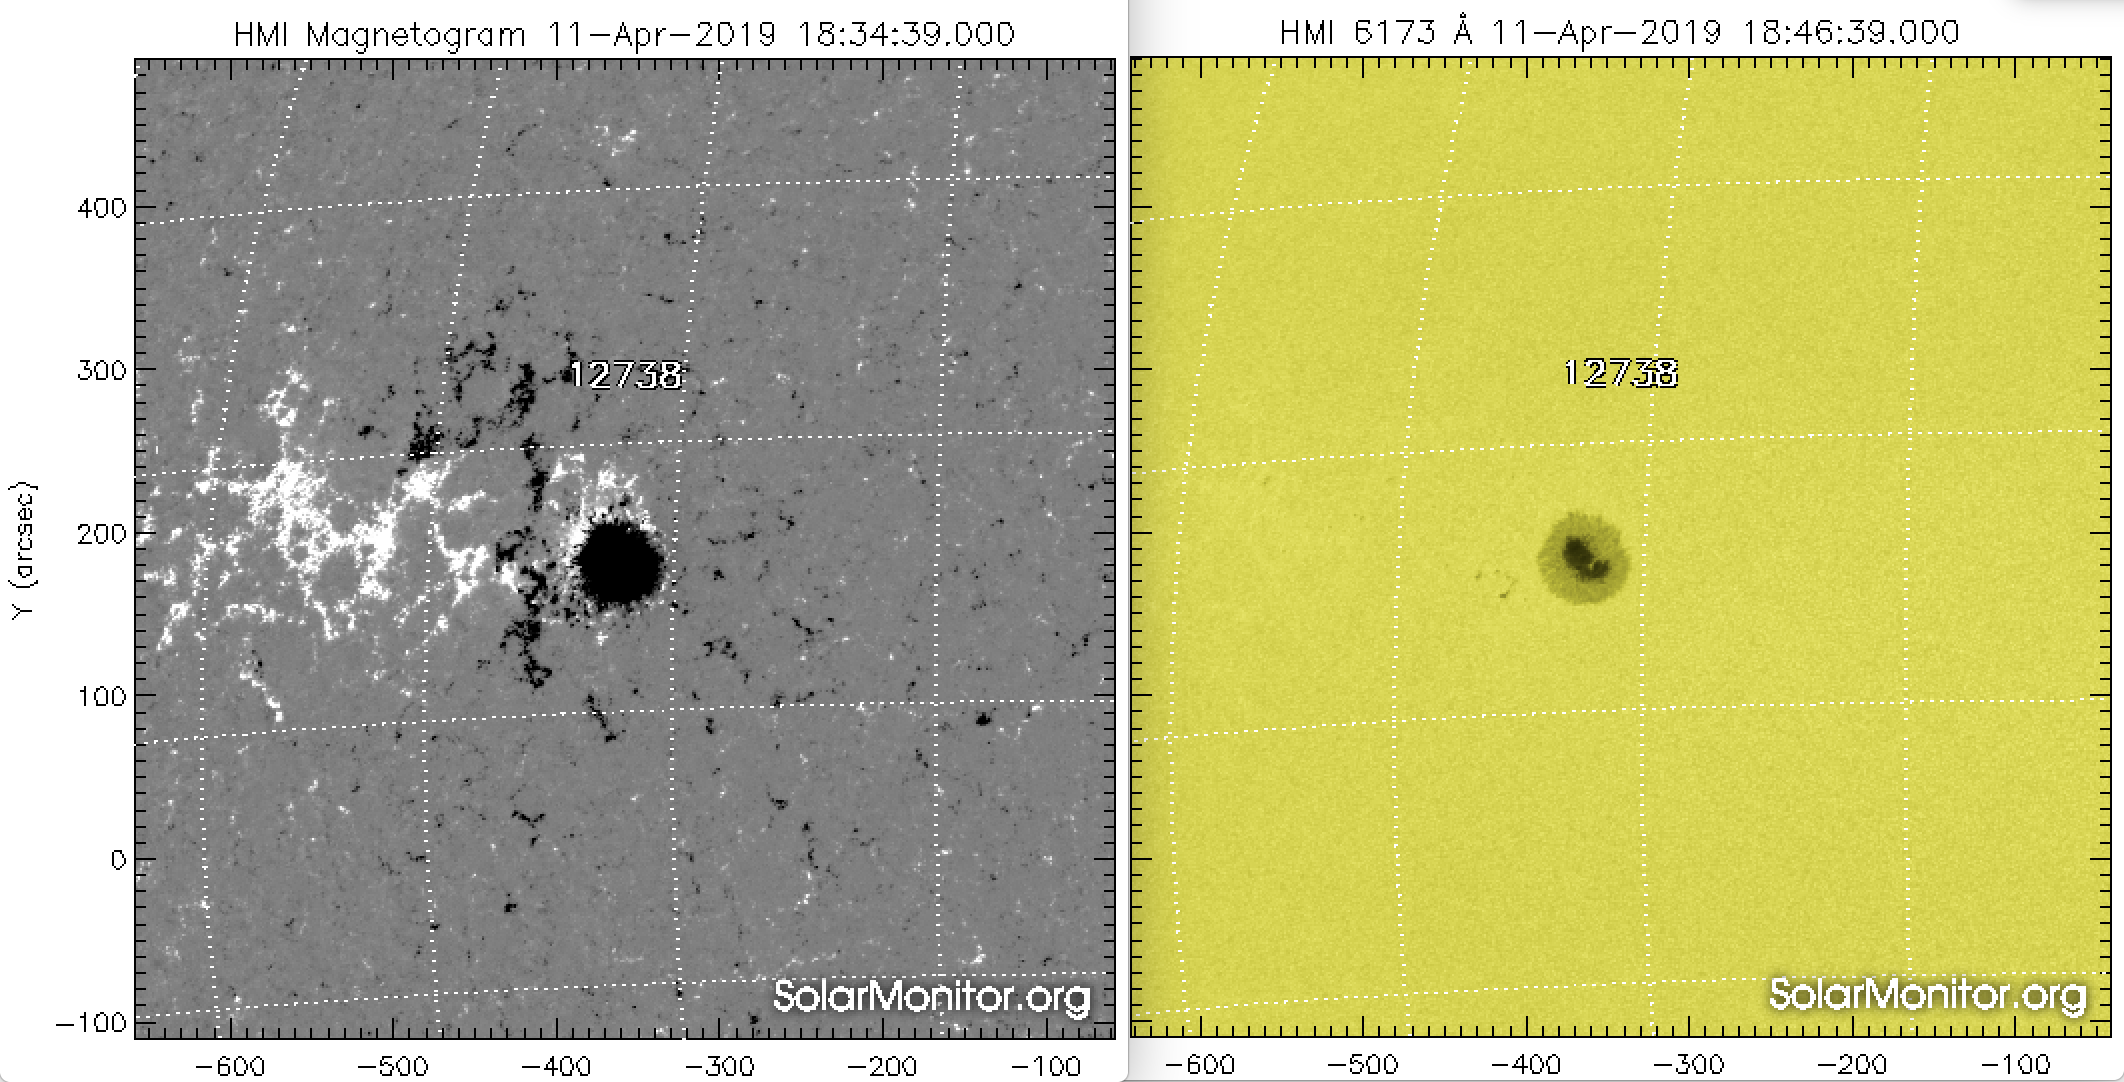
Active region NOAA 2738 rotated over the Sun's east limb as a single big sunspot on 7 April. It was actually the return of NOAA 2736 which had rounded the west limb just 2 weeks earlier as a rather complex and flaring region. NOAA 2738 was the remainder of this group, i.e. the main leading spot. Underneath two white light images from SDO/HMI showing active regions NOAA 2736 on the left and NOAA 2738 on the right, almost a solar rotation later.
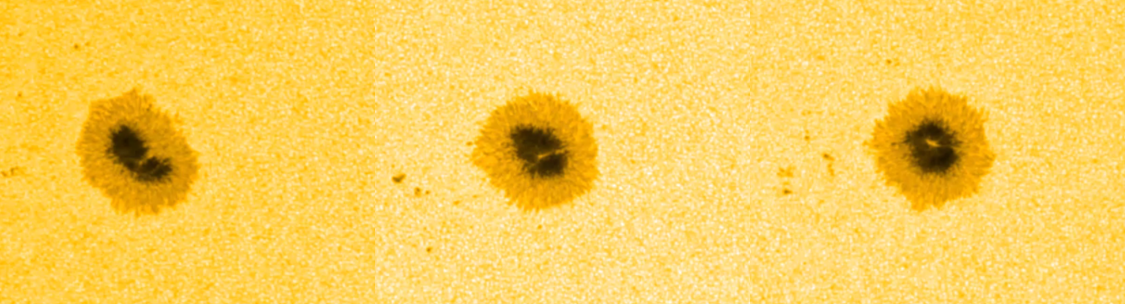
NOAA 2738 was not very flare active, restricting itself to B-class flares. In white light imagery (SDO/HMI - https://sdo.gsfc.nasa.gov/ ), one can observe fine, slowly moving bright structures that are overlaying the umbra (dark core of the sunspot). These are called light bridges and usually herald the decaying phase of the spot. Nonetheless, over the last week, this sunspot did not fragment or become much smaller. In fact the spot was near naked-eye visibility (using solar eclipse glasses!) all week. The light bridges and changing appearance of the sunspot are well visible in the imagery underneath (11-13-15 April).
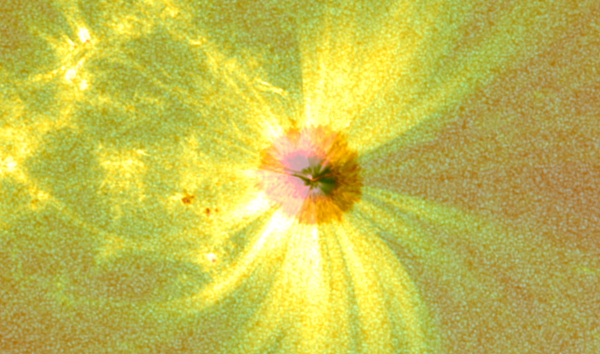
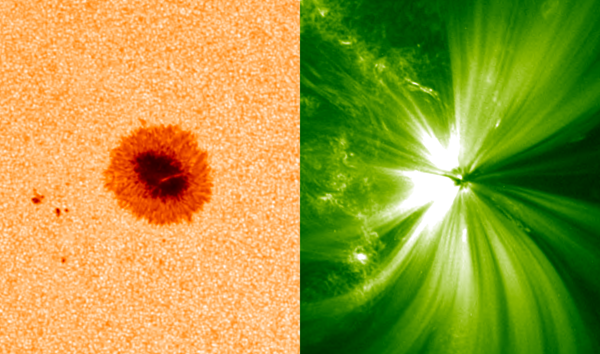
The close-ups underneath show a combination of SDO/HMI and SDO/AIA 171 pictures (using the JHelioviewer software - https://www.jhelioviewer.org/ ), bringing white light (WL) and extreme ultraviolet (EUV) images together. We can observe the shape of the magnetic fields above the sun's surface because the magnetic field lines guide the motion of the heated plasma (charged particles) that are present, hence the otherwise invisible magnetic loops and towers of material in the corona glow brightly in EUV images. The dynamics of the magnetic field lines over the sunspot are obvious. Some minor flaring can be observed too. The images cover the period from 12 April (18UT) to 13 April (18UT) at a 10 minute cadence. The top image has the WL and EUV image overlaid, whereas the bottom image compares them side by side. The movie clips can be found at the related STCE website http://www.stce.be/news/454/welcome.html
ESWW2019 - the floor is yours!

What are these cartoons trying to tell you?
Find it out at: http://www.stce.be/esww2019/program/sessions.php and http://www.stce.be/esww2019/call4tdm.php
The floor is yours!
P.S. You can also already register. The early bird rate runs until July 31.
The SIDC space weather Briefing
The Space Weather Briefing presented by the forecaster on duty from April 8 to April 15. It reflects in images and graphs what is written in the Solar and Geomagnetic Activity report.
The pdf-version: http://www.stce.be/briefings/20190415_SWbriefing.pdf
The automatically running presentation: http://www.stce.be/briefings/20190415_SWbriefing.ppsm
PROBA2 Observations (8 Apr 2019 - 14 Apr 2019)
Solar Activity
Solar flare activity was very low during the week.
In order to view the activity of this week in more detail, we suggest to go to the following website from which all the daily (normal and difference) movies can be accessed: http://proba2.oma.be/ssa
This page also lists the recorded flaring events.
A weekly overview movie can be found here (SWAP week 472): http://proba2.oma.be/swap/data/mpg/movies/weekly_movies/weekly_movie_2019_04_08.mp4
Details about some of this week’s events, can be found further below.
If any of the linked movies are unavailable they can be found in the P2SC movie repository here http://proba2.oma.be/swap/data/mpg/movies/
Friday Apr 12
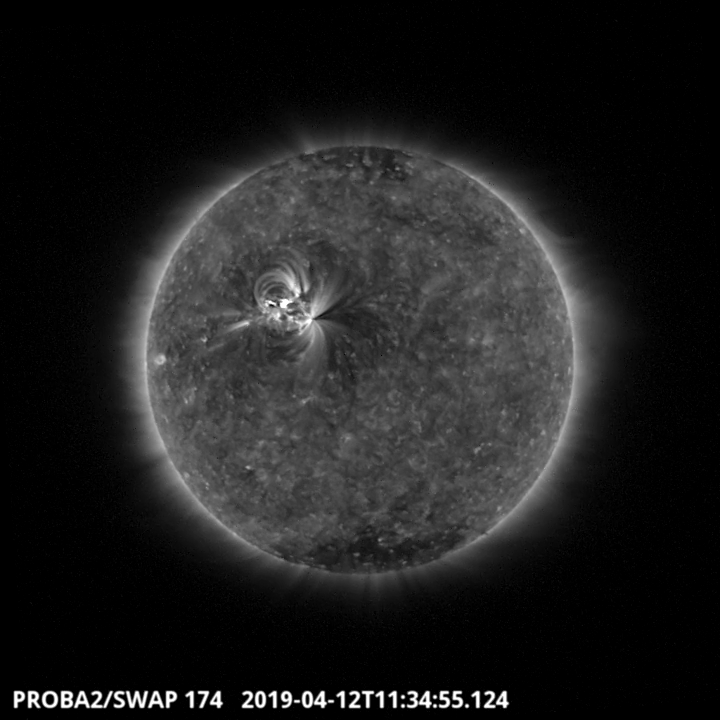
The NOAA active Region 2738 has produced a series of B-class flares during this week, including the B7.1 class flare shown on the SWAP image above at 11:34 UT on 2019-Apr-12. Find a movie of the events here (SWAP movie) http://proba2.oma.be/swap/data/mpg/movies/20190412_swap_movie.mp4
Review of solar activity
Solar activity was low.
The largest flare was a B7.1 class flare, which peaked at 11:37 UT on 12-Apr-2018. Active Region (AR) 2738 was the only significant region on the solar disk and produced all of the flaring activity, showing some evidence of flux emergence and cancellation in HMI magnetogram observations.
No significant filament channels were seen on the solar disk. A back-sided filament eruption (STEREO-A Observations) emerging from near the south polar coronal hole occurred around 14:30 UT on 11-Apr-2019. The eruption was seen as a small Coronal Mass Ejection (CME) emerging to the south-east of the solar disk in LASCO observations. The eruption had no Earth directed component.
No Earth directed CMEs have been detected.
The greater than 10MeV proton flux remained at background levels throughout the week.
Review of geomagnetic activity
The solar wind speed has fluctuated between 380 and 480 km/s over the past week.
The total magnetic field strength has fluctuated between 3.5 and 8.0 nT, peaking on 08-Apr-2019. The Bz component has fluctuated between -8 and +7 nT.
Geomagnetic conditions ranged between Kp index 1-4 (NOAA) and local K index 0-3 (Dourbes). Kp reached 4 on a couple of occasions when the Bz reached values around -8 nT.
The International Sunspot Number by SILSO
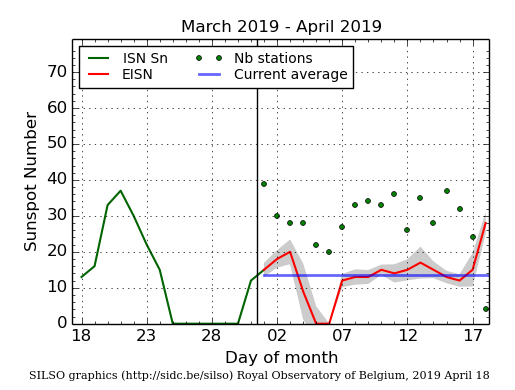
The daily Estimated International Sunspot Number (EISN, red curve with shaded error) derived by a simplified method from real-time data from the worldwide SILSO network. It extends the official Sunspot Number from the full processing of the preceding month (green line). The plot shows the last 30 days (about one solar rotation). The horizontal blue line shows the current monthly average, while the green dots give the number of stations included in the calculation of the EISN for each day.
Geomagnetic Observations at Dourbes (8 Apr 2019 - 14 Apr 2019)
Review of ionospheric activity (8 Apr 2019 - 14 Apr 2019)
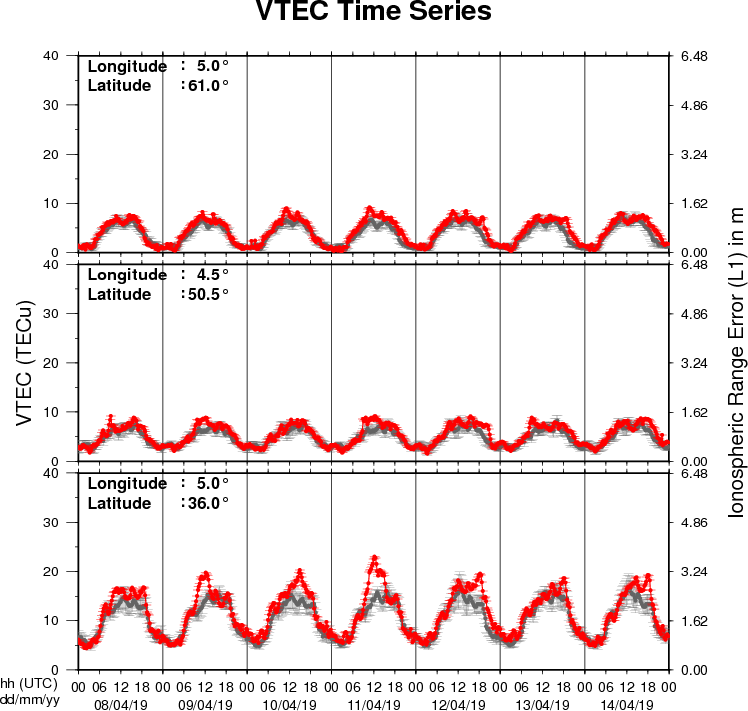
The figure shows the time evolution of the Vertical Total Electron Content (VTEC) (in red) during the last week at three locations:
a) in the northern part of Europe(N61°, 5°E)
b) above Brussels(N50.5°, 4.5°E)
c) in the southern part of Europe(N36°, 5°E)
This figure also shows (in grey) the normal ionospheric behaviour expected based on the median VTEC from the 15 previous days.
The VTEC is expressed in TECu (with TECu=10^16 electrons per square meter) and is directly related to the signal propagation delay due to the ionosphere (in figure: delay on GPS L1 frequency).
The Sun's radiation ionizes the Earth's upper atmosphere, the ionosphere, located from about 60km to 1000km above the Earth's surface.The ionization process in the ionosphere produces ions and free electrons. These electrons perturb the propagation of the GNSS (Global Navigation Satellite System) signals by inducing a so-called ionospheric delay.
See http://stce.be/newsletter/GNSS_final.pdf for some more explanations ; for detailed information, see http://gnss.be/ionosphere_tutorial.php