- Table of Content
- 1.The Sun keeps ...
- 2.Evolution of a...
- 3.ESWW2019 - the...
- 4.PROBA2 Observa...
- 5.Review of sola...
- 6.Review of geom...
- 7.The Internatio...
- 8.Geomagnetic Ob...
- 9.The SIDC space...
- 10.Review of iono...
2. Evolution of a Coronal Cavity using SWAP, AIA, EUVI and LASCO data
3. ESWW2019 - the floor is still yours!
4. PROBA2 Observations (6 May 2019 - 12 May 2019)
5. Review of solar activity
6. Review of geomagnetic activity
7. The International Sunspot Number by SILSO
8. Geomagnetic Observations at Dourbes (6 May 2019 - 12 May 2019)
9. The SIDC space weather Briefing
10. Review of ionospheric activity (6 May 2019 - 12 May 2019)
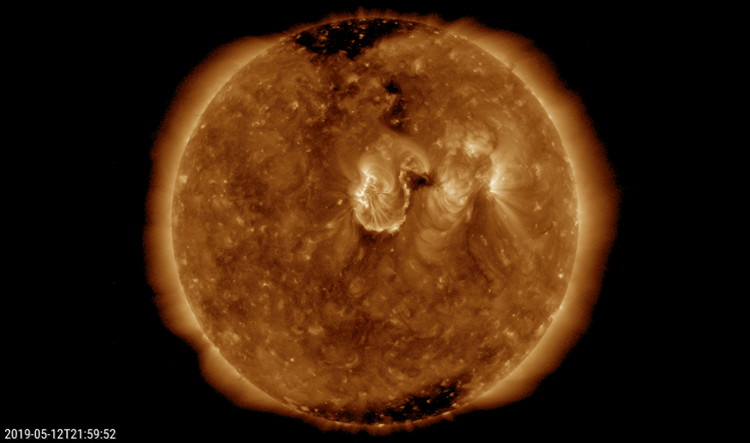
The Sun keeps on burping
On 12 and 13 May, important eruptions took place in the southern portion of NOAA 2741. It concerned long-duration, low-level B-class events featuring large-scale coronal dimming and arcades (series of post-eruption coronal loops) - See http://www.stce.be/news/418/welcome.html and http://www.stce.be/news/408/welcome.html for more examples of these features. The extreme ultraviolet images from SDO (AIA 193 - https://sdo.gsfc.nasa.gov/data/aiahmi/) underneath show both eruptions late on 12 May and during the afternoon of 13 May (lower left). The events were surprisingly impressive in view of the modest size and relative simple magnetic configuration of the source sunspot group. Movies of the events are at http://www.stce.be/news/456/welcome.html
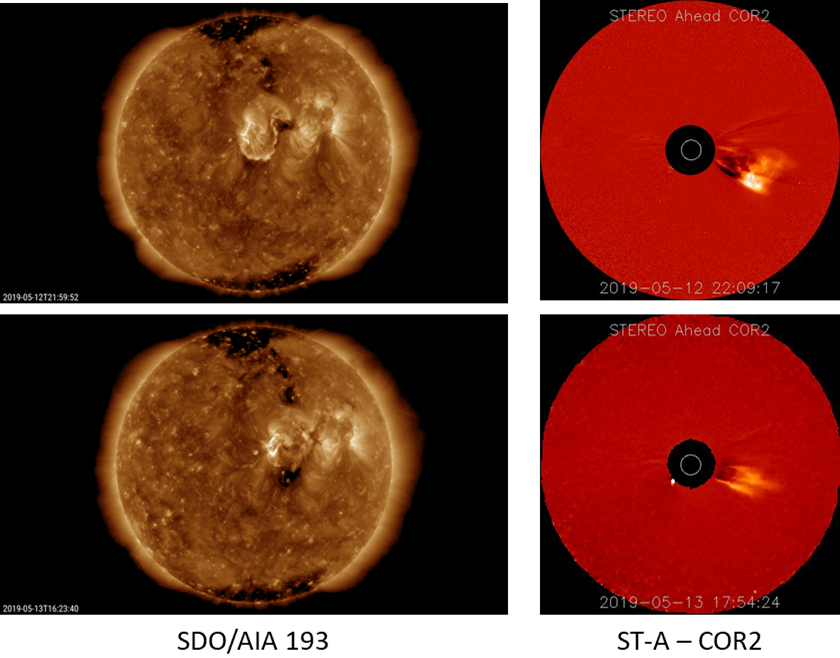
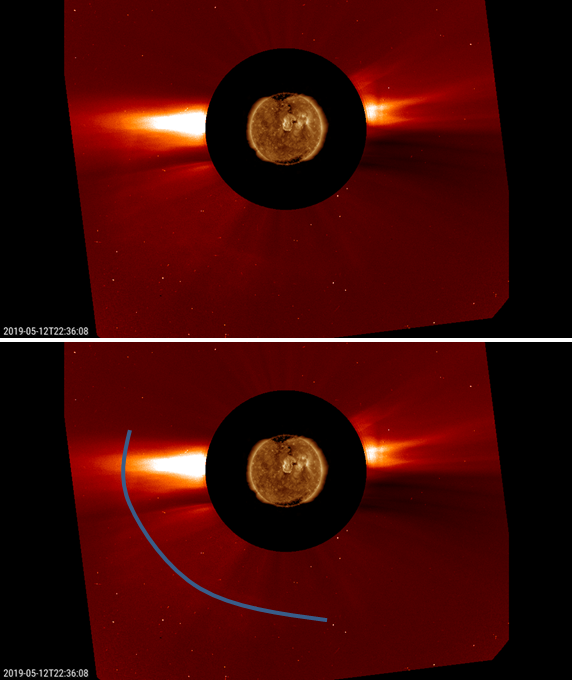
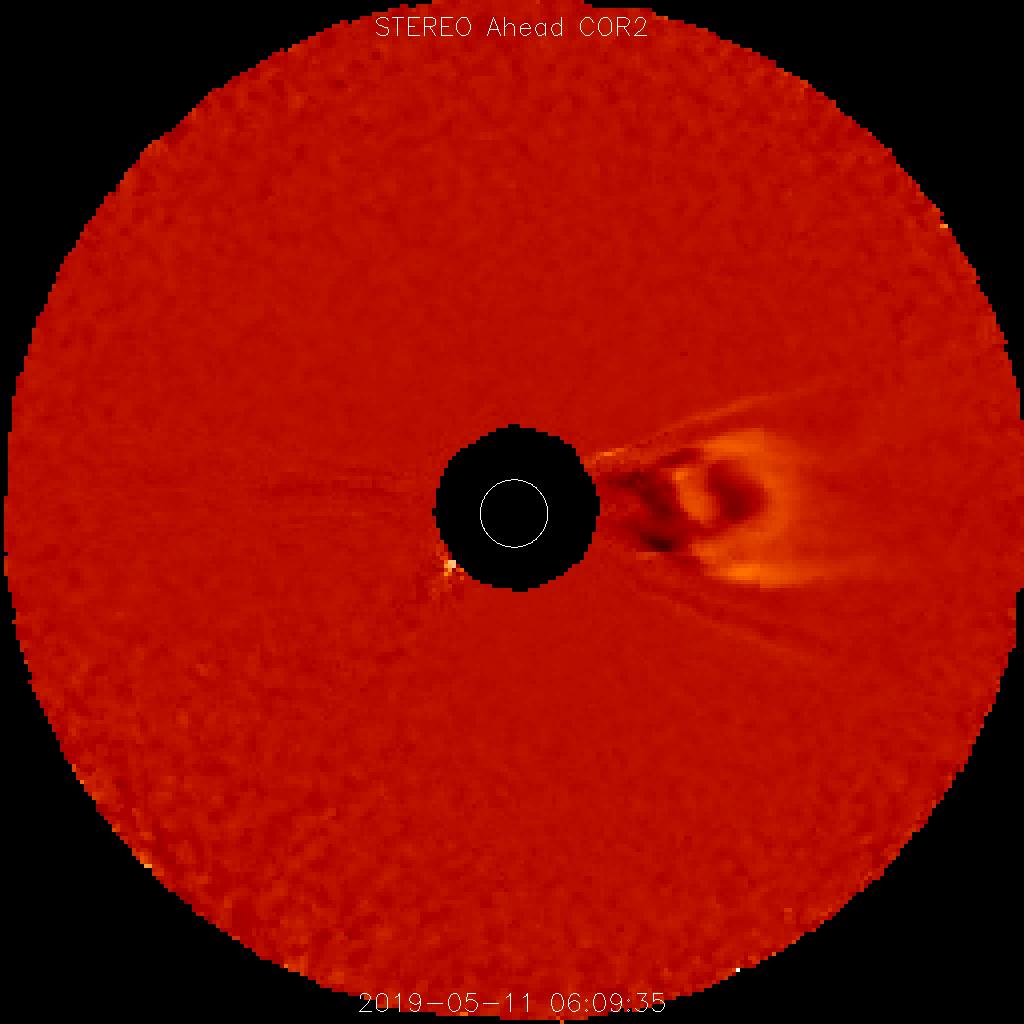
Both eruptions were accompanied by coronal mass ejections (CMEs) likely containing an earth-directed component. They are not very obvious in SOHO's coronagraphic imagery (see underneath), but display very well in the above STEREO-A imagery (to the right) where the source region was nearly at the west limb (STEREO-A is currently about 90 degrees trailing the Earth - see the ST-A website at https://stereo-ssc.nascom.nasa.gov/where.shtml). If the CMEs reach the earth environment (currently forecast for 16 and 17 May), geomagnetic activity may increase again, just as it did following the arrival of the last few interplanetary CMEs (ICMEs) generated by NOAA 2740.
Evolution of a Coronal Cavity using SWAP, AIA, EUVI and LASCO data
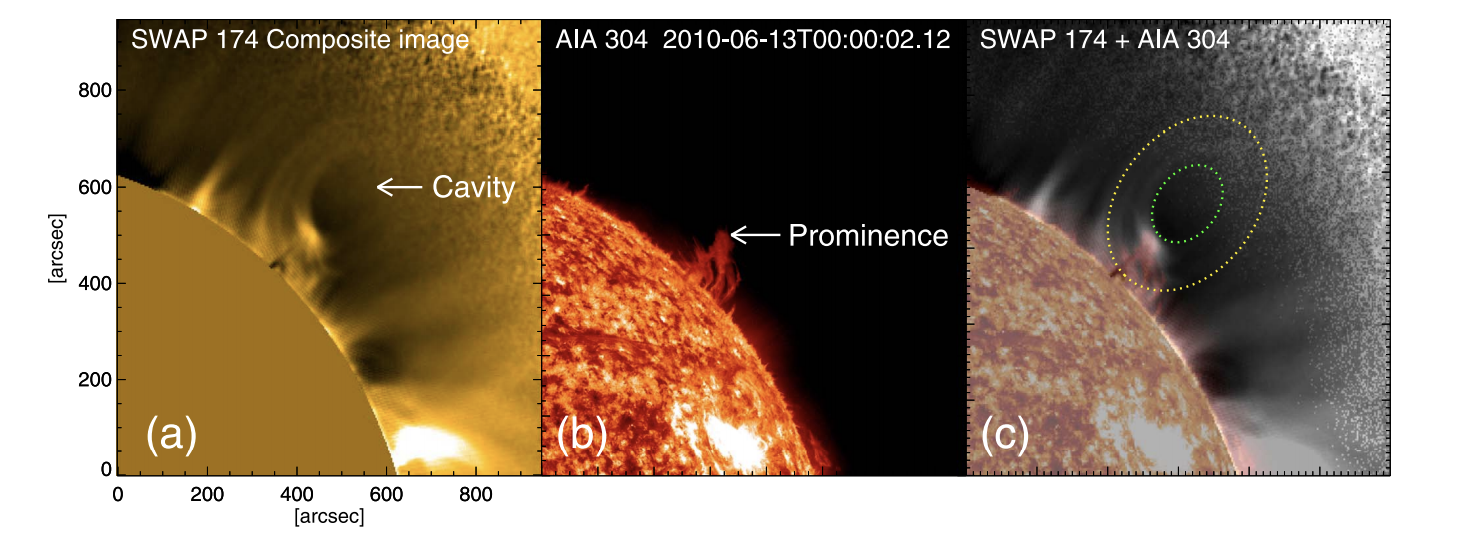
This image shows a coronal cavity observed by PROBA2/SWAP along with its associated filament as seen in SDO/AIA data. Coronal cavities are believed to be the low-density cross sections of magnetic flux ropes. They are usually observed as dark (partial) ellipses at the limb in white-light and extreme ultraviolet (EUV) observations. Sometimes coronal cavities erupt from the Sun’s surface in the form of coronal mass ejections (CMEs).
To better understand what triggers these solar eruptions, a team of scientists from the Udaipur Solar Observatory, India and from the Royal Observatory of Belgium, led by Ranadeep Sarkar, has pieced together observations over time of a coronal cavity that was witnessed in May-June 2010.
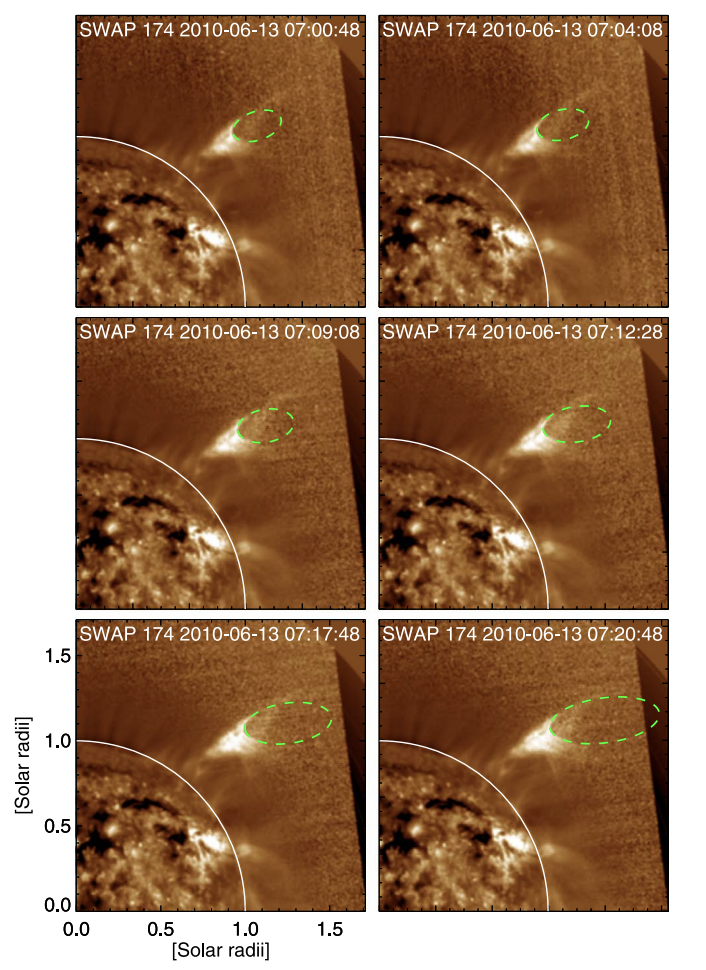
Sarkar and collaborators used observations from multiple vantage points (SDO/AIA, STEREO/EUVI, PROBA2/SWAP, and SOHO/LASCO) to track the cavity’s evolution from a quasi-static equilibrium in the lower corona to eruption into space. (See figure on the left)
This study was initiated in the frame of the PROBA2 Guest Investigator Programme. The SWAP observations were vital to this work because the large field-of-view of the SWAP instrument allowed the researchers to track the cavity up to almost 1.7 solar radii, whereas the field-of-view of the SDO/AIA telescope is limited to 1.3 solar radii.
The analysis is published in the Astrophysical Journal and this article was featured this week on the AAS Nova website (https://aasnova.org/2019/05/06/featured-image-tracking-a-hole-from-the-sun/), which is designed to highlight some of the most interesting recent results published in AAS journals.
Credits: Images reproduced from Sarkar et al. 2019, ApJ, 875, 101
ESWW2019 - the floor is still yours!
Dear Colleagues
If you find the time to
* submit an abstract, http://www.stce.be/esww2019/program/sessions.php, deadline June 9, October 10 for late poster submission ,
* submit a Topical Discussion Meeting: http://www.stce.be/esww2019/call4tdm.php, deadline June 9,
* or to register for ESWW2019: http://www.stce.be/esww2019/registration.php,
don’t hesitate.
Looking forward to your input!
The LOC, on behalf of the PC.

PROBA2 Observations (6 May 2019 - 12 May 2019)
Solar Activity
Solar flare activity fluctuated between very low and low during the week.
In order to view the activity of this week in more detail, we suggest to go to the following website from which all the daily (normal and difference) movies can be accessed: http://proba2.oma.be/ssa
This page also lists the recorded flaring events.
A weekly overview movie can be found here (SWAP week 476). http://proba2.oma.be/swap/data/mpg/movies/weekly_movies/weekly_movie_2019_05_06.mp4
Details about some of this week's events, can be found further below.
If any of the linked movies are unavailable they can be found in the P2SC movie repository here http://proba2.oma.be/swap/data/mpg/movies/
Monday May 06
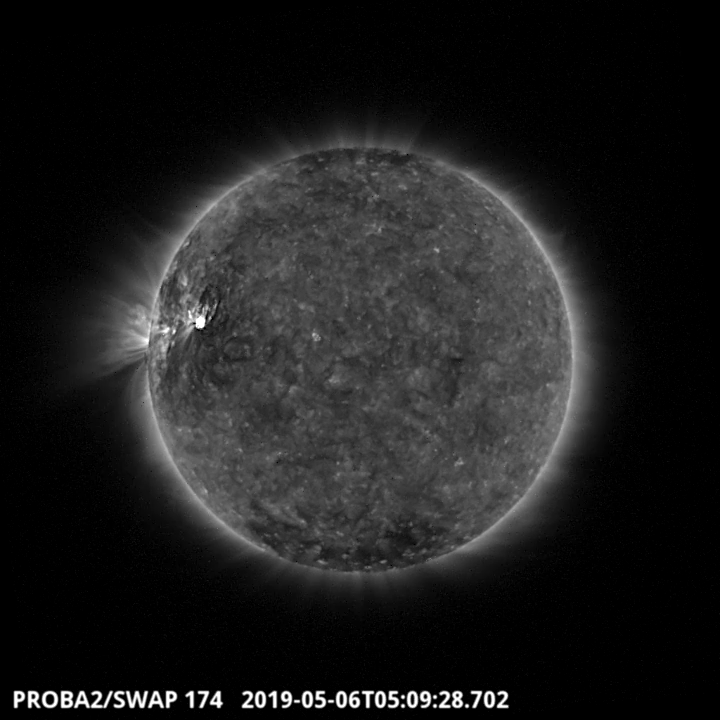
The solar activity of the week was dominated by the flares of the NOAA 2740 sunspots group located on the North-East part of the Sun. The largest flare of the ten C flares, a C9.9, erupted around 05:09 UT. It is visible on the SWAP image above. Find a movie of the events here (SWAP movie) http://proba2.oma.be/swap/data/mpg/movies/20190506_swap_movie.mp4
Thursday May 09
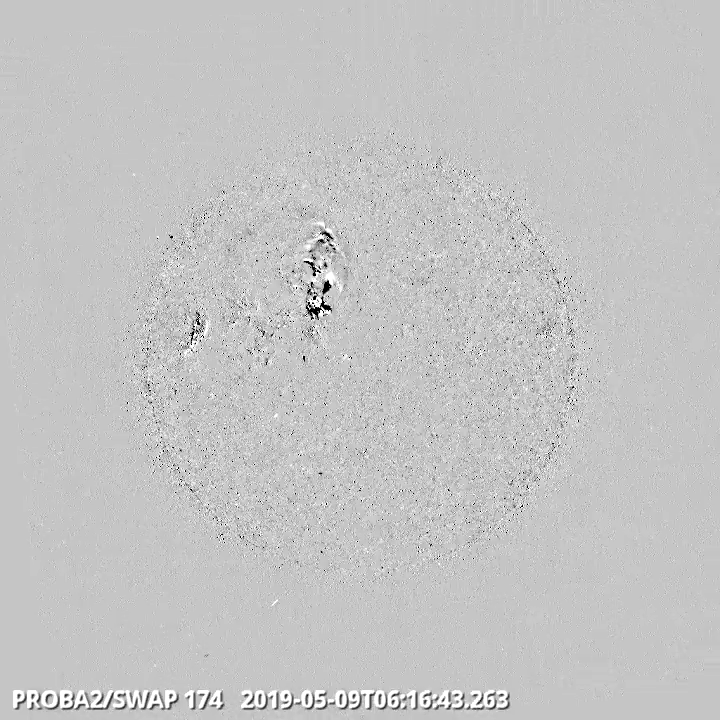
The NOAA 2740 sunspots group has produced a C6.7 flare peaking at 5:51 UT which is nicely visible on the SWAP difference image above. Find a movie of the events here (SWAP difference movie) http://proba2.oma.be/swap/data/mpg/movies/20190509_swap_diff.mp4
Review of solar activity
Solar activity was dominated by Catania group 16 (NOAA AR 2740). It produced several B and 10 C class flares of which the strongest a C9.9 flare peaking at 5:10UT May 6. Towards the end of the week the region was decaying and became inactive. Catania group 17 (NOAA AR 2741) rotated on the solar disk on May 6 and was present for the whole week, but remained inactive.
Several CME's were related to the activity from Catania group 16 (NOAA AR 2740) and with the region being located close to disk centre, some of these were Earth-directed.
A CME that was directed to the North-East, had an faint South-West halo component as seen in SOHO LASCO C2 images from May 6, 23:12UT. We expected that the CME would arrive at Earth on May 10, 15:00UT.
Earth perspective, animated gif:

STEREO A perspective, animated gif:

On May 10, two small filaments near AR 2740, near the disk centre erupted. The STEREO chronograph captured two clear CMEs. The SOHO LASCO C2 chronograph, i.e. Earth's viewpoint, captured a faint partial halo CME on May 11. We expected the CME to arrive at Earth not before May 15, 2:00UT.
Earth perspective, animated gif:

STEREO A perspective:
Solar proton flux levels were at background values.
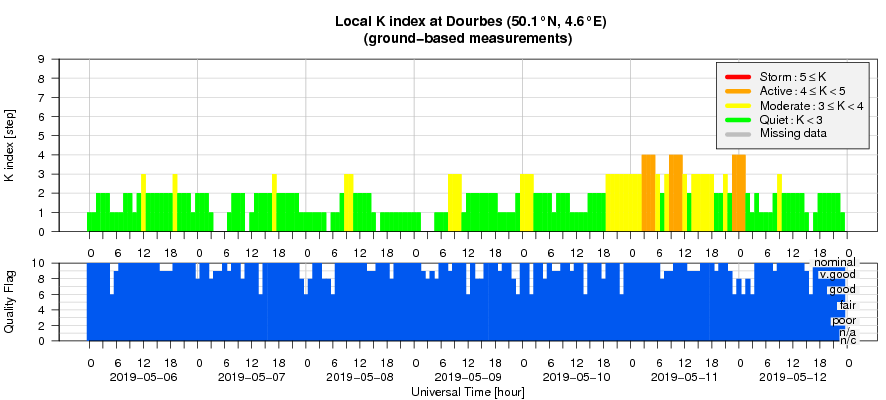
Review of geomagnetic activity
Solar wind returned at the beginning of the week to nominal conditions after last weeks enhancements under coronal hole influences.
On May 9, the wind stream from a small negative polarity coronal hole passed the L1 point.
On May 10, 16:55UT a weak shock was seen in solar wind data marking the arrival of the May 6 CME. The solar wind speed jumped from 340km/s to 380 km/s, the total magnetic field increased from under 5nT to almost 9 nT. With the CME passage over the course of May 11-12, the total magnetic field reached further to 12.5nT with Bz pronounced negative over more than 24 hours, reaching down to a peak of -11.5nT.
Geomagnetic conditions were quiet to unsettled most of the week but reached active (K Dourbes 4) and minor geomagnetic storm (NOAA Kp 5) levels on May 11 with the CME passage.
The International Sunspot Number by SILSO
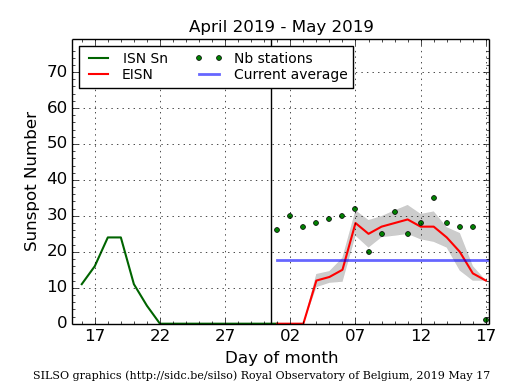
The daily Estimated International Sunspot Number (EISN, red curve with shaded error) derived by a simplified method from real-time data from the worldwide SILSO network. It extends the official Sunspot Number from the full processing of the preceding month (green line). The plot shows the last 30 days (about one solar rotation). The horizontal blue line shows the current monthly average, while the green dots give the number of stations included in the calculation of the EISN for each day.
Geomagnetic Observations at Dourbes (6 May 2019 - 12 May 2019)
The SIDC space weather Briefing
The Space Weather Briefing presented by the forecaster on duty from May 6 to 12. It reflects in images and graphs what is written in the Solar and Geomagnetic Activity report.
The pdf-version: http://www.stce.be/briefings/20190513_SWbriefing.pdf
The automatically running presentation: http://www.stce.be/briefings/20190513_SWbriefing.ppsm
Review of ionospheric activity (6 May 2019 - 12 May 2019)
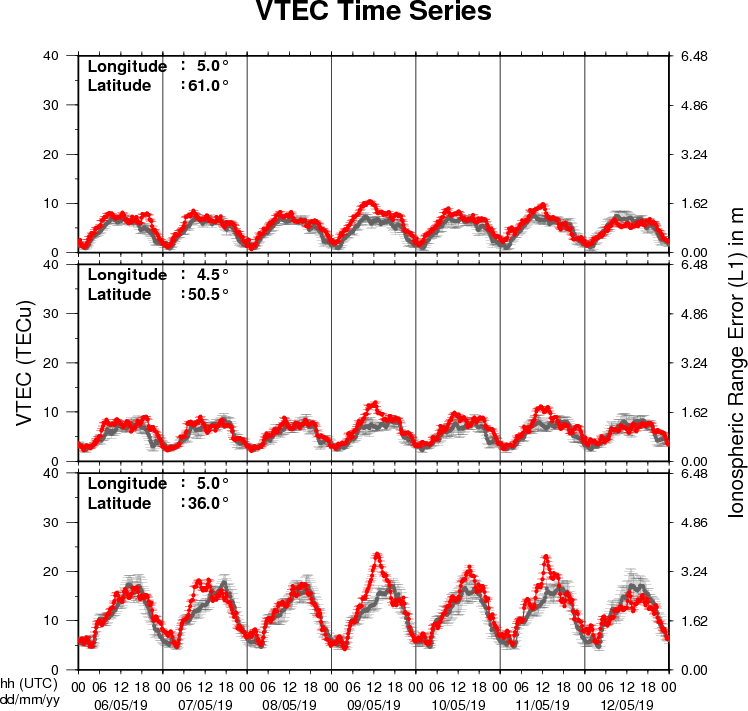
The figure shows the time evolution of the Vertical Total Electron Content (VTEC) (in red) during the last week at three locations:
a) in the northern part of Europe(N61°, 5°E)
b) above Brussels(N50.5°, 4.5°E)
c) in the southern part of Europe(N36°, 5°E)
This figure also shows (in grey) the normal ionospheric behaviour expected based on the median VTEC from the 15 previous days.
The VTEC is expressed in TECu (with TECu=10^16 electrons per square meter) and is directly related to the signal propagation delay due to the ionosphere (in figure: delay on GPS L1 frequency).
The Sun's radiation ionizes the Earth's upper atmosphere, the ionosphere, located from about 60km to 1000km above the Earth's surface.The ionization process in the ionosphere produces ions and free electrons. These electrons perturb the propagation of the GNSS (Global Navigation Satellite System) signals by inducing a so-called ionospheric delay.
See http://stce.be/newsletter/GNSS_final.pdf for some more explanations ; for detailed information, see http://gnss.be/ionosphere_tutorial.php