- Table of Content
- 1.Counting down ...
- 2.Review of sola...
- 3.PROBA2 Observa...
- 4.The Internatio...
- 5.Geomagnetic Ob...
- 6.The SIDC space...
- 7.Review of iono...
2. Review of solar and geomagnetic activity
3. PROBA2 Observations (20 May 2019 - 26 May 2019)
4. The International Sunspot Number by SILSO
5. Geomagnetic Observations at Dourbes (20 May 2019 - 26 May 2019)
6. The SIDC space weather Briefing
7. Review of ionospheric activity (20 May 2019 - 26 May 2019)
Counting down until the STCE annual meeting on June 6
This years meeting focusses on PECASUS and the collaboration between the 3 sister institutes, BIRA-IASB, RMI and ROB. We welcome also people from outside the plateau, people representing organisations with an interest in space weather, space weather services and aviation.
The doors of the Meridian Room open at 9:30, we start at 10:00 and entertain you until 13:00. At that time, we move to the RMI kanteen for a vegetarian lunch, our contribution to 'Action for Climate'.
More on the program: https://events.oma.be/indico/event/64/
Looking forward to meet you - in less then 8 days!

Review of solar and geomagnetic activity
Solar activity
Solar activity was very low. No flares were recorded and the solar disk was spotless.
No Earth-directed coronal mass ejections (CMEs) were observed with the LASCO coronagraph. Although, a slow Earth directed CME was observed in STEREO-A COR2 on May 22.
The greater than 10 MeV proton flux was at nominal levels.
Geomagnetic activity
Solar wind parameters were at nominal levels for most of the week. DSCOVR at the L1 point recorded a maximum solar wind speed of 450 km/s on May 21 before decreasing to remain below 400 km/s for the rest of the week. The total magnetic field strength reached a maximum of around 9 nT on May 20. The Bz component ranged between approximately -6.3 and +7.7 nT over the week.
The solar wind became slightly more disturbed from 21:00 UT May 26 onwards. This is possibly linked to the slow CME observed in STEREO-A COR2 on May 22.
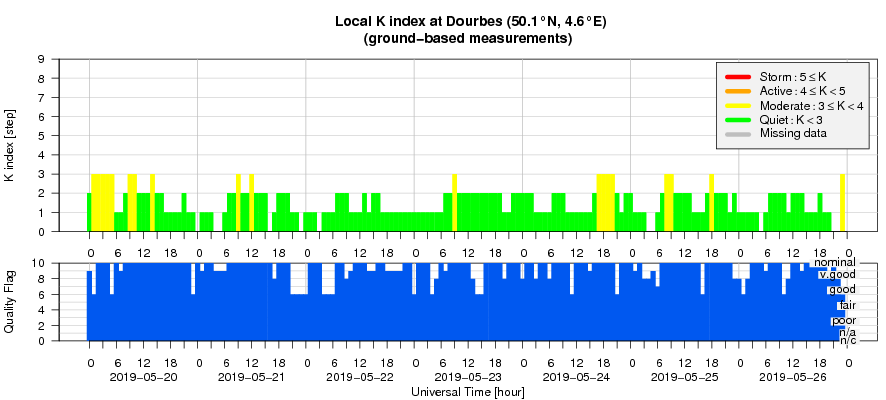
The geomagnetic conditions were quiet to unsettled over the week. The local K index (Dourbes) the planetary K index (NOAA) both ranged between 0-3.
PROBA2 Observations (20 May 2019 - 26 May 2019)
Solar Activity
Solar flare activity was very low during the week.
In order to view the activity of this week in more detail, we suggest to go to the following website from which all the daily (normal and difference) movies can be accessed: http://proba2.oma.be/ssa
This page also lists the recorded flaring events.
A weekly overview movie can be found here (SWAP week 478).
http://proba2.oma.be/swap/data/mpg/movies/weekly_movies/weekly_movie_2019_05_20.mp4
Details about some of this week's events, can be found further below.
If any of the linked movies are unavailable they can be found in the P2SC movie repository here
http://proba2.oma.be/swap/data/mpg/movies/
Monday May 20
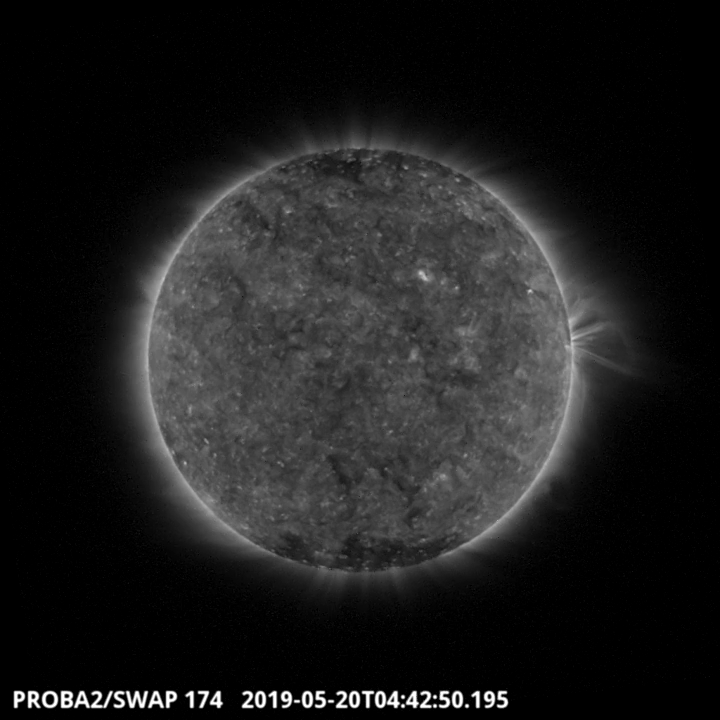
An extension of the southern polar coronal hole transited the solar meridian on 2019-May-20 around 04:43 UT and is visible in the SWAP image above. Find a movie of the events here (SWAP movie) http://proba2.oma.be/swap/data/mpg/movies/20190520_swap_movie.mp4
Sunday May 26
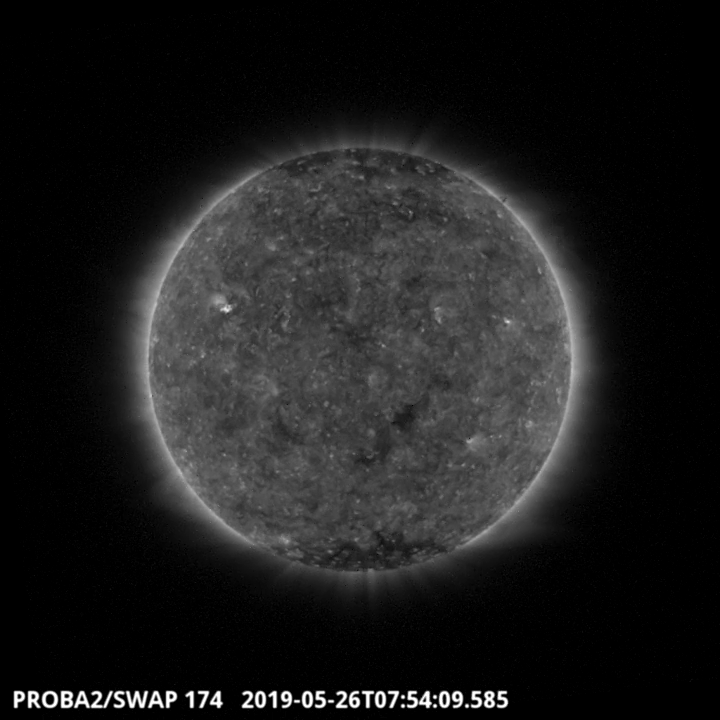
A patchy coronal hole in the South part of the Sun transited the solar meridian on 2019-May-26 around 07:54 UT and is visible in the SWAP image above. Find a movie of the events here (SWAP movie) http://proba2.oma.be/swap/data/mpg/movies/20190526_swap_movie.mp4
The International Sunspot Number by SILSO
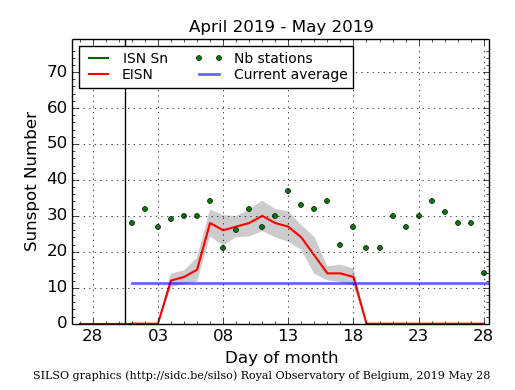
The daily Estimated International Sunspot Number (EISN, red curve with shaded error) derived by a simplified method from real-time data from the worldwide SILSO network. It extends the official Sunspot Number from the full processing of the preceding month (green line). The plot shows the last 30 days (about one solar rotation). The horizontal blue line shows the current monthly average, while the green dots give the number of stations included in the calculation of the EISN for each day.
Geomagnetic Observations at Dourbes (20 May 2019 - 26 May 2019)
The SIDC space weather Briefing
The Space Weather Briefing presented by the forecaster on duty from May 20 to 26. It reflects in images and graphs what is written in the Solar and Geomagnetic Activity report.
The pdf-version: http://www.stce.be/briefings/20190527_SWbriefing.pdf
The automatically running presentation: http://www.stce.be/briefings/20190527_SWbriefing.ppsm
Review of ionospheric activity (20 May 2019 - 26 May 2019)
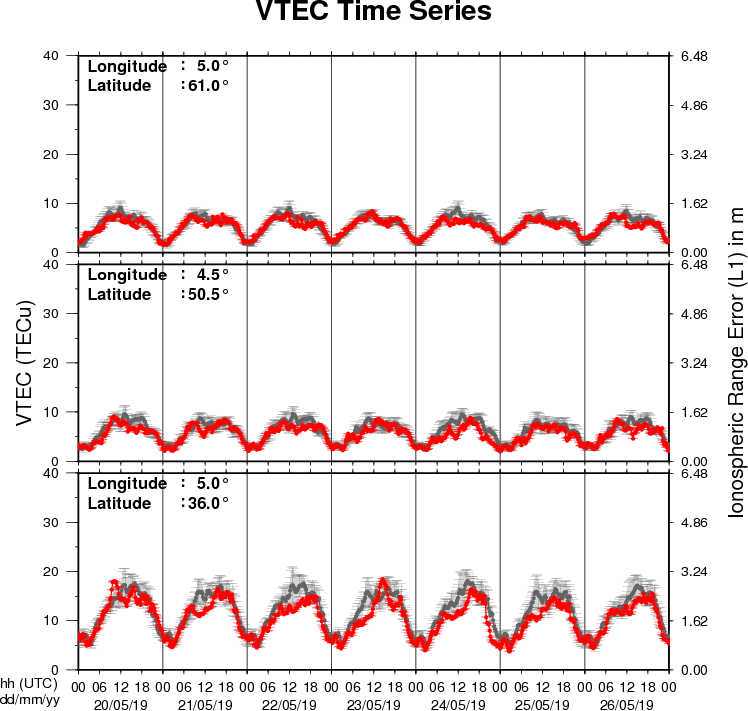
The figure shows the time evolution of the Vertical Total Electron Content (VTEC) (in red) during the last week at three locations:
a) in the northern part of Europe(N61°, 5°E)
b) above Brussels(N50.5°, 4.5°E)
c) in the southern part of Europe(N36°, 5°E)
This figure also shows (in grey) the normal ionospheric behaviour expected based on the median VTEC from the 15 previous days.
The VTEC is expressed in TECu (with TECu=10^16 electrons per square meter) and is directly related to the signal propagation delay due to the ionosphere (in figure: delay on GPS L1 frequency).
The Sun's radiation ionizes the Earth's upper atmosphere, the ionosphere, located from about 60km to 1000km above the Earth's surface.The ionization process in the ionosphere produces ions and free electrons. These electrons perturb the propagation of the GNSS (Global Navigation Satellite System) signals by inducing a so-called ionospheric delay.
See http://stce.be/newsletter/GNSS_final.pdf for some more explanations ; for detailed information, see http://gnss.be/ionosphere_tutorial.php