- Table of Content
- 1.ESWW2019 - pos...
- 2.PROBA2 Observa...
- 3.Review of sola...
- 4.The Internatio...
- 5.Review of geom...
- 6.Geomagnetic Ob...
- 7.Review of iono...
2. PROBA2 Observations (3 Jun 2019 - 9 Jun 2019)
3. Review of solar activity (3 Jun 2019 - 9 Jun 2019
4. The International Sunspot Number by SILSO
5. Review of geomagnetic activity
6. Geomagnetic Observations at Dourbes (3 Jun 2019 - 9 Jun 2019)
7. Review of ionospheric activity (3 Jun 2019 - 9 Jun 2019)
ESWW2019 - poster contest
This is your chance to win a free ticket for ESWW2019
This is your chance to cheer up the ESWW2019 website, ESWW2019 banner, ESWW2019 presentations.
This is your chance to see your design forever linked to ESWW2019
The ESWW16 poster contest assignment is to make a design in the theme Space Weather Services.
How to participate?
Very simple: send your Space Weather Services design before September 15 to the STCE LOC: esww.loc@stce.be. We need only a picture/image/cartoon/ ... no text. If your design wins, you should be able to hand it over with a minimum resolution of 150dpi and suitable A4 sheet.
The STCE LOC is the jury
The jury will check if the link with the theme Space Weather Services is clear. Originality and creativity are also taken into account.
When will the winner be announced?
As soon as the jury has reached a verdict, the winner shall be informed. An official announcement will appear on the front page of the ESWW16 website. This is foreseen by end September.
Why this contest?
Since 2006, each European Space Weather Week had a theme picture. The esww13 conference dinner contest proved there was a lot of talent in the space weather community. We wanted to further explore these talents and creativity. From ESWW14, we introduced a design competition. This is already the third competition.
Past designs
The winner of ESWW14 was Christina Planaiki.
The winner of ESWW15 was Erika Palmerio.
Check the previous designs
All info on the website: http://www.stce.be/esww2019/postercontest.php
PROBA2 Observations (3 Jun 2019 - 9 Jun 2019)
Solar Activity
Solar flare activity fluctuated was very low during the week.
In order to view the activity of this week in more detail, we suggest to go to the following website from which all the daily (normal and difference) movies can be accessed: http://proba2.oma.be/ssa
This page also lists the recorded flaring events.
A weekly overview movie can be found here (SWAP week 480).
http://proba2.oma.be/swap/data/mpg/movies/weekly_movies/weekly_movie_2019_06_03.mp4
Details about some of this week's events, can be found further below.
If any of the linked movies are unavailable they can be found in the P2SC movie repository here
http://proba2.oma.be/swap/data/mpg/movies/
Monday Jun 03
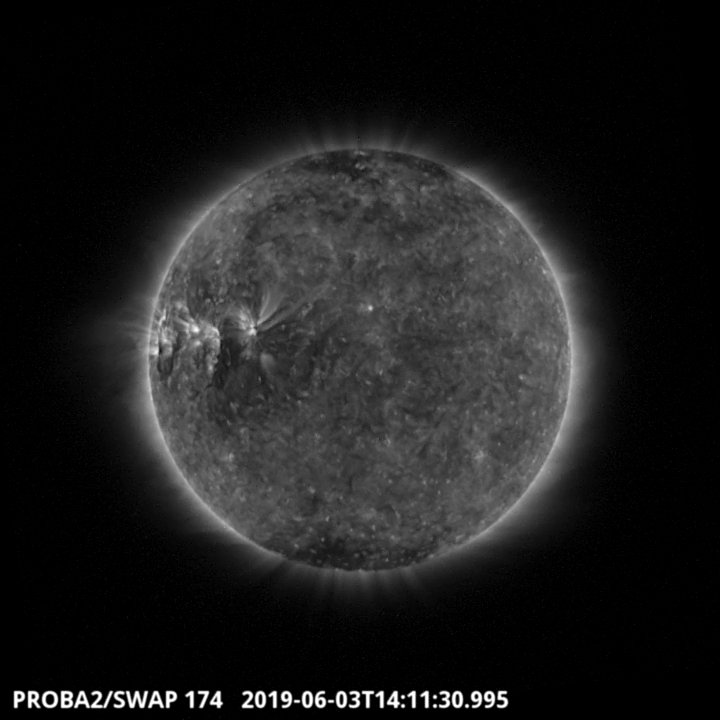
A simple magnetic structure rotated from the Eastern hemisphere into the western hemisphere throughout the week. It is visible in the Eastern hemisphere in the SWAP image above. Find a movie of the events here (SWAP movie) http://proba2.oma.be/swap/data/mpg/movies/weekly_movies/weekly_movie_2019_06_03.mp4
Sunday Jun 09
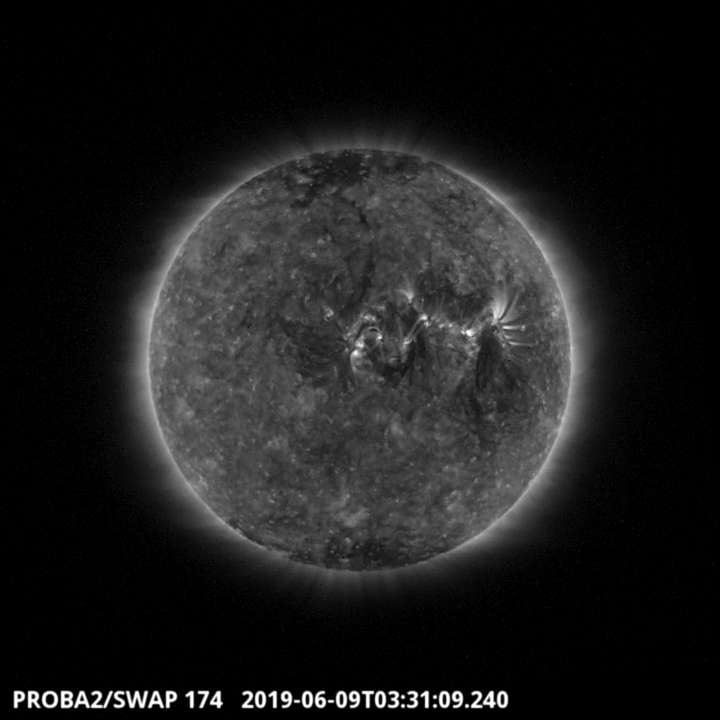
An extension of the northern polar coronal hole transited the solar meridian on 2019-Jun-09 and is visible in the SWAP image above. Find a movie of the events here (SWAP movie)
http://proba2.oma.be/swap/data/mpg/movies/20190609_swap_movie.mp4
Review of solar activity (3 Jun 2019 - 9 Jun 2019
Solar activity has been quiet.
The solar disk
The X-ray flux remained at background levels, and the visible solar disc was spotless. EUV imagery revealed a simple magnetic structure that rotated from the Eastern hemisphere into the western hemisphere.
Coronal Mass Ejections
Two Coronal Mass Ejections (CMEs) were seen last week, the first on 03-Jun-2019 and the second on 08-Jun-2019. Neither CME was visible in LASCO (Earth orientated) imagery, but both were visible in STEREO-A COR Coronagraph imagery (STEREO A is located near the L5 point).
The first CME moved along the Sun-Earth line with a speed of approximately 210 km/s, and was anticipated to interact with the Earth system late on 07-Jun-2019.
The second CME was produced from a small filament eruption at approximately 23:00 UT on 08-Jun-2019, with the main body of the CME travelling south of the Sun-Earth line with a velocity of 390 km/s. Due to its size and direction of propagation the CME is expected to have minimal impact on the geomagnetic environment.
Solar proton flux near Earth
The greater than 10 MeV proton flux was at nominal levels throughout the week.
The International Sunspot Number by SILSO
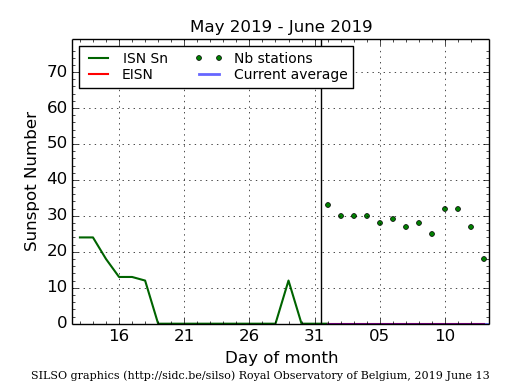
The daily Estimated International Sunspot Number (EISN, red curve with shaded error) derived by a simplified method from real-time data from the worldwide SILSO network. It extends the official Sunspot Number from the full processing of the preceding month (green line). The plot shows the last 30 days (about one solar rotation). The horizontal blue line shows the current monthly average, while the green dots give the number of stations included in the calculation of the EISN for each day.
Review of geomagnetic activity
Solar Wind
The solar wind conditions were at background levels for the majority of last week, but were enhanced on 08-Jun-2019 due to the arrival of an ICME (the 03-Jun-2019 CME). The total magnetic field strength increased to 19 nT peaking at 15.00 UT on 08-Jun-2019. The Bz component fluctuated between -17.0 and 15.0 nT.
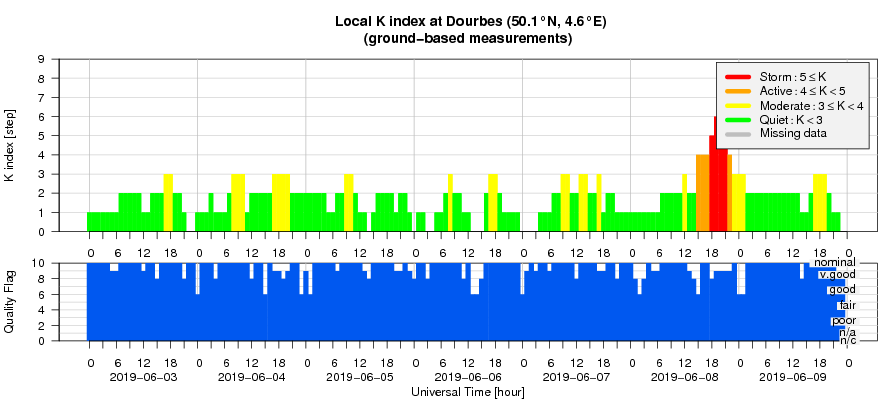
Geomagnetic response to the solar wind
Geomagnetic conditions fluctuated between Kp index 2-5 (NOAA) and local K index 1-6 (Dourbes), reaching moderate storm levels at around 18:00 UT (8-Jun-2019). The enhanced geomagnetic conditions were created by the arrival of the aforementioned CME but were possibly enhanced by a HSS created by a small low latitude corona hole. The conditions subsequently abated and returned to background levels.
Geomagnetic Observations at Dourbes (3 Jun 2019 - 9 Jun 2019)
Review of ionospheric activity (3 Jun 2019 - 9 Jun 2019)
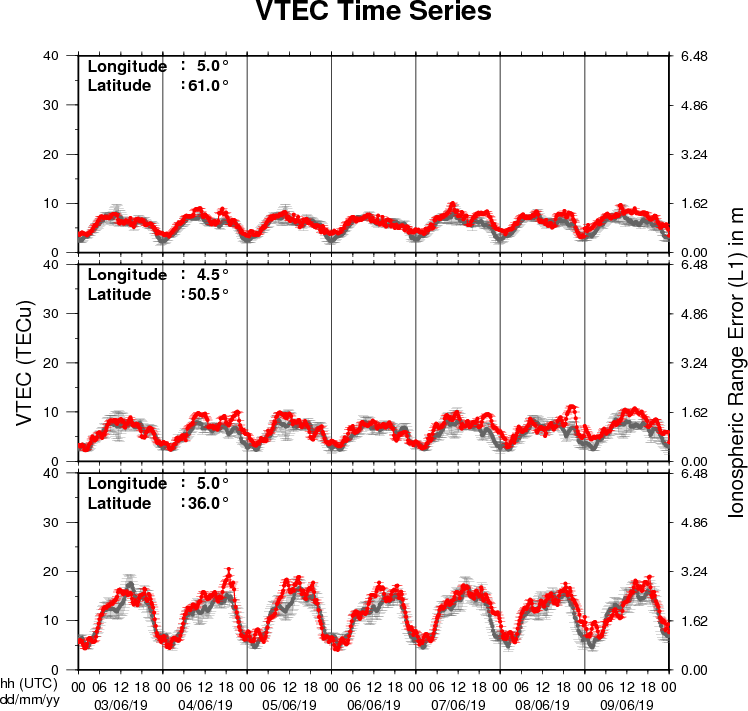
The figure shows the time evolution of the Vertical Total Electron Content (VTEC) (in red) during the last week at three locations:
a) in the northern part of Europe(N61°, 5°E)
b) above Brussels(N50.5°, 4.5°E)
c) in the southern part of Europe(N36°, 5°E)
This figure also shows (in grey) the normal ionospheric behaviour expected based on the median VTEC from the 15 previous days.
The VTEC is expressed in TECu (with TECu=10^16 electrons per square meter) and is directly related to the signal propagation delay due to the ionosphere (in figure: delay on GPS L1 frequency).
The Sun's radiation ionizes the Earth's upper atmosphere, the ionosphere, located from about 60km to 1000km above the Earth's surface.The ionization process in the ionosphere produces ions and free electrons. These electrons perturb the propagation of the GNSS (Global Navigation Satellite System) signals by inducing a so-called ionospheric delay.
See http://stce.be/newsletter/GNSS_final.pdf for some more explanations ; for detailed information, see http://gnss.be/ionosphere_tutorial.php