- Table of Content
- 1.Whereabouts of...
- 2.The STCE in 20...
- 3.Review of sola...
- 4.PROBA2 Observa...
- 5.The Internatio...
- 6.Geomagnetic Ob...
- 7.The SIDC space...
- 8.Review of iono...
2. The STCE in 2017
3. Review of solar and geomagnetic activity
4. PROBA2 Observations (10 Jun 2019 - 16 Jun 2019)
5. The International Sunspot Number by SILSO
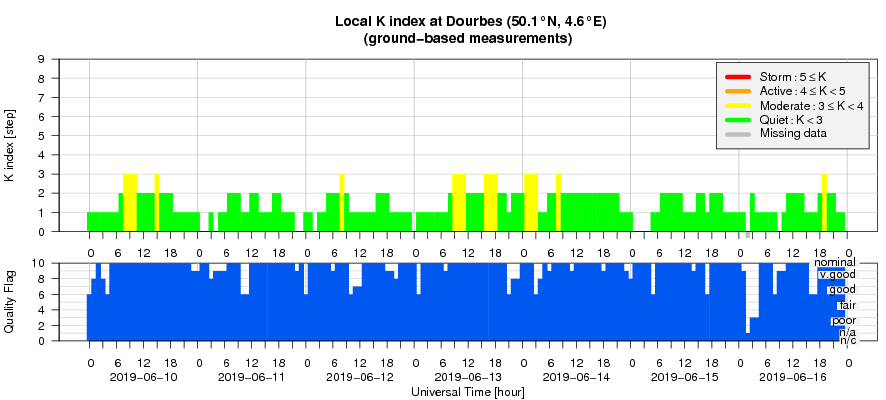
6. Geomagnetic Observations at Dourbes (10 Jun 2019 - 16 Jun 2019)
7. The SIDC space weather Briefing
8. Review of ionospheric activity (10 Jun 2019 - 16 Jun 2019)
Whereabouts of the ISS
Where was the ISS on June 17, 13:47UT?
The USET telescope in Ukkel spotted the International Space Station (ISS) at that time just in front of the Sun. The presence of the ISS was confirmed in white light and the Calcium line. It took the ISS 0.57 sec to transit the solar surface! Luckily, speed limitation is an unknown concept in space.
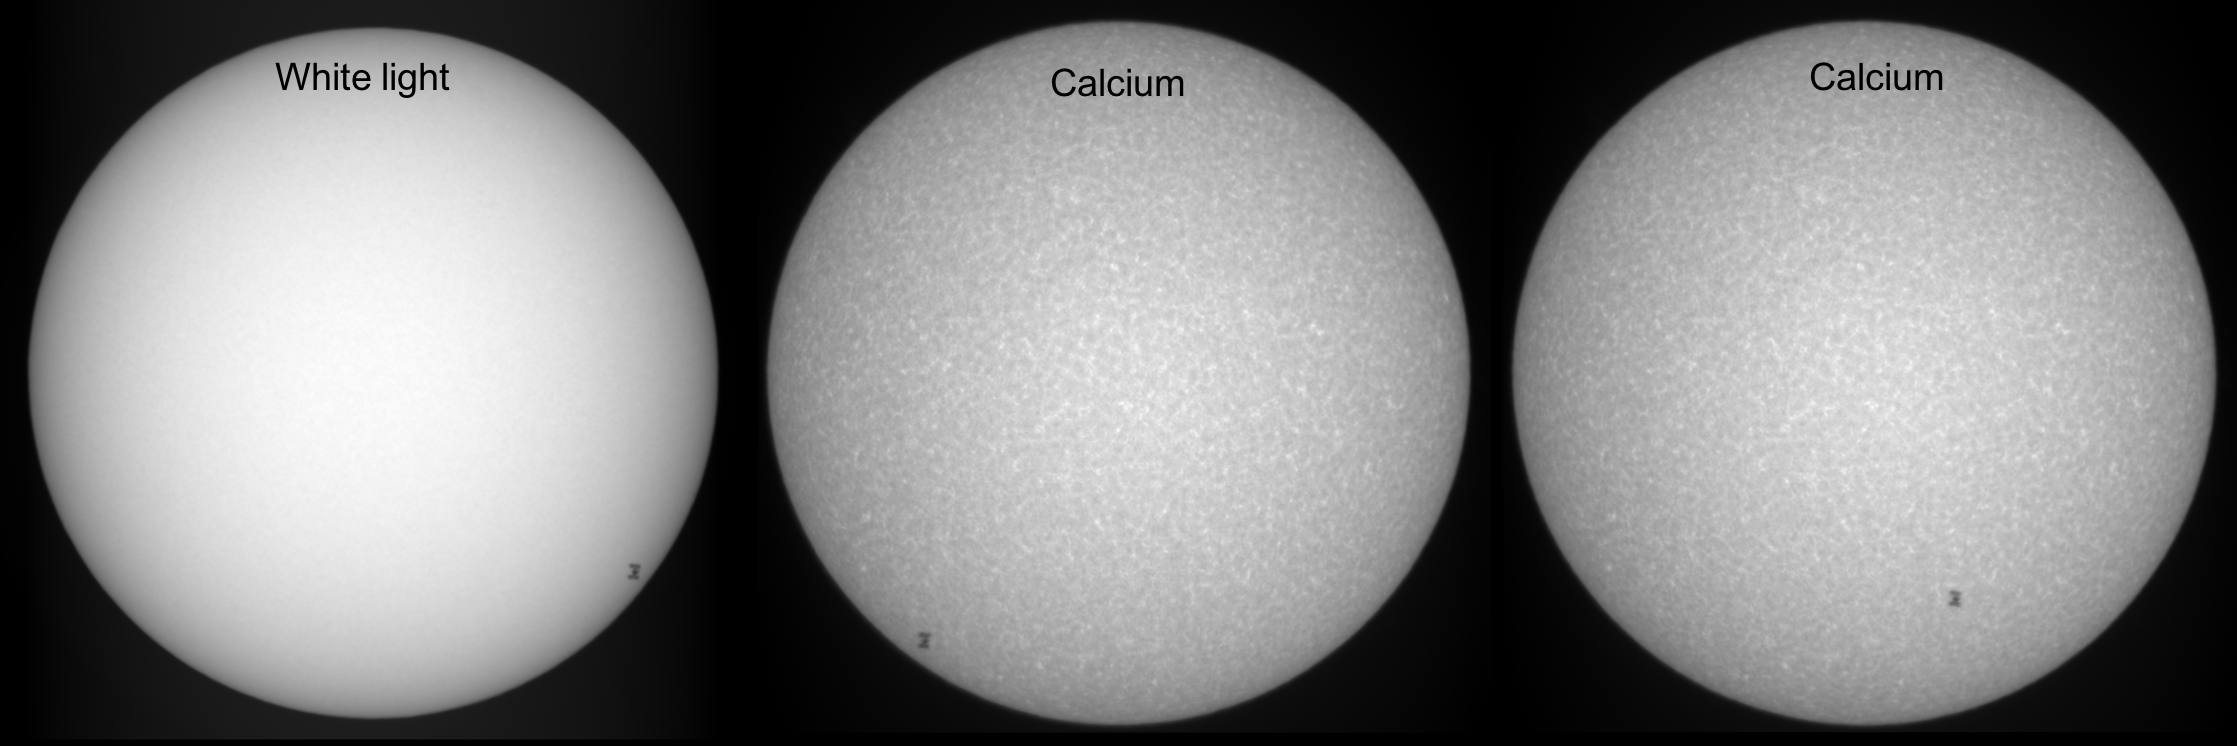
USET stands for 'Uccle Solar Equatorial Table'. The USET telescopes are observing from Ukkel. We call them the Earth's surface and can see the Sun only during day time and when no clouds are obstructing the view. 4 telescopes are placed on the table. They keep track of the Sun in visible light (2x), in H-alpha, in Calcium II. Visible light is the light that the human eye can see and has all the colours of the rainbow. The Calcium line comes from the blue part of the visible light. H-alpha is a red line. Nevertheless, the pictures above are grey, white, black. We didn't put a colour on it.
The STCE in 2017
The STCE Annual Report 2017 is now available at http://www.stce.be/annualReport
It is a compilation of the activities done in 2017 within the frame of the Solar-Terrestrial Centre of Excellence (STCE). This report continues the style from the previous editions. Hence, as it is targeting a more general public, it presents only a selection of the 2017-activities in easy-to-digest summaries.
These bite-sized articles emphasize the intense collaboration between the institutes at the Space Pole, as well as with our external partners. It covers e.g. the monitoring of the travelling ionospheric disturbances, the creation of the Space Weather Introductory Course, research results on the plasmasphere,... amongst many other topics. But also for those who want to know how the honey bees were doing in the ROB garden, or all the fuzz about the UFO that landed next to the ROB's canteen, or the source behind the Blood Sun on 16-17 October 2017,... this annual report offers a glimpse on the life at the Space Pole.
We wish you an enjoyable reading experience!
Review of solar and geomagnetic activity
SOLAR ACTIVITY
Solar activity was at very low levels. The Sun has been spotless since 30 May (SILSO). This ongoing spotless stretch of already 19 consecutive days is the longest one so far this solar cycle minimum.
No earth-directed coronal mass ejections (CMEs) were observed.
The greater than 10 MeV proton flux was at nominal levels.
A diffuse and patchy negative polarity CH transited the CM from late on 12 till 16 June.
GEOMAGNETIC ACTIVITY
The earth environment was dominated by the solar wind stream from the positive polarity coronal hole (CH) which arrived at 12 June. Solar wind speed gradually increased from 300 to near 500 km/s on 14 June, ending the period near 330 km/s (DSCOVR). Bz varied between -7 and +7 nT. The direction of the IMF switched from towards (negative sector) to mostly away from the Sun (positive sector) early on 12 June. Before 12 and after 15 June, the solar wind was at nominal levels.
Quiet to unsettled geomagnetic conditions were observed throughout the week (Kp and K Dourbes), with a single active episode for the Kp-index late on 13 June.
PROBA2 Observations (10 Jun 2019 - 16 Jun 2019)
Solar Activity
Solar flare activity remained very low during the week.
In order to view the activity of this week in more detail, we suggest to go to the following website from which all the daily (normal and difference) movies can be accessed: http://proba2.oma.be/ssa
This page also lists the recorded flaring events.
A weekly overview movie can be found here (SWAP week 481): http://proba2.oma.be/swap/data/mpg/movies/weekly_movies/weekly_movie_2019_06_10.mp4
Details about some of this week’s events, can be found further below.
If any of the linked movies are unavailable they can be found in the P2SC movie repository here: http://proba2.oma.be/swap/data/mpg/movies/
Sunday Jun 16
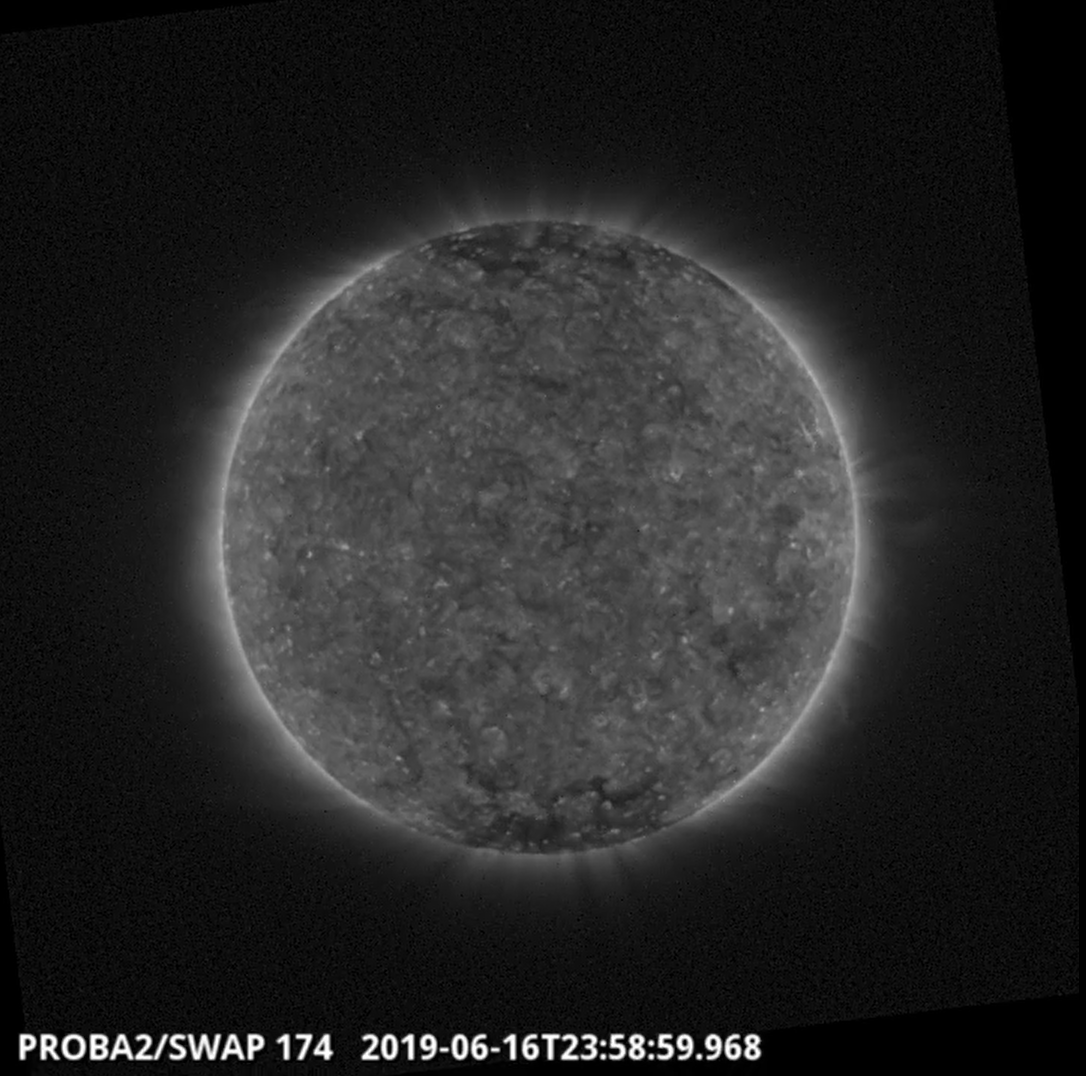
No significant flares were recorded over the week and the quiet Sun in the SWAP image above shows the solar disk has no current active regions. In fact as of 2019-Jun-16 the visible disk has been spotless for 18 consecutive days (SILSO).
The International Sunspot Number by SILSO
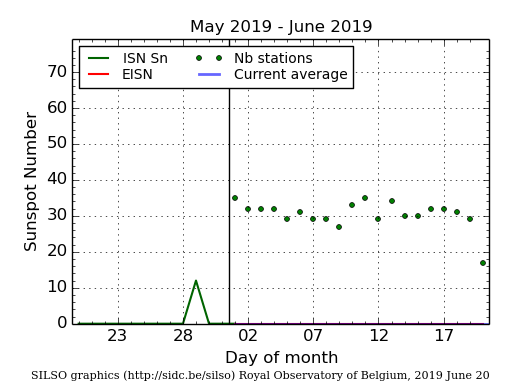
The daily Estimated International Sunspot Number (EISN, red curve with shaded error) derived by a simplified method from real-time data from the worldwide SILSO network. It extends the official Sunspot Number from the full processing of the preceding month (green line). The plot shows the last 30 days (about one solar rotation). The horizontal blue line shows the current monthly average, while the green dots give the number of stations included in the calculation of the EISN for each day.
Geomagnetic Observations at Dourbes (10 Jun 2019 - 16 Jun 2019)
The SIDC space weather Briefing
The Space Weather Briefing presented by the forecaster on duty from June 10 to 16. It reflects in images and graphs what is written in the Solar and Geomagnetic Activity report.
The pdf-version: http://www.stce.be/briefings/20190617_SWbriefing.pdf
The automatically running presentation: http://www.stce.be/briefings/20190617_SWbriefing.ppsm
Review of ionospheric activity (10 Jun 2019 - 16 Jun 2019)
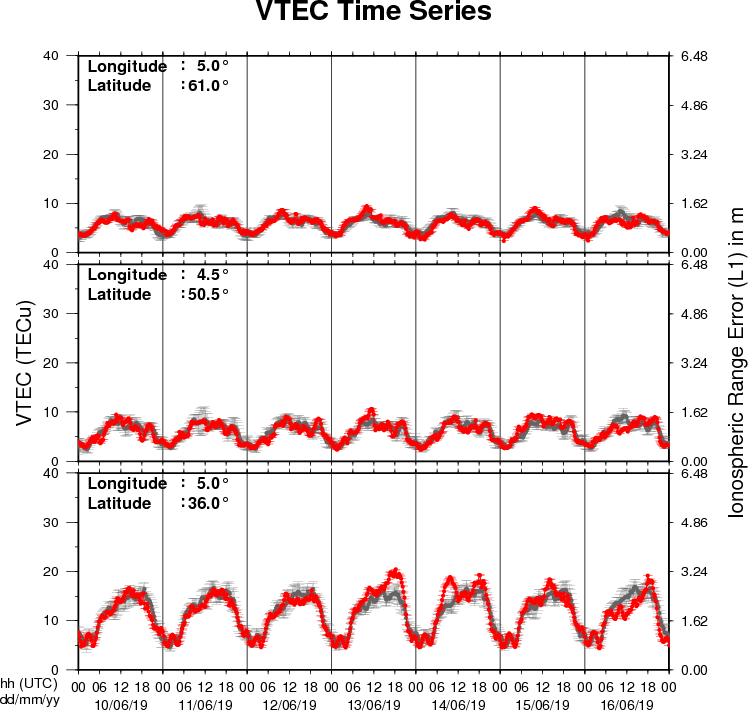
The figure shows the time evolution of the Vertical Total Electron Content (VTEC) (in red) during the last week at three locations:
a) in the northern part of Europe(N61°, 5°E)
b) above Brussels(N50.5°, 4.5°E)
c) in the southern part of Europe(N36°, 5°E)
This figure also shows (in grey) the normal ionospheric behaviour expected based on the median VTEC from the 15 previous days.
The VTEC is expressed in TECu (with TECu=10^16 electrons per square meter) and is directly related to the signal propagation delay due to the ionosphere (in figure: delay on GPS L1 frequency).
The Sun's radiation ionizes the Earth's upper atmosphere, the ionosphere, located from about 60km to 1000km above the Earth's surface.The ionization process in the ionosphere produces ions and free electrons. These electrons perturb the propagation of the GNSS (Global Navigation Satellite System) signals by inducing a so-called ionospheric delay.
See http://stce.be/newsletter/GNSS_final.pdf for some more explanations ; for detailed information, see http://gnss.be/ionosphere_tutorial.php