- Table of Content
- 1.Fair space wea...
- 2.Review of sola...
- 3.PROBA2 Observa...
- 4.The Internatio...
- 5.Review of geom...
- 6.Geomagnetic Ob...
- 7.The SIDC Space...
- 8.Review of iono...
2. Review of solar activity
3. PROBA2 Observations (15 Jul 2019 - 21 Jul 2019)
4. The International Sunspot Number
5. Review of geomagnetic activity
6. Geomagnetic Observations at Dourbes (15 Jul 2019 - 21 Jul 2019)
7. The SIDC Space Weather Briefing
8. Review of ionospheric activity (15 Jul 2019 - 21 Jul 2019)
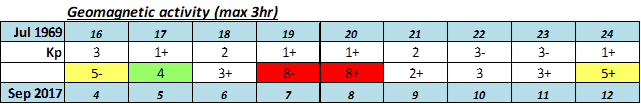
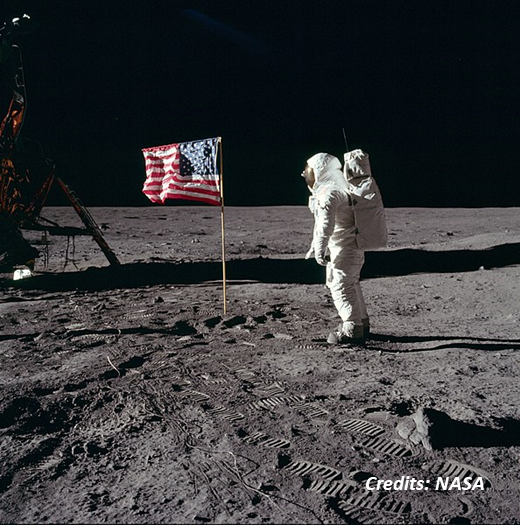
Fair space weather for the Apollo 11 mission
The Apollo 11 mission took place in 1969, during the maximum of solar cycle 20 (SC20). That maximum was stronger than the one of the current, nearly finished, solar cycle 24 (SC24). Thus, it might be worthwhile to take a look at the space weather conditions during the 16-24 July flight to and back from the Moon, and evaluate the associated risks to which the astronauts were exposed. Solar activity, geomagnetic activity, and particle radiation environment will be considered. To put things a bit in perspective, a comparison will be made with one of the more active periods during SC24, i.e. from 4 till 12 September 2017 (bottom lines of each table).
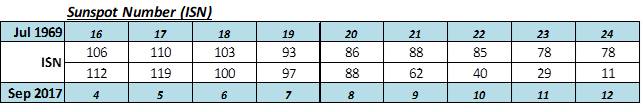
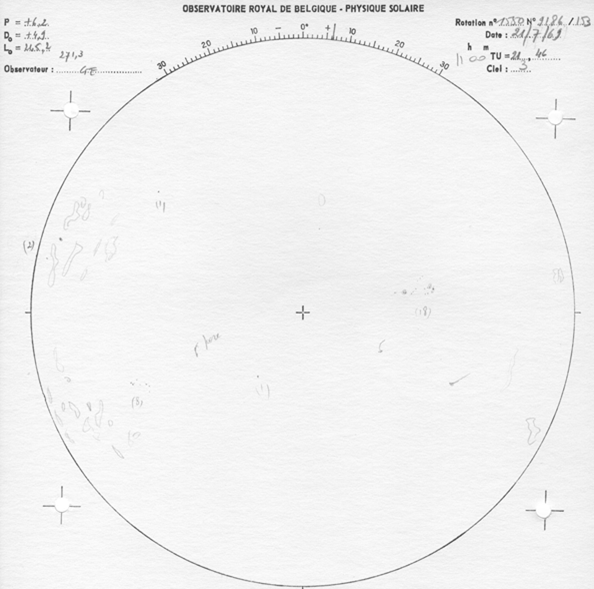
To evaluate solar activity, the obvious start is to take a look at the international sunspot number (ISN, as determined by SILSO - http://sidc.be/silso/ ). SC20 reached a smoothed maximum of 156.6 in November 1968, and the monthly sunspot number in July 1969 was still at 137.1. However, during the 8 days of the Apollo 11 mission, the daily sunspot number was at the low end, declining from values near 110 to around 80. See the table above, as well as the solar drawing below from the solar telescope at SIDC / USET (http://www.sidc.be/uset/ ) on 21 July 1969, showing only 5 relatively small sunspot groups possessing simple magnetic configurations. These sunspot numbers are fairly similar to the ones from the comparison period in September 2017. In contrast, both at the beginning and the end of July 1969, the ISN reached significantly higher values around 200.
From the numbers, one would expect relatively low solar flare activity. Though there were no GOES spacecraft yet to observe the Sun in x-ray in 1969 -they started in 1976 only-, there were already the SOLRAD satellites (SOLar RADiation - data from NOAA / NGDC at https://www.ngdc.noaa.gov/ ) observing the Sun in the same wavelengths (0.1-0.8 nm) as the GOES spacecraft. At the time, only flares larger than C3 were reported. The table below shows for each day the peak strength of the strongest flare. Clearly, and luckily, the Apollo 11 crew flew during a period of very low to low solar activity. In contrast, the period in September 2017 showed high solar activity with multiple strong flares (an X-class flare is 10 times stronger than an M-class flare, which in turn is 10 times stronger than a C-class flare). This was of course due to the magnetically very complex active region NOAA 2673 (see this STCE Newsitem at http://www.stce.be/news/438/welcome.html for an overview of the activity).

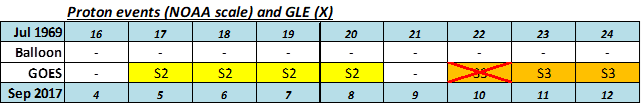
The radiation environment is more difficult to characterize, as -again- no GOES observations were present at that time to keep track of the proton flux. See the STCE Newsitem at http://www.stce.be/news/233/welcome.html for info on intensity and historical strong proton events. Nonetheless, one can get an idea of the proton events from balloon measurements (e.g. Bazilevskaya et al. (2010) at http://adsabs.harvard.edu/abs/2010AdSpR..45..603B ; Table 1 also available at NOAA/NGDC https://www.ngdc.noaa.gov/ ). More importantly, there's the list of Ground level Enhancements (GLE - see STCE Newsitem at http://www.stce.be/news/450/welcome.html ) maintained by the University of Oulu, Finland (https://gle.oulu.fi/#/ ). Putting the data together (table underneath), it appears there were no strong proton events during the Apollo 11 mission and certainly no GLEs.
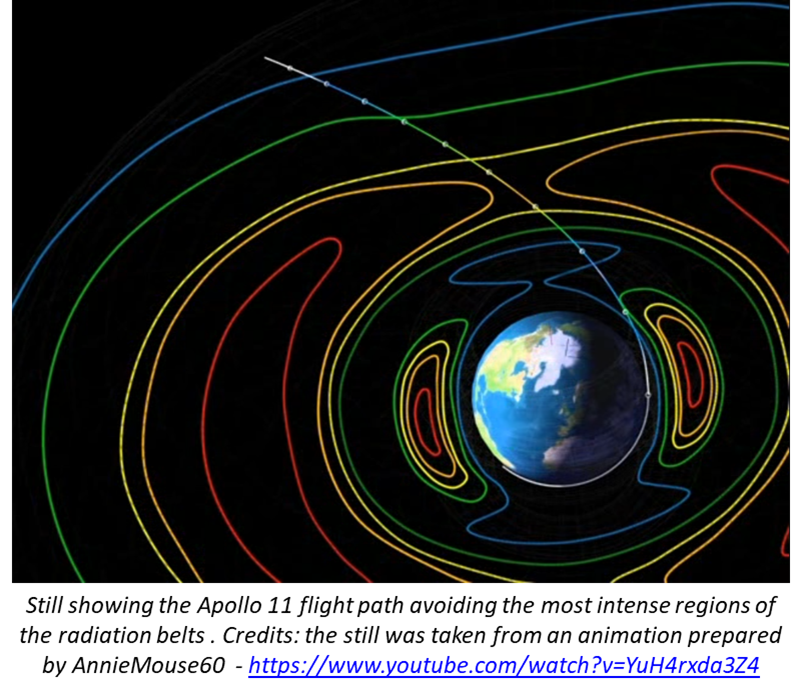
This meant safe conditions for the astronauts, who had to deal already with the Van Allen radiation belts (the trajectory was such that it avoided the most intense parts of these belts - see sketch underneath) and the galactic cosmic rays (GCR), but fortunately, the SC maximum implies lower levels of the harmful GCRs than during SC minimum. A subsequent NASA investigation indicated that "... Radiation doses to Apollo crewmen have been significantly lower than the yearly average of 5 rem set by the U.S. Atomic Energy Commission for workers who use radioactive materials in factories and institutions across the United States. More significantly, Apollo astronaut doses have been negligible in terms of any medical or biological effects that could impair the function of man in the space environment. ..." (English et al., 1973 - https://www.hq.nasa.gov/alsj/tnD7080RadProtect.pdf ). In September 2017, there were a moderate and a strong proton event (see https://www.swpc.noaa.gov/noaa-scales-explanation for the NOAA scales), but in particular the GLE of 10 September might have been cause for some concern, though the intensity of this event is way below the ones of e.g. 24 October 1989 or 14 July 2000, and is simply tiny compared to the monster GLE of 23 February 1956.
In view of the foregoing assessment indicating the low levels of solar activity, one could expect that also geomagnetic activity was low in July 1969. "Geomagnetic" pertains of course to the earth environment, but it is assumed here to be a good proxy for the space environment for the nearby Moon. The values of the Kp-index were taken, as available at the Kyoto World Data Center for Geomagnetism (http://wdc.kugi.kyoto-u.ac.jp/ ). With only quiet to unsettled geomagnetic conditions during the period, there were no threats from this site of space weather activity to the Apollo 11 mission. Of note is the moderately strong geomagnetic storm that took place on 26-27 July, just 2 days after the end of the Apollo mission. The table underneath shows that geomagnetic conditions were quite a bit more enhanced in September 2017, but also here no extremely severe geomagnetic storm (Kp = 9) was recorded.
One can conclude that space weather conditions were really favorable to the Apollo 11 mission. There were only a few small sunspot groups present on the solar disk, resulting in little or no flaring and as a consequence no particular extra threats from particle radiation or geomagnetic storms.
Review of solar activity
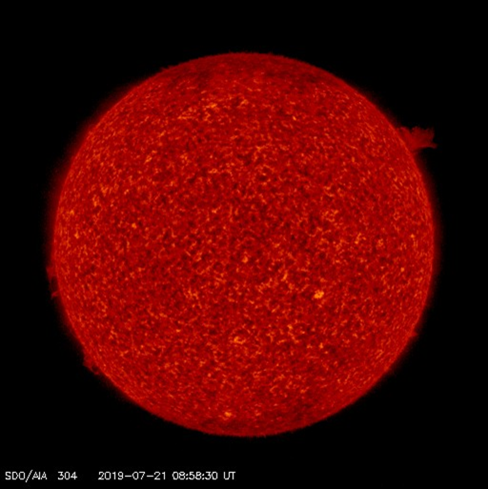
Solar activity was at very low levels. The Sun was spotless and no flares were observed during the week. There were no Earth directed coronal mass ejections (CME) and the greater than 10 MeV proton flux remained at background levels.
The SDO/AIA 304 image underneath shows some prominence activity near the Sun's northwest limb on 21 July.
PROBA2 Observations (15 Jul 2019 - 21 Jul 2019)
Solar Activity
Solar flare activity was very low during the week.
In order to view the activity of this week in more detail, we suggest to go to the following website from which all the daily (normal and difference) movies can be accessed: http://proba2.oma.be/ssa
This page also lists the recorded flaring events.
A weekly overview movie can be found here (SWAP week 486).
http://proba2.oma.be/swap/data/mpg/movies/weekly_movies/weekly_movie_2019_07_15.mp4
Details about some of this week's events, can be found further below.
If any of the linked movies are unavailable they can be found in the P2SC movie repository here
http://proba2.oma.be/swap/data/mpg/movies/
Friday Jul 19
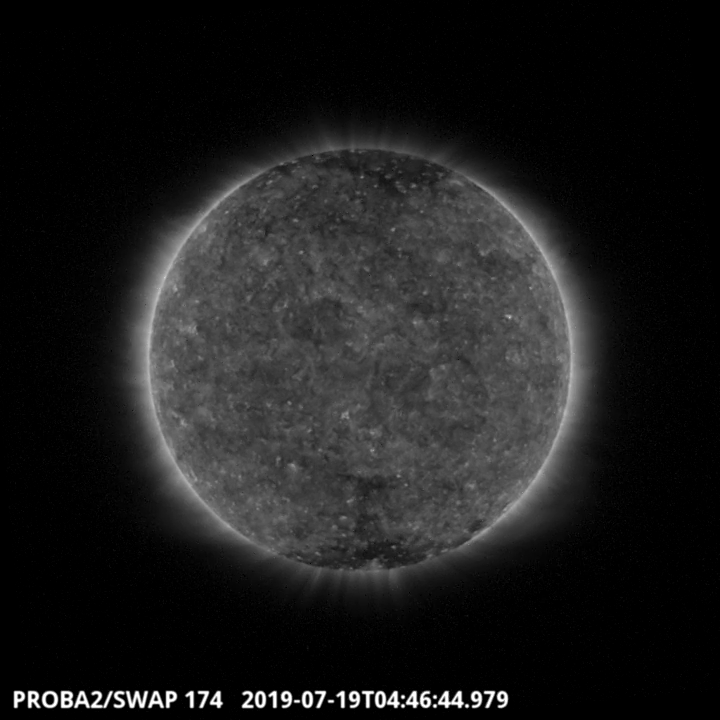
An extension of the southern polar coronal hole, which traversed the central meridian on July 19 around 4:46 UT is visible on the SWAP image above. Find a movie of the events here (SWAP movie) http://proba2.oma.be/swap/data/mpg/movies/20190719_swap_movie.mp4
The International Sunspot Number
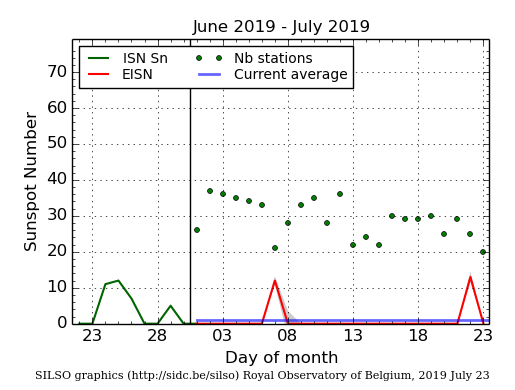
The daily Estimated International Sunspot Number (EISN, red curve with shaded error) derived by a simplified method from real-time data from the worldwide SILSO network. It extends the official Sunspot Number from the full processing of the preceding month (green line). The plot shows the last 30 days (about one solar rotation). The horizontal blue line shows the current monthly average, while the green dots give the number of stations included in the calculation of the EISN for each day.
Review of geomagnetic activity
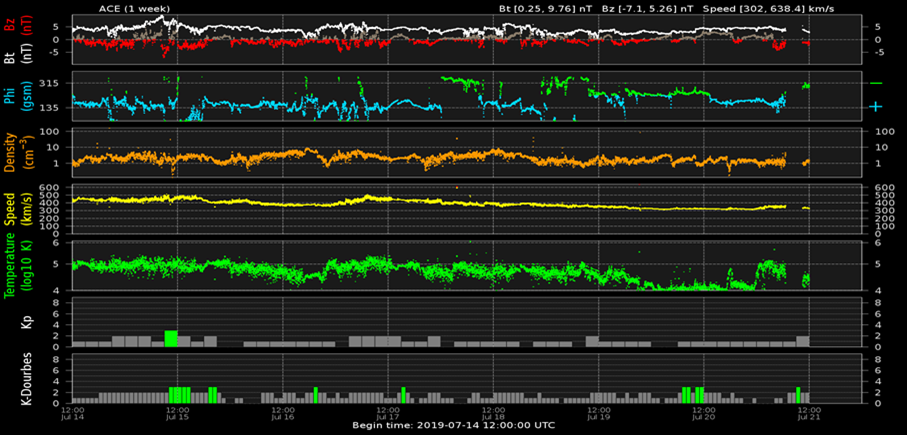
Solar wind parameters were at background levels for most of the week. The solar wind speed varied between 310 and 500 km/s (ACE) and the Bz component ranged between -7 and +5 nT. Quiet to unsettled geomagnetic conditions were observed with the Kp index (NOAA) and the local K index (Dourbes) ranging between 0-3.
The graph underneath shows the evolution of the solar wind parameters as measured by the ACE satellite, and the geomagnetic indices Kp and K Dourbes. The yellow curve reflects the solar wind speed, while Bz is shown by the red curve. Solar wind was also characterized by a low to moderate density (orange) and temperature (green). Geomagnetic activity was at quiet to unsettled levels.
Geomagnetic Observations at Dourbes (15 Jul 2019 - 21 Jul 2019)

The SIDC Space Weather Briefing
The Space Weather Briefing presented by the forecaster on duty from 15 to 21 July. It reflects in images and graphs what is written in the Solar and Geomagnetic Activity reports.
The pdf-version: http://www.stce.be/briefings/20190722_SWbriefing.pdf
The automatically running presentation: http://www.stce.be/briefings/20190722_SWbriefing.wmv
Review of ionospheric activity (15 Jul 2019 - 21 Jul 2019)
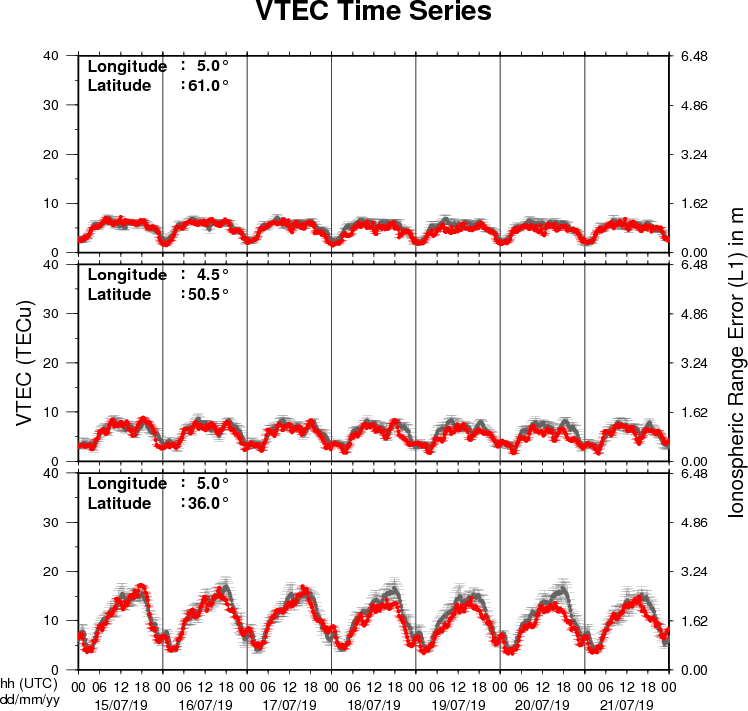
The figure shows the time evolution of the Vertical Total Electron Content (VTEC) (in red) during the last week at three locations:
a) in the northern part of Europe(N61°, 5°E)
b) above Brussels(N50.5°, 4.5°E)
c) in the southern part of Europe(N36°, 5°E)
This figure also shows (in grey) the normal ionospheric behaviour expected based on the median VTEC from the 15 previous days.
The VTEC is expressed in TECu (with TECu=10^16 electrons per square meter) and is directly related to the signal propagation delay due to the ionosphere (in figure: delay on GPS L1 frequency).
The Sun's radiation ionizes the Earth's upper atmosphere, the ionosphere, located from about 60km to 1000km above the Earth's surface.The ionization process in the ionosphere produces ions and free electrons. These electrons perturb the propagation of the GNSS (Global Navigation Satellite System) signals by inducing a so-called ionospheric delay.
See http://stce.be/newsletter/GNSS_final.pdf for some more explanations ; for detailed information, see http://gnss.be/ionosphere_tutorial.php