- Table of Content
- 1.Are we there y...
- 2.Review of sola...
- 3.PROBA2 Observa...
- 4.The Internatio...
- 5.Review of geom...
- 6.Geomagnetic Ob...
- 7.The SIDC Space...
- 8.Review of iono...
2. Review of solar activity
3. PROBA2 Observations (22 Jul 2019 - 28 Jul 2019)
4. The International Sunspot Number
5. Review of geomagnetic activity
6. Geomagnetic Observations at Dourbes (22 Jul 2019 - 28 Jul 2019)
7. The SIDC Space Weather Briefing
8. Review of ionospheric activity (22 Jul 2019 - 28 Jul 2019)
Are we there yet?...
The solar radio flux is daily measured at the wavelength of 10.7 cm by the Dominion Radio Astrophysical Observatory (DRAO) in Penticton, BC, Canada. See this STCE Newsitem at http://www.stce.be/news/374/welcome.html for more details. This wavelength is very sensitive to conditions in the Sun's upper chromosphere and at the base of the corona, and thus a very good indicator of solar activity and proxy for the sunspot number. Indeed, since measurements of the radio flux started in 1947, the Meeus smoothed monthly radio flux always reached its solar cycle minimum within two months of the smoothed sunspot number minimum.
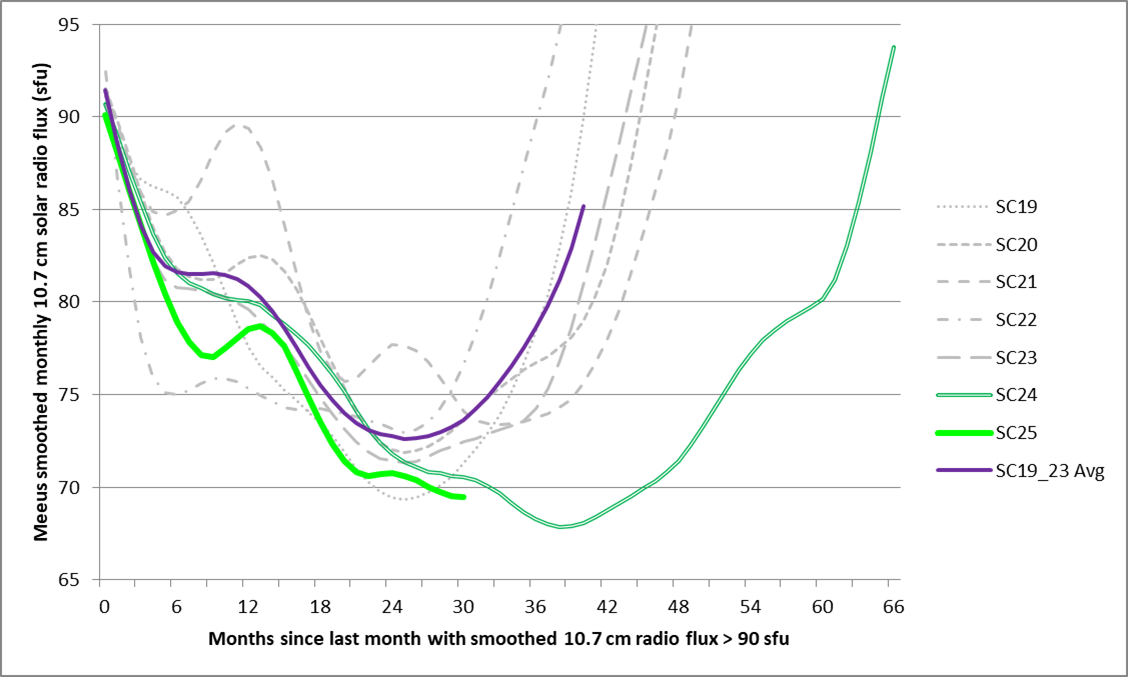
The graph above shows the smoothed monthly radio flux for the previous transits of solar cycles 19 thru 23 (SC19, ..., SC23 - grey lines), with the average evolution in the thick purple line. Month "0" corresponds to the last month when the radio flux was above 90 sfu (solar flux units - see link to the newsitem above). The double green line is the smoothed evolution of the previous cycle transit (SC24), and the thick fluo-green line is the current evolution of the radio flux. It's clear that the evolution towards SC25 is gradually starting to be more similar to the evolution of the previous solar cycle (SC24), and to deviate more from the 5 solar cycles before that. ***If*** the current evolution of the smoothed radio flux continues to mimick that of the previous solar cycle transition (SC24), then a cycle minimum can be expected somewhere around August 2019. Note a healthy error margin is appropriate, as there's a 4 month uncertainty for the radio flux timing, and -as stated before- a potential 2 month difference with the sunspot cycle minimum. Of interest too is that a similar approach for the International Sunspot Number (ISN) puts the minimum in January 2020. This means that both timings for the solar cycle minimum fall in the first half of the prediction range announced by the international SC25 prediction panel a few months ago (see this STCE Newsitem at http://www.stce.be/news/453/welcome.html ).
Review of solar activity
The solar activity has been quiet over the past week. One short-lived bipolar sunspot group was observed during the period (Catania sunspot group 21, NOAA Active region 2745), but didn't show any activity. The X-ray flux remained below B-level.
No earth-directed coronal mass ejections (CME) were observed in the available coronagraph imagery. The greater than 10 MeV proton flux remained at background levels.
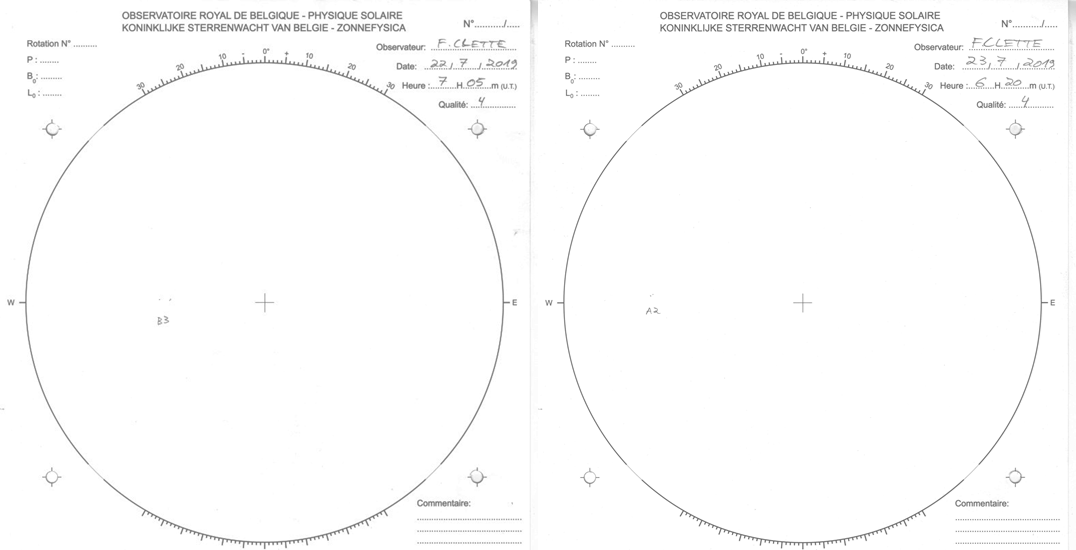
Underneath the Sun as it was observed with the solar telescopes at Uccle (USET - Uccle Solar Equatorial Table ; http://www.sidc.be/uset/ ) on 22 and 23 July. The spots from NOAA 2745 are very tiny.
PROBA2 Observations (22 Jul 2019 - 28 Jul 2019)
Solar Activity
Solar flare activity was very low during the week.
In order to view the activity of this week in more detail, we suggest to go to the following website from which all the daily (normal and difference) movies can be accessed: http://proba2.oma.be/ssa
This page also lists the recorded flaring events.
A weekly overview movie can be found here (SWAP week 487).
http://proba2.oma.be/swap/data/mpg/movies/weekly_movies/weekly_movie_2019_07_22.mp4
Details about some of this week's events, can be found further below.
If any of the linked movies are unavailable they can be found in the P2SC movie repository here
http://proba2.oma.be/swap/data/mpg/movies/
Sunday Jul 28
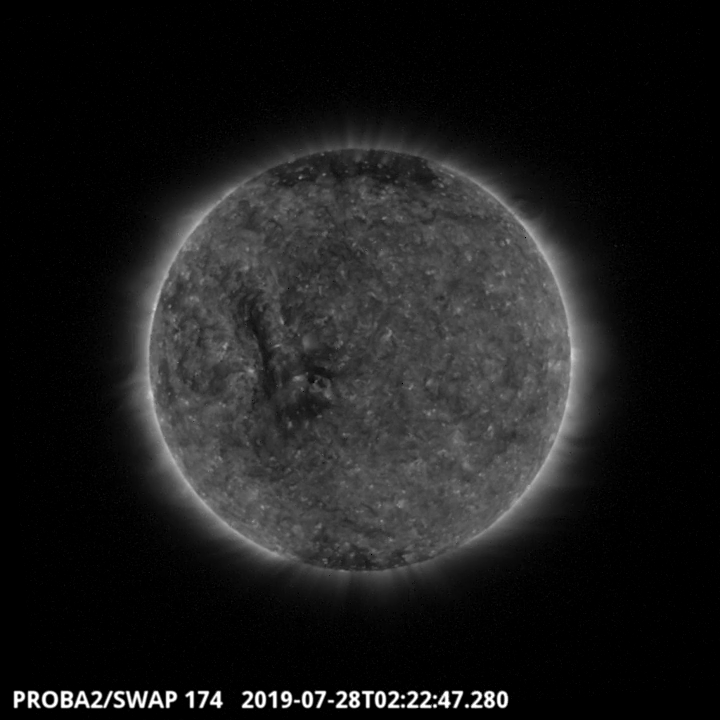
A filament is visible on the Eastern part of the Sun of the SWAP image above (2019-07-28).
Find a movie of the event here (SWAP movie) http://proba2.oma.be/swap/data/mpg/movies/20190728_swap_movie.mp4
Sunday Jul 28
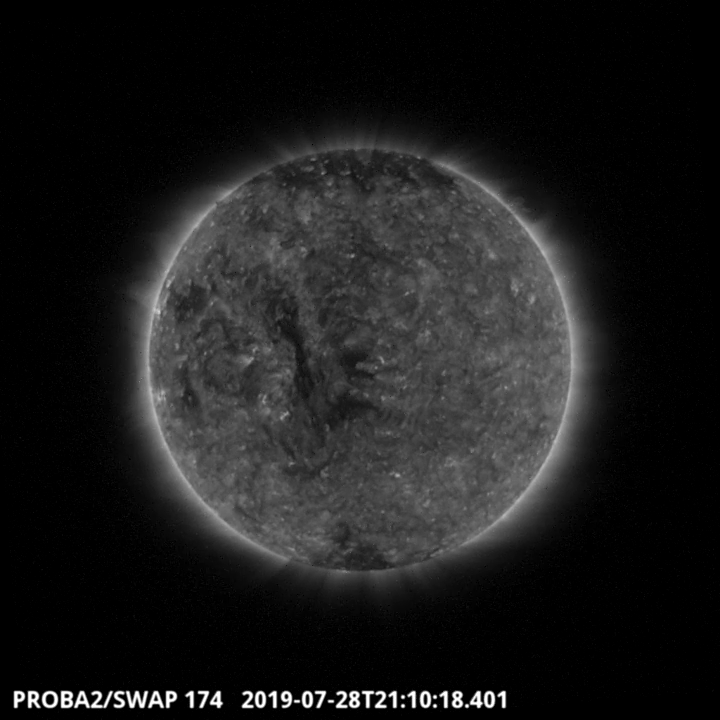
An equatorial coronal hole which transited the central meridian on 2019-07-28 around 21:10 UT is visible on the SWAP image above. Find a movie of the event here (SWAP movie) http://proba2.oma.be/swap/data/mpg/movies/20190728_swap_movie.mp4
The International Sunspot Number
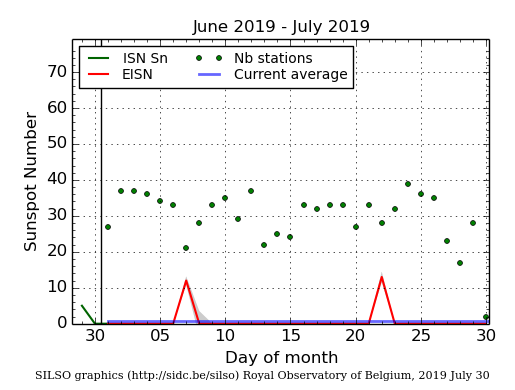
The daily Estimated International Sunspot Number (EISN, red curve with shaded error) derived by a simplified method from real-time data from the worldwide SILSO network. It extends the official Sunspot Number from the full processing of the preceding month (green line). The plot shows the last 30 days (about one solar rotation). The horizontal blue line shows the current monthly average, while the green dots give the number of stations included in the calculation of the EISN for each day.
Review of geomagnetic activity
The solar wind parameters were mostly at nominal levels indicative of a slow solar wind regime (300-400 km/s). The total interplanetary magnetic field remained below 6 nT, except for very short periods in the beginning of the week due to the mild influence of the southern coronal hole, and at the end of the week when it reached 8 nT. A recurrent equatorial coronal hole with negative polarity reached the central meridian on July 28. The coronal hole surface area increased compared to the previous rotation suggesting that the high-speed stream effect could be stronger this time.
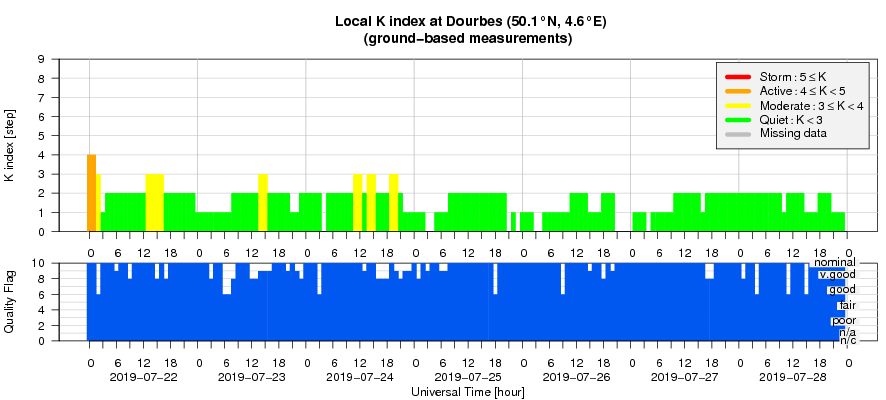
Quiet to unsettled geomagnetic conditions were observed over the week with short periods of active conditions recorded by the local K index (Dourbes) in the beginning of the week due to the mild influence of the southern coronal hole.
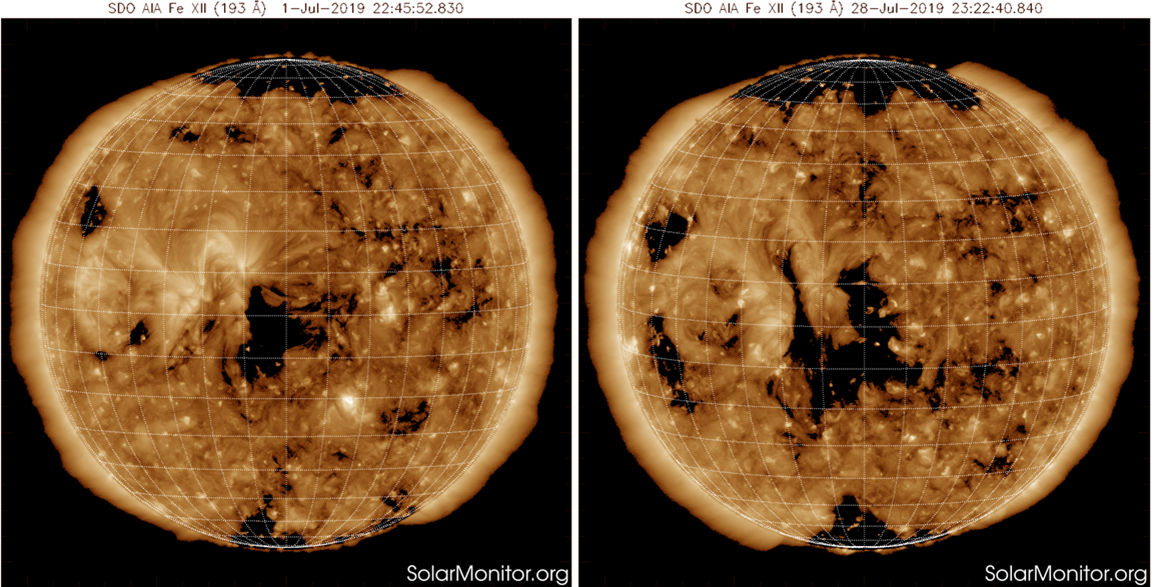
Underneath a solar image in extreme ultraviolet (SDO/AIA 193 - https://sdo.gsfc.nasa.gov/ ) recorded on 1 July (left) and one solar rotation later on 28 July (right). One can see the growth in size of the recurrent equatorial negative polarity coronal hole (center of the image), even taking into account that the elongated structure to the east (left) of the coronal hole is actually a filament.
Geomagnetic Observations at Dourbes (22 Jul 2019 - 28 Jul 2019)
The SIDC Space Weather Briefing
The Space Weather Briefing presented by the forecaster on duty from 22 to 28 July. It reflects in images and graphs what is written in the Solar and Geomagnetic Activity reports.
The pdf-version: http://www.stce.be/briefings/20190729_SWbriefing.pdf
The automatically running presentation: http://www.stce.be/briefings/20190729_SWbriefing.wmv
Review of ionospheric activity (22 Jul 2019 - 28 Jul 2019)
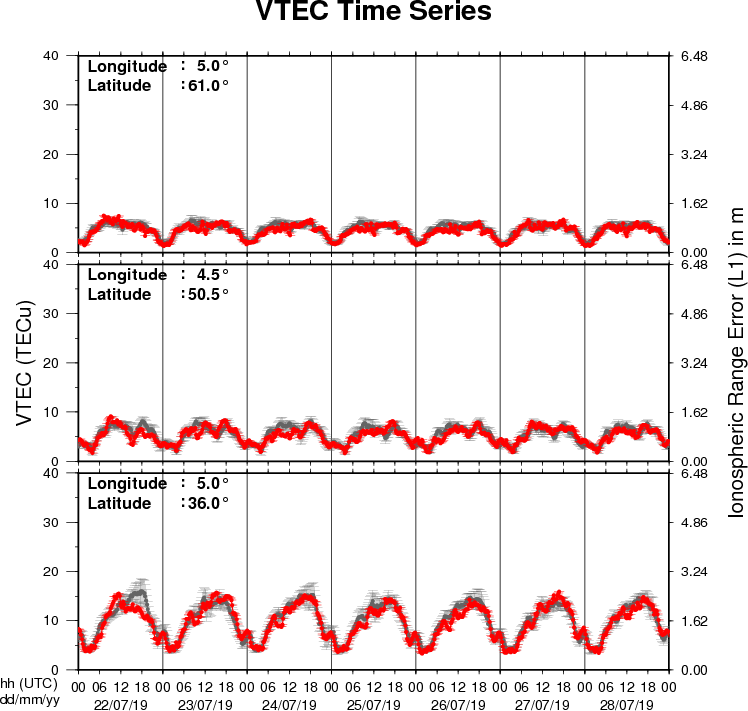
The figure shows the time evolution of the Vertical Total Electron Content (VTEC) (in red) during the last week at three locations:
a) in the northern part of Europe(N61°, 5°E)
b) above Brussels(N50.5°, 4.5°E)
c) in the southern part of Europe(N36°, 5°E)
This figure also shows (in grey) the normal ionospheric behaviour expected based on the median VTEC from the 15 previous days.
The VTEC is expressed in TECu (with TECu=10^16 electrons per square meter) and is directly related to the signal propagation delay due to the ionosphere (in figure: delay on GPS L1 frequency).
The Sun's radiation ionizes the Earth's upper atmosphere, the ionosphere, located from about 60km to 1000km above the Earth's surface.The ionization process in the ionosphere produces ions and free electrons. These electrons perturb the propagation of the GNSS (Global Navigation Satellite System) signals by inducing a so-called ionospheric delay.
See http://stce.be/newsletter/GNSS_final.pdf for some more explanations ; for detailed information, see http://gnss.be/ionosphere_tutorial.php