- Table of Content
- 1.PROBA2 Observa...
- 2.Review of sola...
- 3.Review of geom...
- 4.The SIDC space...
- 5.The Internatio...
- 6.Geomagnetic Ob...
- 7.Review of iono...
2. Review of solar activity
3. Review of geomagnetic activity
4. The SIDC space weather Briefing
5. The International Sunspot Number by SILSO
6. Geomagnetic Observations at Dourbes (5 Aug 2019 - 11 Aug 2019)
7. Review of ionospheric activity (5 Aug 2019 - 11 Aug 2019)
PROBA2 Observations (5 Aug 2019 - 11 Aug 2019)
Solar Activity
Solar flare activity was very low during the week.
In order to view the activity of this week in more detail, we suggest to go to the following website from which all the daily (normal and difference) movies can be accessed: http://proba2.oma.be/ssa
This page also lists the recorded flaring events.
A weekly overview movie can be found here (SWAP week 489). http://proba2.oma.be/swap/data/mpg/movies/weekly_movies/weekly_movie_2019_08_05.mp4
Details about some of this week's events, can be found further below.
If any of the linked movies are unavailable they can be found in the P2SC movie repository here http://proba2.oma.be/swap/data/mpg/movies/
Monday 05
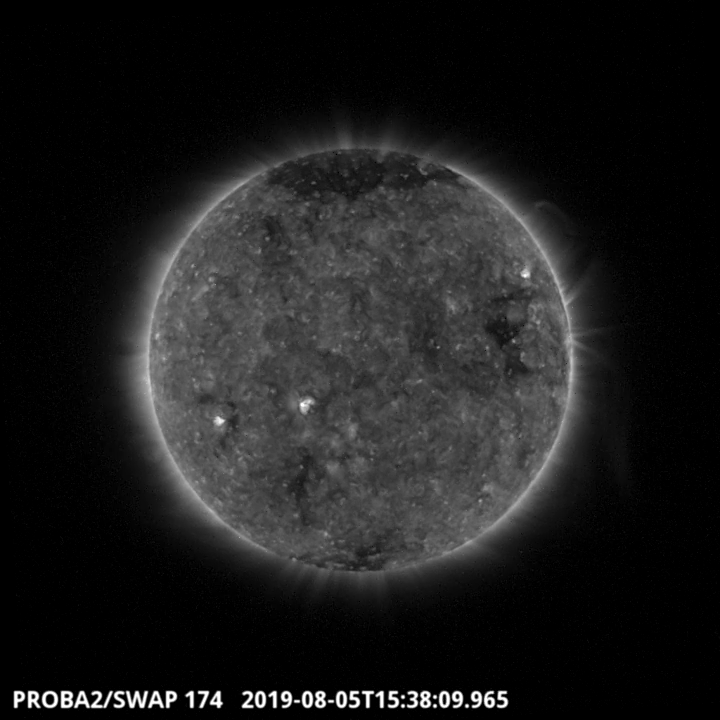
On 2019-Aug-05, two inactive small sunspot groups (NOAA 2746 and NOAA 2747) were visible. Find a movie of the event here (SWAP movie) http://proba2.oma.be/swap/data/mpg/movies/20190805_swap_movie.mp4
Wednesday Aug 07
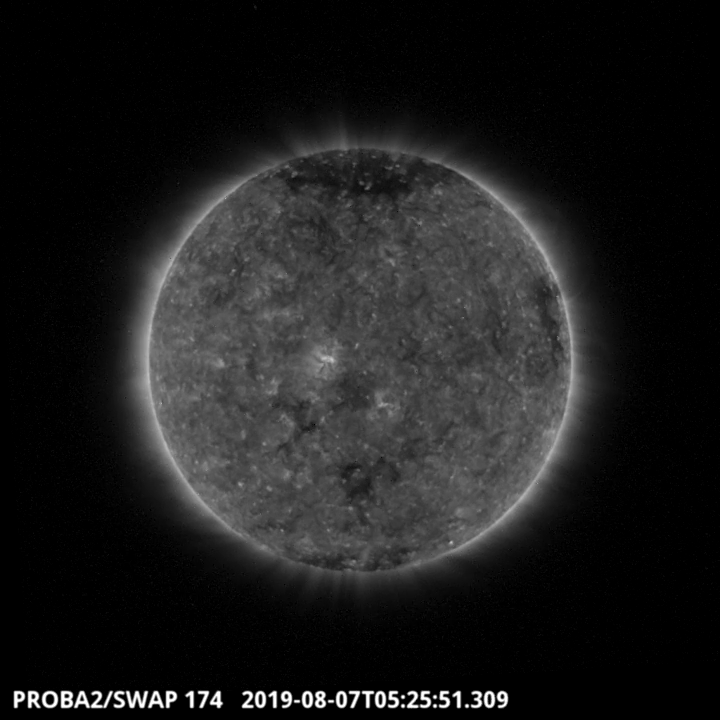
A patchy South coronal hole transited the central meridian on 2019-Aug-07 around 05:25 UT. It is visible on the SWAP image above. Find a movie of the event here (SWAP movie) http://proba2.oma.be/swap/data/mpg/movies/20190807_swap_movie.mp4
Review of solar activity
Solar activity was at very low levels.
Sunspots
Two small sunspot groups were visible on resp. 5-6 (NOAA 2746) and 6-7 (NOAA 2747) August. Both groups belonged to the old solar cycle 24 and were inactive, though a small eruption was observed on 7 August in NOAA 2746 when the region was already spotless.
Solar wind
On 4 August, a filament eruption took place at N45W50 close to the northern polar coronal. The associated coronal mass ejection (CME) was not directed to Earth.
No earth-directed CMEs were observed during the week.
A positive polarity equatorial coronal hole (CH) rotated over the west limb around 8 August, whereas a diffuse and patchy negative polarity CH transited the central meridian (CM) on 7 August.
Protons
The greater than 10 MeV proton flux was at nominal levels.
Review of geomagnetic activity
Solar wind at L1
The co-rotating interaction region (CIR) and high speed wind stream (HSS) from the positive polarity coronal hole (CH) arrived on 5 August. Wind speeds reached maximum values between 700 and 760 km/s on 5-6 August (ACE), the highest in more than a year. Wind speeds then gradually decreased to 400 km/s by the end of the period, however with some pronounced enhancements on 8 and 9-10 August, when values increased back to resp. 570 and 660 km/s. Bz reached -21 nT during the passage of the CIR, then varied between -6 and +5 nT for the rest of the week. The Interplanetary Magnetic Field (IMF) was predominately directed away from the Sun (positive sector).
By the end of the period, the wind stream of the negative polarity CH had not arrived yet.
Response of the Earth magnetic field
The passage of the CIR and HSS of the positive polarity CH resulted in a minor geomagnetic storm. Kp remained at 5 (minor storm) for 4 consecutive 3-hour intervals, and also in Dourbes the K index reached 5. From 6 August onwards, geomagnetic activity was at quiet to unsettled levels with K Dourbes recording an isolated active episode during the 23-02UT interval on 9-10 August.
The SIDC space weather Briefing
The Space Weather Briefing presented by the forecaster on duty from August 5 to 11. It reflects in images and graphs what is written in the Solar and Geomagnetic Activity report.
The pdf-version: http://www.stce.be/briefings/20190812_SWbriefing.pdf
The automatically running presentation: http://www.stce.be/briefings/20190812_SWbriefing.ppsm
The International Sunspot Number by SILSO
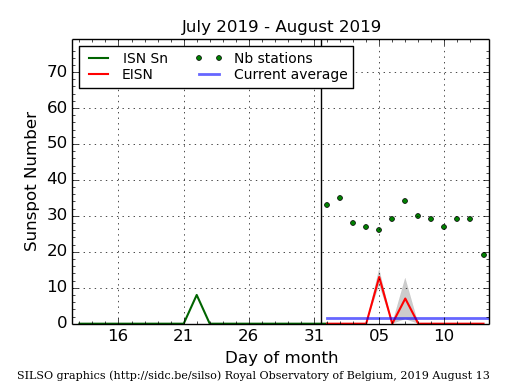
The daily Estimated International Sunspot Number (EISN, red curve with shaded error) derived by a simplified method from real-time data from the worldwide SILSO network. It extends the official Sunspot Number from the full processing of the preceding month (green line). The plot shows the last 30 days (about one solar rotation). The horizontal blue line shows the current monthly average, while the green dots give the number of stations included in the calculation of the EISN for each day.
Geomagnetic Observations at Dourbes (5 Aug 2019 - 11 Aug 2019)

Review of ionospheric activity (5 Aug 2019 - 11 Aug 2019)
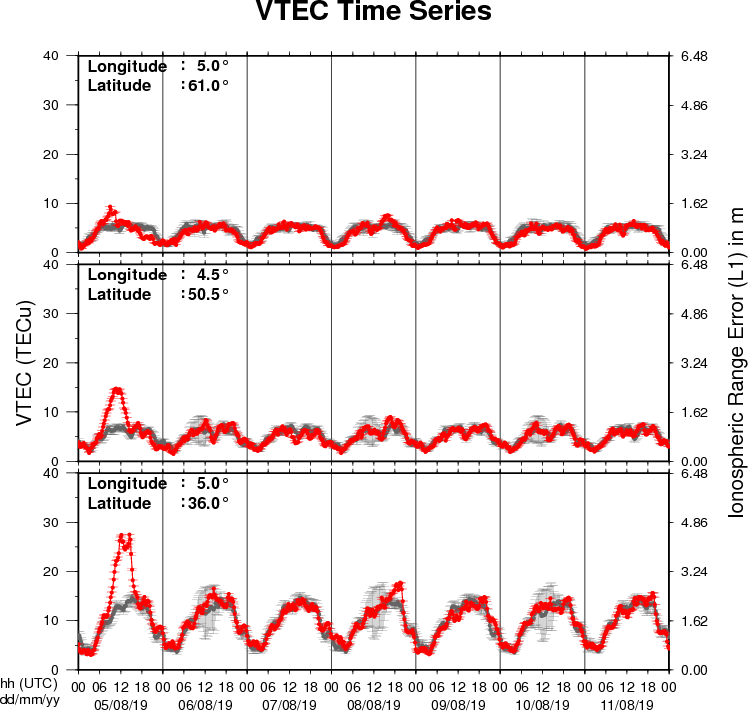
The figure shows the time evolution of the Vertical Total Electron Content (VTEC) (in red) during the last week at three locations:
a) in the northern part of Europe(N61°, 5°E)
b) above Brussels(N50.5°, 4.5°E)
c) in the southern part of Europe(N36°, 5°E)
This figure also shows (in grey) the normal ionospheric behaviour expected based on the median VTEC from the 15 previous days.
The VTEC is expressed in TECu (with TECu=10^16 electrons per square meter) and is directly related to the signal propagation delay due to the ionosphere (in figure: delay on GPS L1 frequency).
The Sun's radiation ionizes the Earth's upper atmosphere, the ionosphere, located from about 60km to 1000km above the Earth's surface.The ionization process in the ionosphere produces ions and free electrons. These electrons perturb the propagation of the GNSS (Global Navigation Satellite System) signals by inducing a so-called ionospheric delay.
See http://stce.be/newsletter/GNSS_final.pdf for some more explanations ; for detailed information, see http://gnss.be/ionosphere_tutorial.php