- Table of Content
- 1.PROBA2 Observa...
- 2.Review of sola...
- 3.The Internatio...
- 4.Geomagnetic Ob...
- 5.The SIDC space...
- 6.Review of iono...
2. Review of solar and geomagnetic activity
3. The International Sunspot Number by SILSO
4. Geomagnetic Observations at Dourbes (12 Aug 2019 - 18 Aug 2019)
5. The SIDC space weather Briefing
6. Review of ionospheric activity (12 Aug 2019 - 18 Aug 2019)
PROBA2 Observations (12 Aug 2019 - 18 Aug 2019)
Solar Activity
Solar flare activity remained very low during the week.
In order to view the activity of this week in more detail, we suggest to go to the following website from which all the daily (normal and difference) movies can be accessed: http://proba2.oma.be/ssa
This page also lists the recorded flaring events.
A weekly overview movie can be found here (SWAP week 490): http://proba2.oma.be/swap/data/mpg/movies/weekly_movies/weekly_movie_2019_08_12.mp4
Details about some of this week's events can be found further below.
If any of the linked movies are unavailable they can be found in the P2SC movie repository here: http://proba2.oma.be/swap/data/mpg/movies/
Monday Aug 12
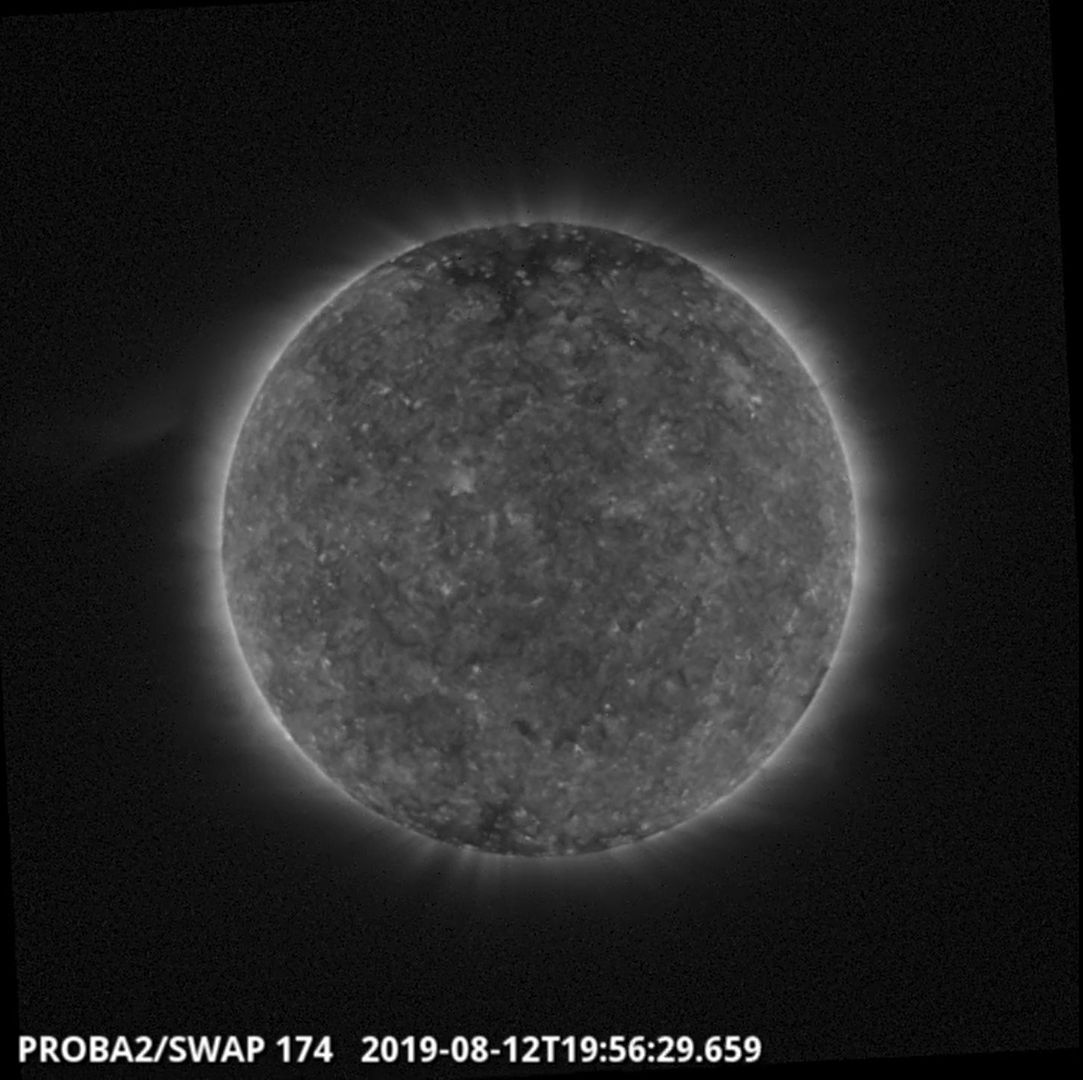
An eruption, originating from the backside of the Sun, was observed by SWAP on 2019-Aug-12 and is shown emerging over the east solar limb in the SWAP image above taken at 19:56 UT.
Find a movie of the event here (SWAP movie): http://proba2.oma.be/swap/data/mpg/movies/20190812_swap_movie.mp4
Review of solar and geomagnetic activity
SOLAR ACTIVITY
No active regions were present, no flares were observed, no Earth-directed CMEs were detected and the greater than 10 MeV proton flux was at nominal levels.
An irregularly shaped negative polarity coronal hole transited the central meridian (CM) on 15 August.
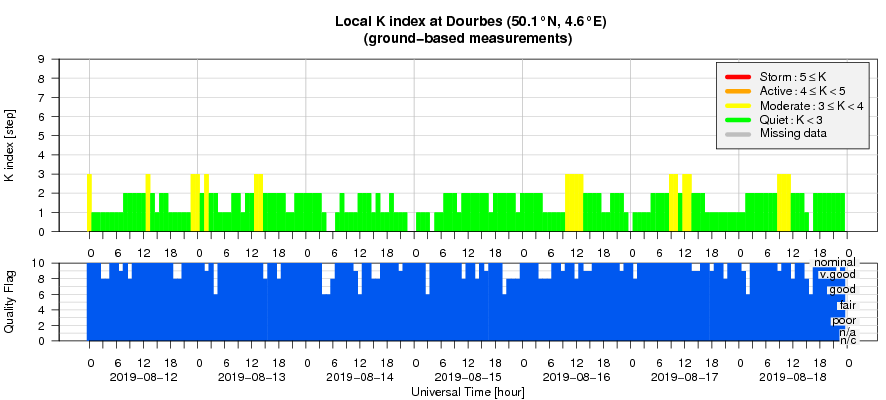
GEOMAGNETIC ACTIVITY
The solar wind gradually decreased from about 500 km/s to 350 km/s. The interplanetary magnetic field averaged around 5 nT, except two intervals of B = 7 nT (13 August) and B = 8 nT (18 August), in both cases as the result of the coronal holes influence that transited the CM on 7 and 15 August.
Geomagnetic condition were mostly quiet except two isolated episodes of unsettled geomagnetic conditions on 13 and 18 of August in agreement with the solar wind parameters evolution.
The International Sunspot Number by SILSO
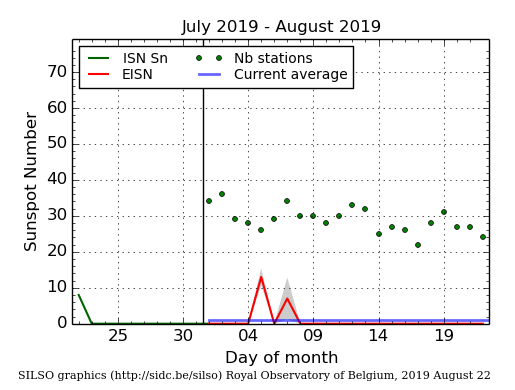
The daily Estimated International Sunspot Number (EISN, red curve with shaded error) derived by a simplified method from real-time data from the worldwide SILSO network. It extends the official Sunspot Number from the full processing of the preceding month (green line). The plot shows the last 30 days (about one solar rotation). The horizontal blue line shows the current monthly average, while the green dots give the number of stations included in the calculation of the EISN for each day.
Geomagnetic Observations at Dourbes (12 Aug 2019 - 18 Aug 2019)
The SIDC space weather Briefing
The Space Weather Briefing presented by the forecaster on duty from August 11 to 18. It reflects in images and graphs what is written in the Solar and Geomagnetic Activity report.
The pdf-version: http://www.stce.be/briefings/20190819_SWbriefing.pdf
The automatically running presentation: http://www.stce.be/briefings/20190819_SWbriefing.ppsm
Review of ionospheric activity (12 Aug 2019 - 18 Aug 2019)
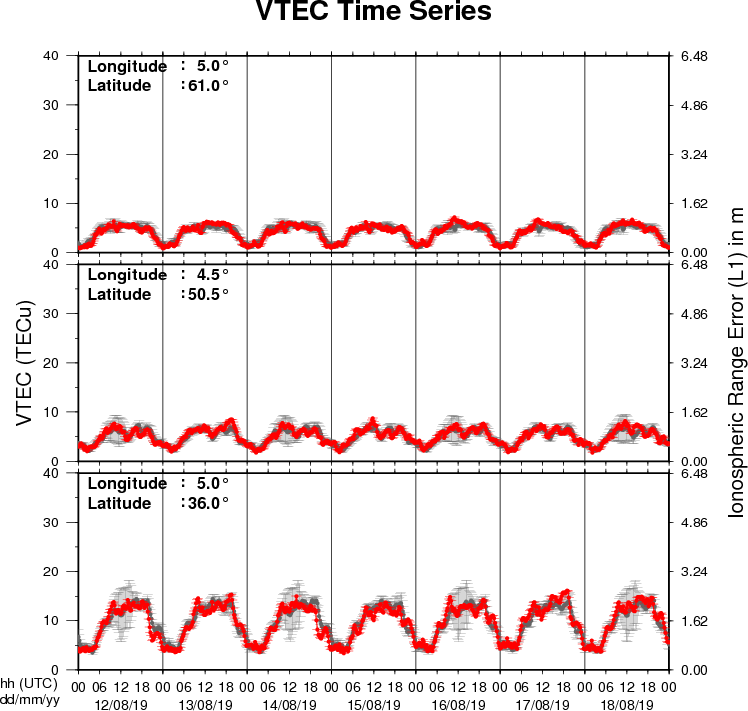
The figure shows the time evolution of the Vertical Total Electron Content (VTEC) (in red) during the last week at three locations:
a) in the northern part of Europe(N61°, 5°E)
b) above Brussels(N50.5°, 4.5°E)
c) in the southern part of Europe(N36°, 5°E)
This figure also shows (in grey) the normal ionospheric behaviour expected based on the median VTEC from the 15 previous days.
The VTEC is expressed in TECu (with TECu=10^16 electrons per square meter) and is directly related to the signal propagation delay due to the ionosphere (in figure: delay on GPS L1 frequency).
The Sun's radiation ionizes the Earth's upper atmosphere, the ionosphere, located from about 60km to 1000km above the Earth's surface.The ionization process in the ionosphere produces ions and free electrons. These electrons perturb the propagation of the GNSS (Global Navigation Satellite System) signals by inducing a so-called ionospheric delay.
See http://stce.be/newsletter/GNSS_final.pdf for some more explanations ; for detailed information, see http://gnss.be/ionosphere_tutorial.php