- Table of Content
- 1.Deep is the mi...
- 2.ESWW2019 - Des...
- 3.Review of sola...
- 4.PROBA2 Observa...
- 5.The Internatio...
- 6.Geomagnetic Ob...
- 7.The SIDC space...
- 8.Review of iono...
2. ESWW2019 - Design4Ticket
3. Review of solar and geomagnetic activity
4. PROBA2 Observations (19 Aug 2019 - 25 Aug 2019)
5. The International Sunspot Number by SILSO
6. Geomagnetic Observations at Dourbes (19 Aug 2019 - 25 Aug 2019)
7. The SIDC space weather Briefing
8. Review of ionospheric activity (19 Aug 2019 - 25 Aug 2019)
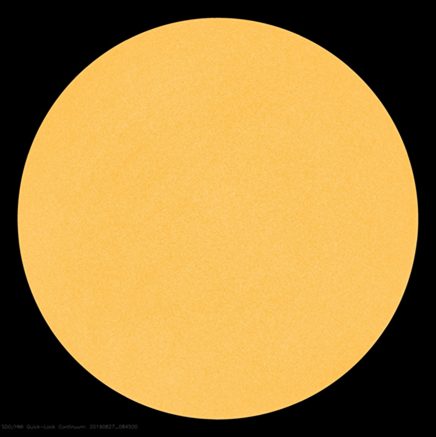
Deep is the minimum...
The Sun has been spotless since 8 August (see SILSO: http://sidc.oma.be/silso/ ). Based on the preliminary sunspot numbers, the longest spotless stretch so far this solar cycle transit was from 30 May until 23 June 2019, totaling 25 spotless days. So, early September, this record may be broken if the Sun remains this inactive. The year 2019 has accumulated 107 spotless days so far (June), so there's also a good chance that 2019 will have even more spotless days than last year (208 days), making it all the way into the top 15 of years with the most number of spotless days since 1849. See the Spotless Days page at SILSO (http://sidc.oma.be/silso/spotless ) for more info.
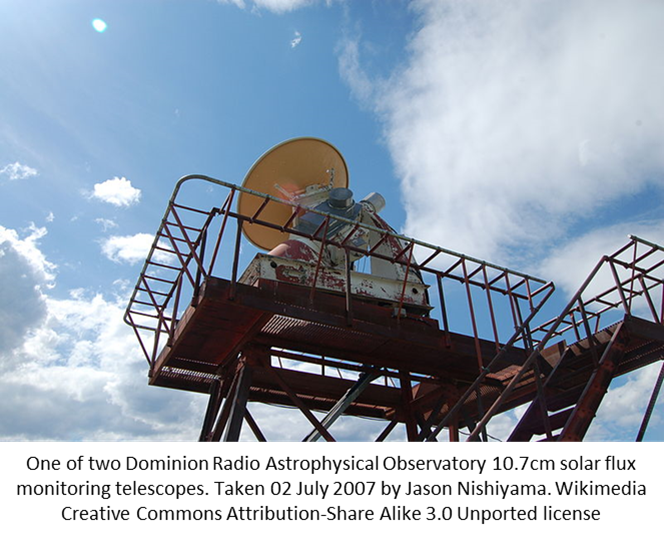
Also the observed solar radio flux (see the STCE Newsitem at http://www.stce.be/news/374/welcome.html for more details) is at its lowest levels since the beginning of this cycle minimum. As reported by DRAO/Penticton (http://www.spaceweather.ca/solarflux/sx-4a-en.php ), values around 65.7 sfu (solar flux units, with 1 sfu = 10-22 W m-2 Hz-1) were observed on 3, 22 and 26 August. These are the lowest observed radio fluxes so far this solar cycle. Note that in August, the Sun-Earth distance is still a bit larger than the average distance of about 150 million km. Correcting for this effect results in adjusted radio fluxes which are in the lower 67 sfu. The lowest adjusted daily values so far have occurred in November 2018, with values around 65.5-65.6 sfu. A very low value (below 65 sfu) on 9 November 2017 is believed to be an erroneous measurement.
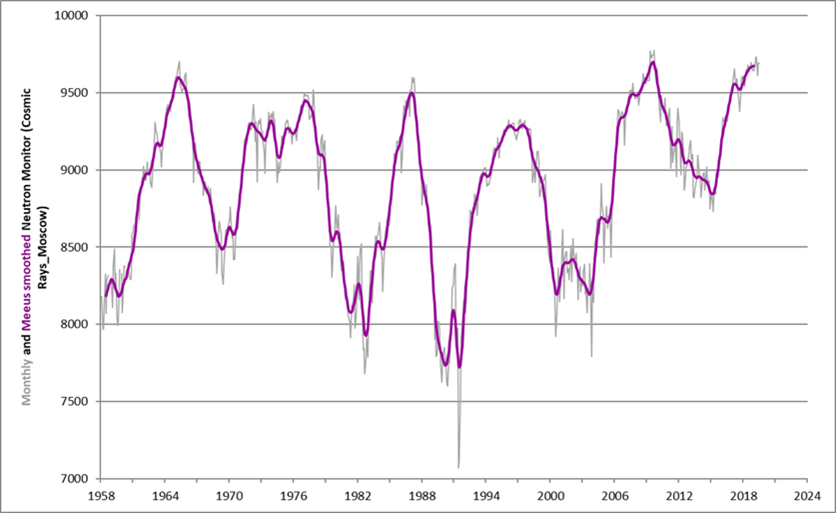
The lack of solar activity reduces our magnetic protection against cosmic rays, high-energetic particles coming from outside our solar system (see this STCE Newsitem at http://www.stce.be/news/433/welcome.html for more info). When some finally arrive at Earth, they collide with particles in the Earth's upper atmosphere, creating a shower of secondary particles such as neutrons, which are then detected by neutron monitors such as in Dourbes or various other sites around the world (Moscow, Oulu,...). The graph underneath shows the monthly and monthly smoothed neutron count by the neutron monitor from Moscow since 1958. One can readily see the 11 year solar cycle modulation, with particle counts being the highest during low solar activity (solar cycle minimum) and vice versa. The current counts are very high and comparable to those during the previous solar cycle transit, testifying of the deep minimum we are currently going through.
ESWW2019 - Design4Ticket
Important message
You can win a ticket for ESWW2019 by designing the theme picture: http://www.stce.be/esww2019/postercontest.php
Deadline is September 8.

Review of solar and geomagnetic activity
Solar activity
The solar activity has been quiet. The sun was spotless and the X-ray flux remained below B-level.
No Earth-directed coronal mass ejections (CME) were observed in the available coronagraph imagery.
The greater than 10 MeV proton flux remained at background levels.
Geomagnetic activity
The Earth was under the influence of a slow solar wind regime: the wind speed was mostly below 400 km/s, the total interplanetary magnetic field was below 5 nT, and the Bz component was close to 0 nT and showed only small fluctuations (as recorded by ACE).
PROBA2 Observations (19 Aug 2019 - 25 Aug 2019)
Solar Activity
Solar flare activity was very low during the week.
In order to view the activity of this week in more detail, we suggest to go to the following website from which all the daily (normal and difference) movies can be accessed: http://proba2.oma.be/ssa
This page also lists the recorded flaring events.
A weekly overview movie can be found here (SWAP week 491): http://proba2.oma.be/swap/data/mpg/movies/weekly_movies/weekly_movie_2019_08_19.mp4
Details about some of this week's events can be found further below.
If any of the linked movies are unavailable they can be found in the P2SC movie repository here: http://proba2.oma.be/swap/data/mpg/movies/
Sunday Aug 25
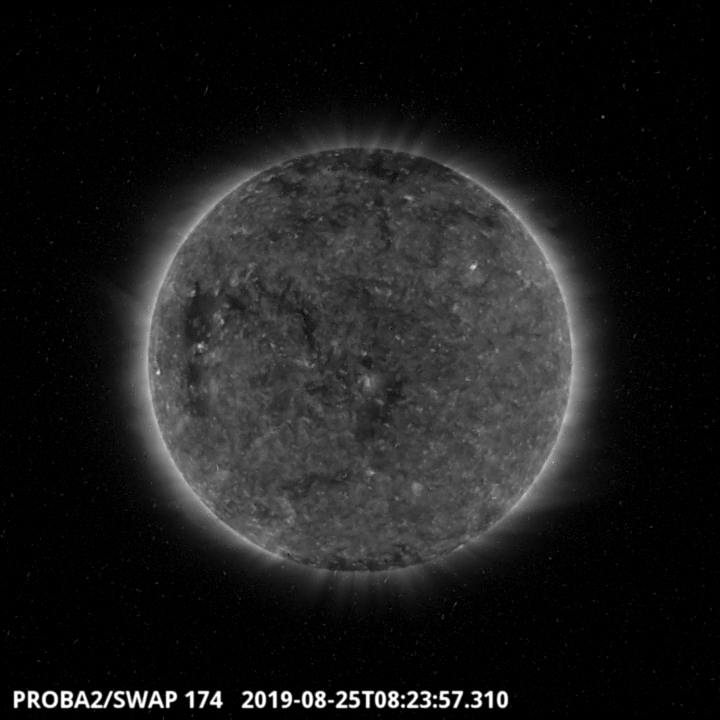
Two coronal holes are visible on the SWAP image above. The first one is located in the southern hemisphere which crossed the central meridian around 8:23 UT and the other is located in the Eastern part of the Sun. Find a movie of the events here (SWAP movie): http://proba2.oma.be/swap/data/mpg/movies/20190825_swap_movie.mp4
The International Sunspot Number by SILSO
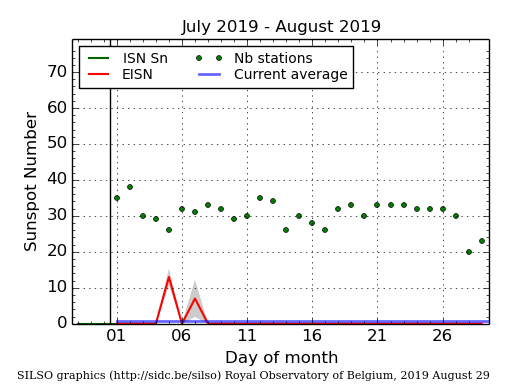
The daily Estimated International Sunspot Number (EISN, red curve with shaded error) derived by a simplified method from real-time data from the worldwide SILSO network. It extends the official Sunspot Number from the full processing of the preceding month (green line). The plot shows the last 30 days (about one solar rotation). The horizontal blue line shows the current monthly average, while the green dots give the number of stations included in the calculation of the EISN for each day.
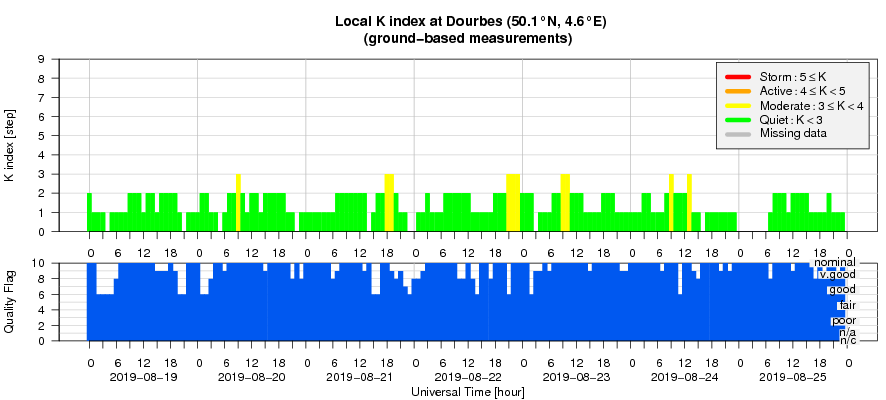
Geomagnetic Observations at Dourbes (19 Aug 2019 - 25 Aug 2019)
The SIDC space weather Briefing
The Space Weather Briefing presented by the forecaster on duty from to August 18 to 25. It reflects in images and graphs what is written in the Solar and Geomagnetic Activity report.
The pdf-version: http://www.stce.be/briefings/20190826_SWbriefing.pdf
The automatically running presentation: http://www.stce.be/briefings/20190826_SWbriefing.ppsm
Review of ionospheric activity (19 Aug 2019 - 25 Aug 2019)
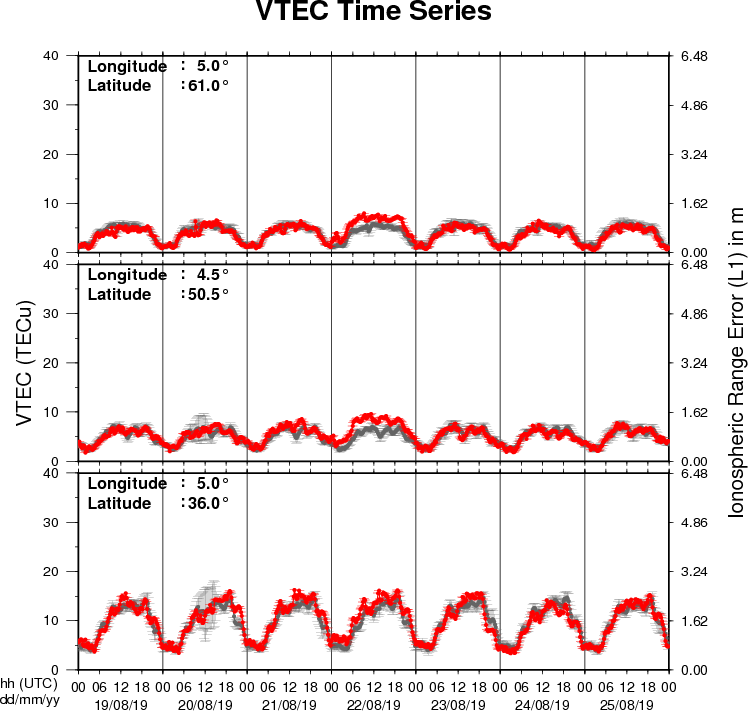
The figure shows the time evolution of the Vertical Total Electron Content (VTEC) (in red) during the last week at three locations:
a) in the northern part of Europe(N61°, 5°E)
b) above Brussels(N50.5°, 4.5°E)
c) in the southern part of Europe(N36°, 5°E)
This figure also shows (in grey) the normal ionospheric behaviour expected based on the median VTEC from the 15 previous days.
The VTEC is expressed in TECu (with TECu=10^16 electrons per square meter) and is directly related to the signal propagation delay due to the ionosphere (in figure: delay on GPS L1 frequency).
The Sun's radiation ionizes the Earth's upper atmosphere, the ionosphere, located from about 60km to 1000km above the Earth's surface.The ionization process in the ionosphere produces ions and free electrons. These electrons perturb the propagation of the GNSS (Global Navigation Satellite System) signals by inducing a so-called ionospheric delay.
See http://stce.be/newsletter/GNSS_final.pdf for some more explanations ; for detailed information, see http://gnss.be/ionosphere_tutorial.php