- Table of Content
- 1.The magnificen...
- 2.Review of sola...
- 3.PROBA2 Observa...
- 4.The Internatio...
- 5.Geomagnetic Ob...
- 6.The SIDC space...
- 7.Review of iono...
2. Review of solar and geomagnetic activity
3. PROBA2 Observations (2 Sep 2019 - 8 Sep 2019)
4. The International Sunspot Number by SILSO
5. Geomagnetic Observations at Dourbes (2 Sep 2019 - 8 Sep 2019)
6. The SIDC space weather Briefing
7. Review of ionospheric activity (2 Sep 2019 - 8 Sep 2019)
The magnificent "7"
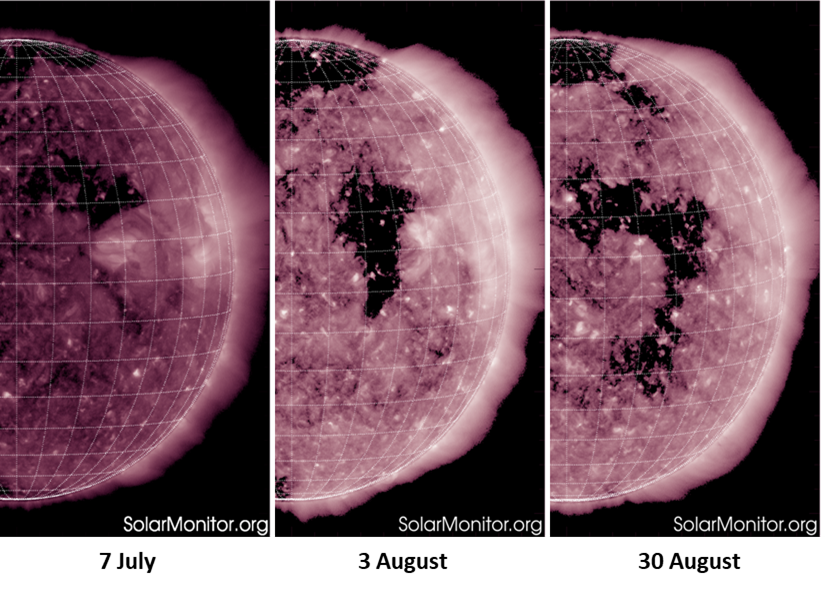
Coronal holes (CH) are regions in the hot solar atmosphere ("corona") where the plasma density at that temperature is very low compared to its surroundings, and thus they look like dark shapes in the corona. Linked to unipolar magnetic fields stretching into space, they are the source of the high-speed solar wind and can create geomagnetic disturbances.
Early July, a small coronal hole started to develop in the northern hemisphere, possibly from an extension of the northern polar coronal hole. It had a positive magnetic polarity, meaning that its magnetic field was directed away from the Sun. One solar rotation later, this CH had substantially grown in size, and during its latest transit late August it had evolved into a distinct shape resembling the number "7". The evolution can be seen in the extreme ultraviolet (EUV) images taken by the SDO/AIA instrument on 7 July, 3 August and 30 August - each image a solar rotation apart.
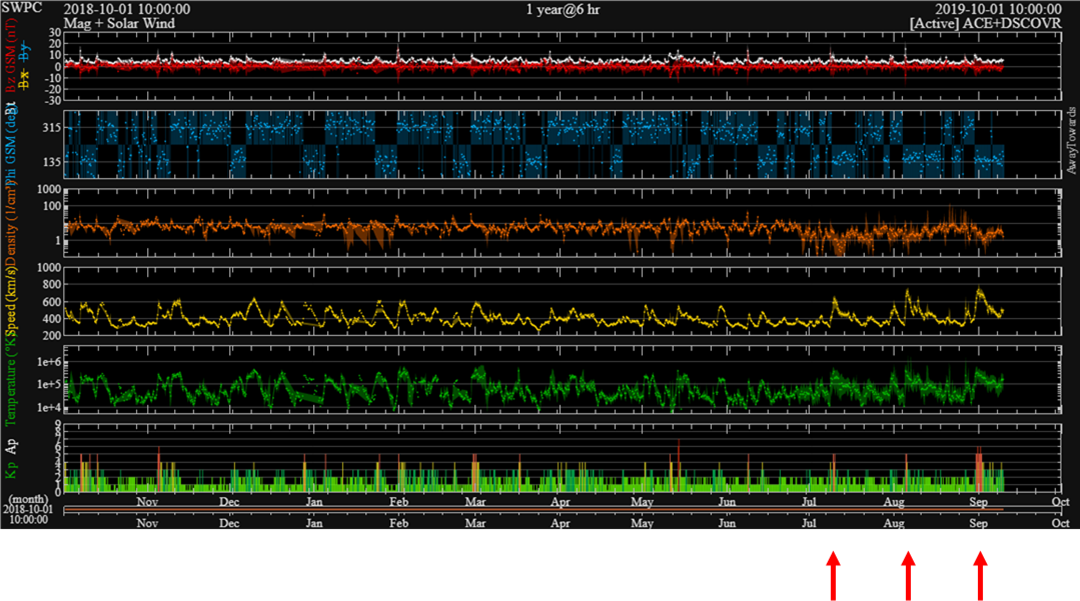
As is usually the case, the more distinct and the larger the size of the coronal hole, the larger the speed of the associated wind stream. No surprize here, with respective maxima for the hourly averaged wind speeds of 644 km/s, 719 km/s and 750 km/s. However, what is surprizing is the very high value of the wind speed. In fact, as can be seen in the chart underneath (speed indicated by the yellow curve), these values (in particular the last two peaks, as indicated by the red arrows) are the highest recorded in more than a year. During each of the wind stream passages, geomagnetic storming was recorded (preliminary Kp index), as can be seen in the bar chart at the bottom.
Fast solar wind streams from coronal holes are also known to drive highly energetic (energies of more than 2 MeV) electrons. The precise mechanism is not well understood yet, but it is believed that the high-speed wind streams can drive magnetic oscillations in the magnetosphere with typical periods from tens to hundreds of seconds, pumping energy into the system. Known as Pc5 waves, these are known for their potential to accelerate electrons to relativistic energies within the outer radiation belts (e.g. Kavanagh and Denton, 2007: https://academic.oup.com/astrogeo/article/48/6/6.24/233267). These electrons have energies high enough to penetrate the satellite's shielding and accumulate around its instruments and critical components. This is called deep di-electric charging (see the STCE newsitem "Itchy satellites" at http://www.stce.be/news/207/welcome.html), and when a threshold is reached, they can lead to electrostatic discharges (ESD) resulting in malfunctions of the satellite and occasionally even in the satellite failure.
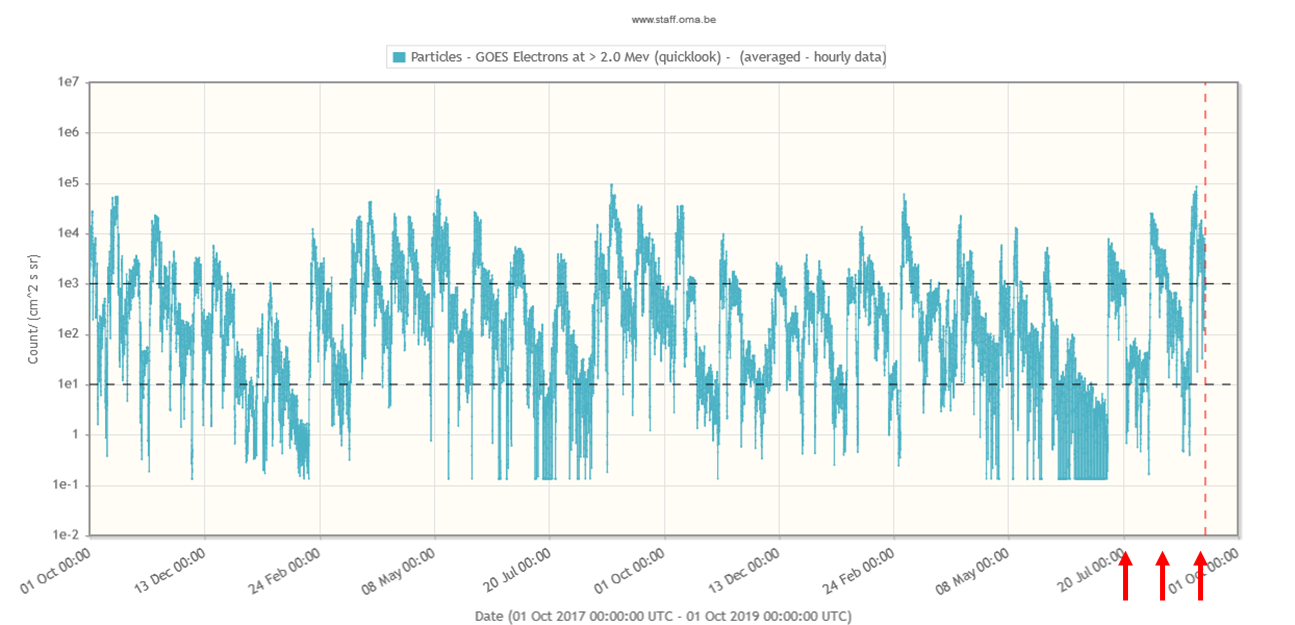
Last week's CH wind stream resulted in one of the highest >= 2 MeV electron fluxes observed during this solar cycle. This can be seen in the graph underneath (created with STAFF: http://www.staff.oma.be/) displaying the electron flux in particle flux units (pfu; vertical axis - note the logarithmic scale!) for the period from 1 October 2017 till present (horizontal axis). The dashed line at 1000 pfu (1 pfu = 1 electron / cm2_s_sr) indicates an alert level used by NOAA/SWPC (https://www.swpc.noaa.gov/products/goes-electron-flux ), but other alert levels exist usually being based on total fluxes accumulated over 1 or 3 days ("fluence"). The red arrows indicate the effect of the three wind streams from the aforementioned coronal hole. In particular during last week (the last peak) the fluxes were very high, attaining values close to 90.000 pfu on 4 September, or 90 times above the alert level! Also, the daily electron fluence was above 1 billion electrons/day_cm2_sr from 2 till 4 September, i.e. at very high levels. No wonder then that satellite operators scrambled to their monitors keeping a very close eye on these energetic electron fluxes and their effects on the satellite fleet.
Review of solar and geomagnetic activity
SOLAR ACTIVITY
One active region, NOAA AR 2748 was visible, and this only at the beginning of the week. It decayed into a plage on September 4.
No flares were observed, no Earth-directed CMEs were detected and the greater than 10 MeV proton flux stayed at nominal levels.
An equatorial coronal hole with positive polarity crossed the central meridian on August 28. A second one in the southern hemisphere, with negative polarity, crossed the central meridian on September 3.
GEOMAGNETIC ACTIVITY
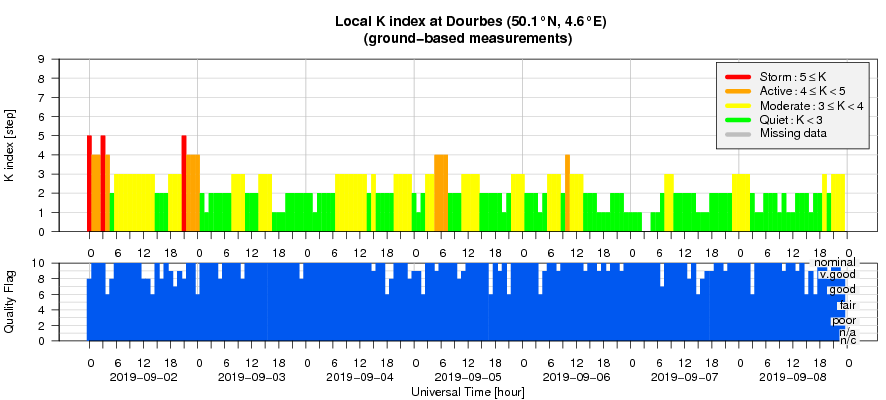
The fast solar wind from the positive polarity coronal hole reached Earth on August 31. Its speed was close to 750 km/s and its interplanetary magnetic fields reached 12 nT. Earth was exposed to a minor geomagnetic storm, both locally in Dourbes as on planetary level from August 31 to September 2 (K and Kp 5). This storm diminished to active conditions (K and Kp 4) on September 4-5.
PROBA2 Observations (2 Sep 2019 - 8 Sep 2019)
Solar Activity
Solar flare activity was very low during the week.
In order to view the activity of this week in more detail, we suggest to go to the following website from which all the daily (normal and difference) movies can be accessed: http://proba2.oma.be/ssa
This page also lists the recorded flaring events.
A weekly overview movie can be found here (SWAP week 493). http://proba2.oma.be/swap/data/mpg/movies/weekly_movies/weekly_movie_2019_09_02.mp4
Details about some of this week's events can be found further below.
If any of the linked movies are unavailable they can be found in the P2SC movie repository here http://proba2.oma.be/swap/data/mpg/movies/
Monday Sep 02
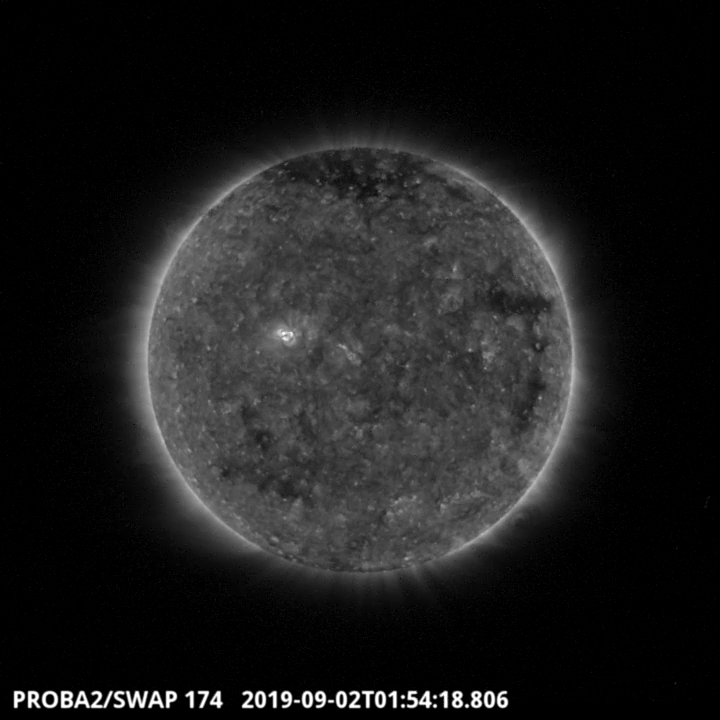
A coronal hole which is visible in the SWAP image of 2019-Sep-02 around 01:54UT near the Western limb. Find a movie of the day here (SWAP movie). http://proba2.oma.be/swap/data/mpg/movies/20190902_swap_movie.mp4
Monday Sep 02
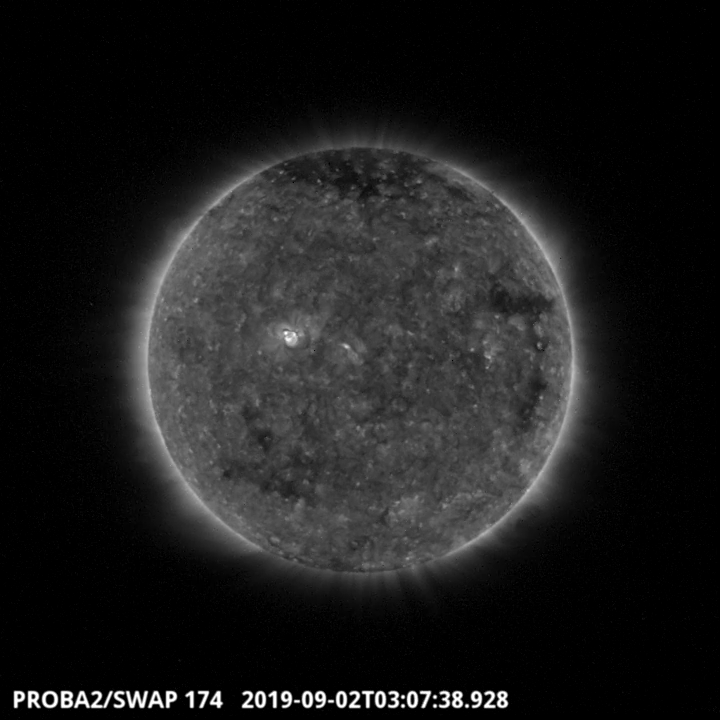
There was one small active region visible throughout the week, in the Northern hemisphere of the solar disk. It corresponds to the NOAA AR 12748 which emerged last week. Find a movie of the day here (SWAP movie). http://proba2.oma.be/swap/data/mpg/movies/20190902_swap_movie.mp4
Wednesday Sep 04
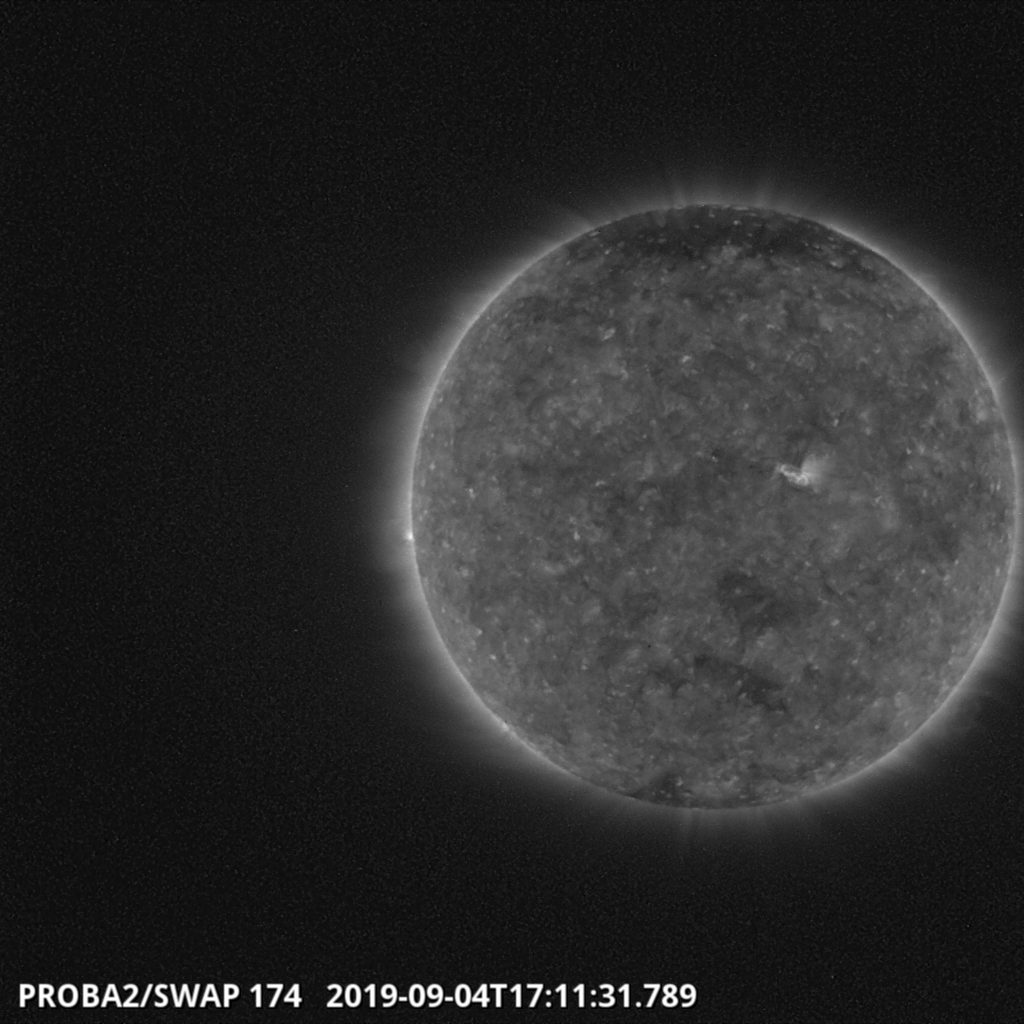
SWAP performed an off-point campaign through the last part of the week to support Parker Solar Probe WHISPR observations. A large coronal hole is visible on the Southern part disk of the SWAP image above.
The International Sunspot Number by SILSO
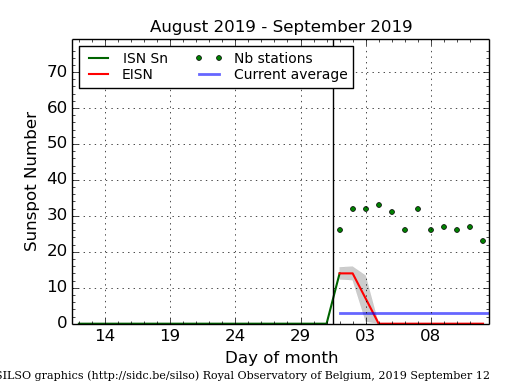
The daily Estimated International Sunspot Number (EISN, red curve with shaded error) derived by a simplified method from real-time data from the worldwide SILSO network. It extends the official Sunspot Number from the full processing of the preceding month (green line). The plot shows the last 30 days (about one solar rotation). The horizontal blue line shows the current monthly average, while the green dots give the number of stations included in the calculation of the EISN for each day.
Geomagnetic Observations at Dourbes (2 Sep 2019 - 8 Sep 2019)
The SIDC space weather Briefing
The Space Weather Briefing presented by the forecaster on duty from September 2 to 8. It reflects in images and graphs what is written in the Solar and Geomagnetic Activity report.
The pdf-version: http://www.stce.be/briefings/20190909_SWbriefing.pdf
The automatically running presentation: http://www.stce.be/briefings/20190909_SWbriefing.ppsm
Review of ionospheric activity (2 Sep 2019 - 8 Sep 2019)
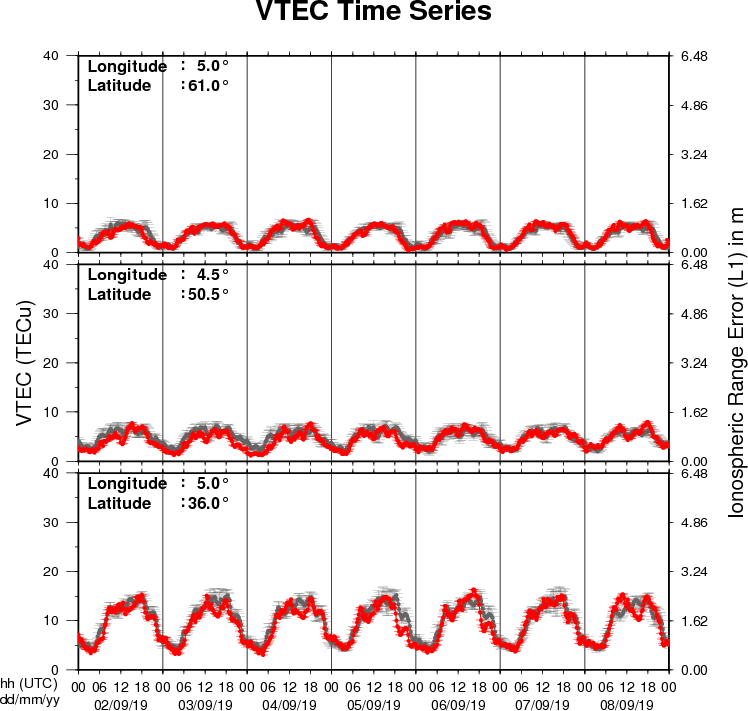
The figure shows the time evolution of the Vertical Total Electron Content (VTEC) (in red) during the last week at three locations:
a) in the northern part of Europe(N61°, 5°E)
b) above Brussels(N50.5°, 4.5°E)
c) in the southern part of Europe(N36°, 5°E)
This figure also shows (in grey) the normal ionospheric behaviour expected based on the median VTEC from the 15 previous days.
The VTEC is expressed in TECu (with TECu=10^16 electrons per square meter) and is directly related to the signal propagation delay due to the ionosphere (in figure: delay on GPS L1 frequency).
The Sun's radiation ionizes the Earth's upper atmosphere, the ionosphere, located from about 60km to 1000km above the Earth's surface.The ionization process in the ionosphere produces ions and free electrons. These electrons perturb the propagation of the GNSS (Global Navigation Satellite System) signals by inducing a so-called ionospheric delay.
See http://stce.be/newsletter/GNSS_final.pdf for some more explanations ; for detailed information, see http://gnss.be/ionosphere_tutorial.php