- Table of Content
- 1.50 years of Oz...
- 2.Review of sola...
- 3.PROBA2 Observa...
- 4.The internatio...
- 5.Review of geom...
- 6.Geomagnetic Ob...
- 7.The SIDC space...
- 8.Review of iono...
2. Review of solar activity
3. PROBA2 Observations (16 Sep 2019 - 22 Sep 2019)
4. The international Sunspot Number by SILSO
5. Review of geomagnetic activity
6. Geomagnetic Observations at Dourbes (16 Sep 2019 - 22 Sep 2019)
7. The SIDC space weather Briefing
8. Review of ionospheric activity (16 Sep 2019 - 22 Sep 2019)
50 years of Ozone soundings
On 17 and 18 September 2019, a meeting of the panel on the Assessment of Standard Operating Procedures for Ozone Sondes (ASOPOS) has been organized in Brussels by the STCE. This panel, consisting of around 15 ozone sonde experts worldwide, aims at providing more consistent standard operating procedures in the global ozone sonde network to obtain high quality data, comparable between ozone sounding stations at the uncertainty level of 5% (Z=0-30 km) and traceable to a common reference instrument. It also identifies the outstanding, partly unsolved, instrumental and procedural issues on ozone soundings. One of the major goals of the Brussels meeting was the preparation of an update of the current GAW (Global Atmospheric Watch of the World Meteorological Organisation) report on the Quality Assurance and Quality Control for Ozonesonde Measurements.
More on https://events.spacepole.be/event/67/overview
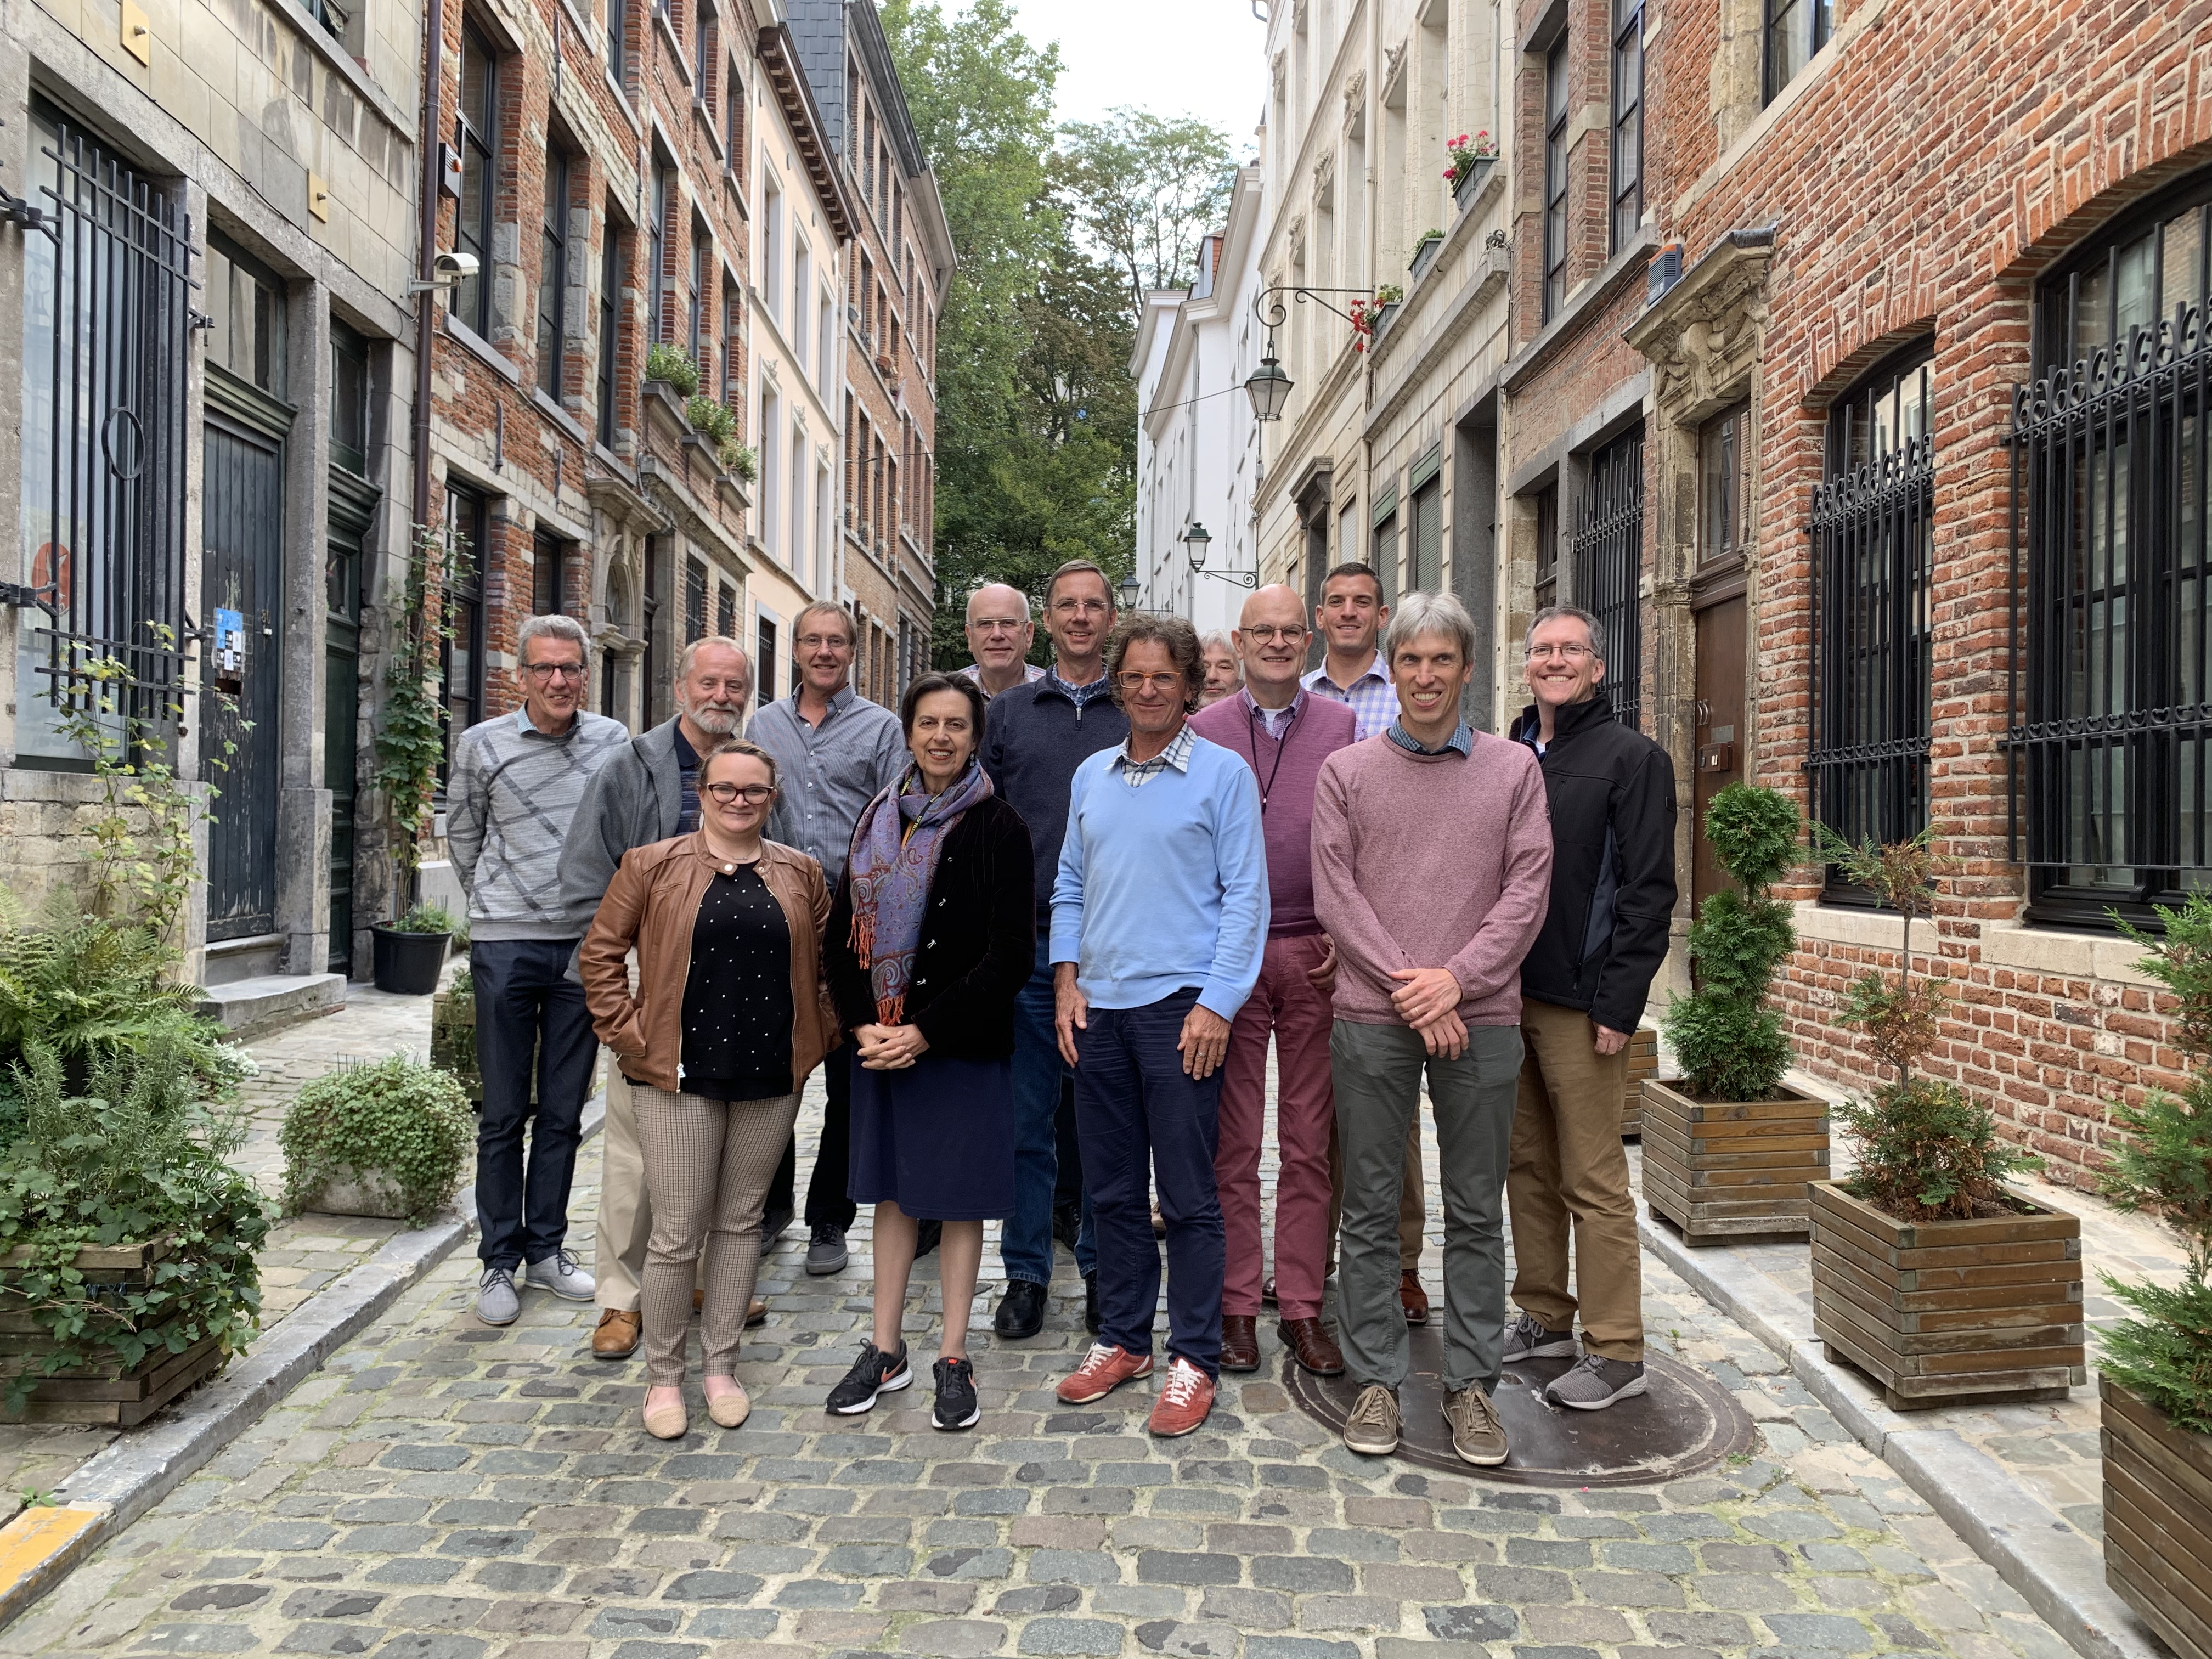
by Roeland Van Malderen
Review of solar activity
The solar disk was spotless and Solar X-ray flux remained below the B level.
A filament located near N30E05 was seen erupting in SDO/AIA 304 images on September 16 after 6:00UT. It was associated with a very narrow and slow CME. STEREO A COR2 saw it moving to the West. Corresponding SoHO/LASCO C2 and C3 coronagraph images show a slow and East directed CME. Based on these observations it was judged that the ejecta were sufficiently East of the Sun-Earth line.
An equatorial negative polarity coronal hole crossed the central meridian on September 20.
Another filament stretching from the central meridian towards the Eastern limb, and located South of the mentioned coronal hole, was seen to erupt in SDO/AIA 304 imagery from around 21:00UT on September 19. Corresponding STEREO/COR2 coronagraph data indicated a narrow and slow (300 km/s) CME, while SoHO/LASCO data did not show any clear signs of any (partial) halo CME. It was anticipated that possible effects from this slow CME would not be noticeable within the anticipated high speed stream from the coronal hole and no specific arrival forecast was made.
Proton levels were at background values throughout the week.
PROBA2 Observations (16 Sep 2019 - 22 Sep 2019)
Solar Activity
Solar flare activity was very low during the week.
In order to view the activity of this week in more detail, we suggest to go to the following website from which all the daily (normal and difference) movies can be accessed: http://proba2.oma.be/ssa
This page also lists the recorded flaring events.
A weekly overview movie can be found here (SWAP week 495). http://proba2.oma.be/swap/data/mpg/movies/weekly_movies/weekly_movie_2019_09_16.mp4
Details about some of this week's events can be found further below.
If any of the linked movies are unavailable they can be found in the P2SC movie repository here http://proba2.oma.be/swap/data/mpg/movies/
Friday Sep 20
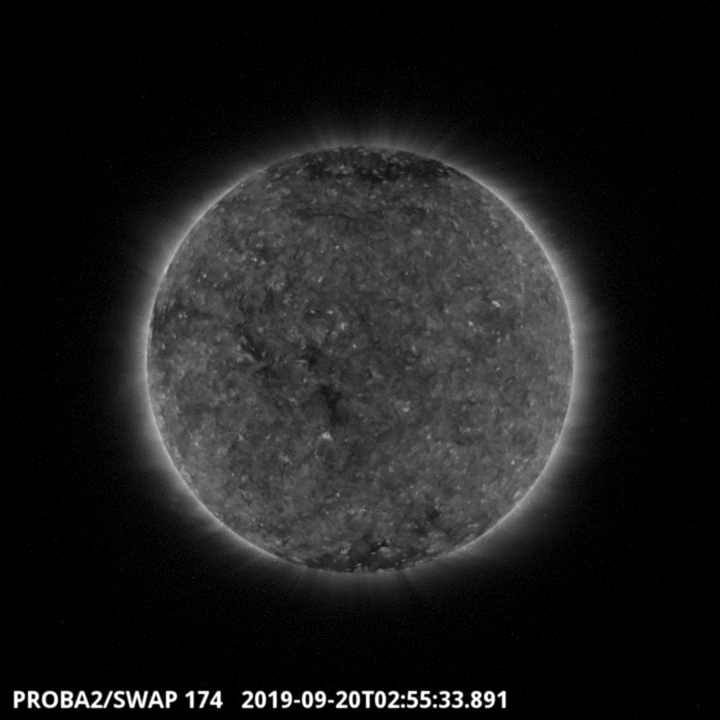
An equatorial coronal hole crossed the central meridian on September 20. It is visible in the SWAP image above as the small dark region near the center of the disk. Find a movie of the event here (SWAP movie) http://proba2.oma.be/swap/data/mpg/movies/20190920_swap_movie.mp4
The international Sunspot Number by SILSO
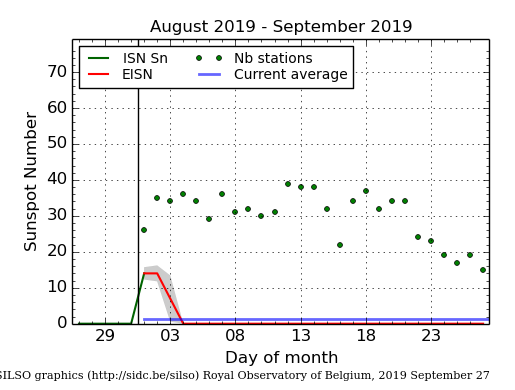
The daily Estimated International Sunspot Number (EISN, red curve with shaded error) derived by a simplified method from real-time data from the worldwide SILSO network. It extends the official Sunspot Number from the full processing of the preceding month (green line). The plot shows the last 30 days (about one solar rotation). The horizontal blue line shows the current monthly average, while the green dots give the number of stations included in the calculation of the EISN for each day.
Review of geomagnetic activity
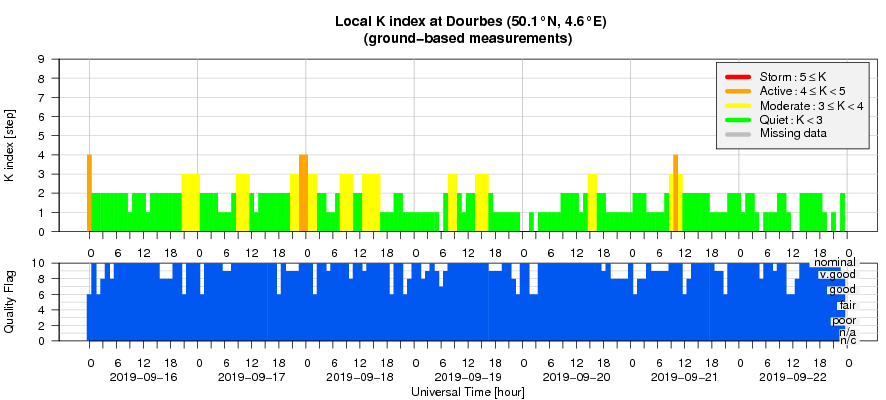
Solar wind was generally on decline with speed gradually decaying from around 450 km/s to around 300 km/s with two slight and brief increases around late September 17, and early September 21. Bz did not see any deep negative excursions. The magnetic field phi angle started the week in the negative sector. Since September 17, it was in the positive sector. Just before the end of the week although it jumped back into the negative sector.
The geomagnetic field was not disturbed except for the start of the week, when the slightly elevated solar wind speed induced some active periods.
Geomagnetic Observations at Dourbes (16 Sep 2019 - 22 Sep 2019)
The SIDC space weather Briefing
The Space Weather Briefing presented by the forecaster on duty from Sep 15 to 22. It reflects in images and graphs what is written in the Solar and Geomagnetic Activity report.
The pdf-version: http://www.stce.be/briefings/20190923_SWbriefing.pdf
The automatically running presentation: http://www.stce.be/briefings/20190923_SWbriefing.ppsm
Review of ionospheric activity (16 Sep 2019 - 22 Sep 2019)
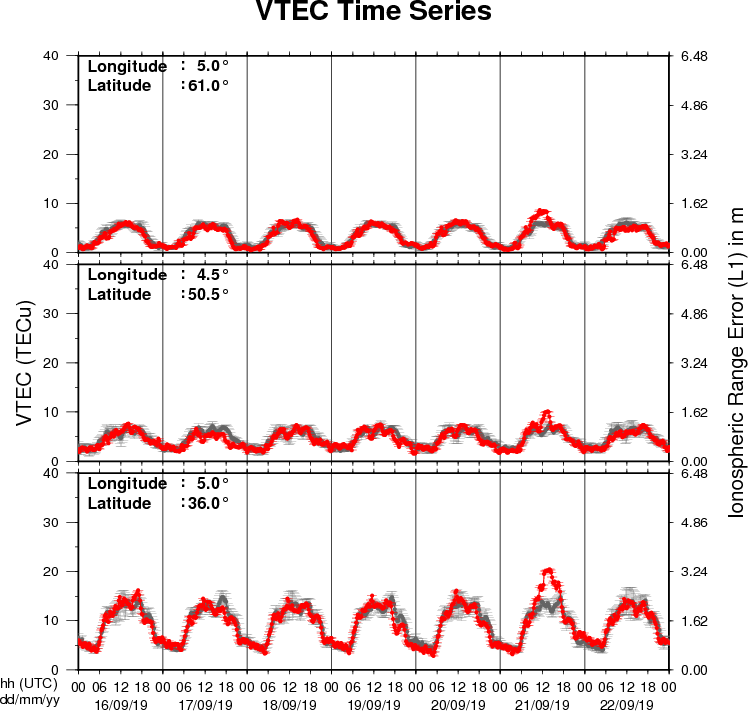
The figure shows the time evolution of the Vertical Total Electron Content (VTEC) (in red) during the last week at three locations:
a) in the northern part of Europe(N61°, 5°E)
b) above Brussels(N50.5°, 4.5°E)
c) in the southern part of Europe(N36°, 5°E)
This figure also shows (in grey) the normal ionospheric behaviour expected based on the median VTEC from the 15 previous days.
The VTEC is expressed in TECu (with TECu=10^16 electrons per square meter) and is directly related to the signal propagation delay due to the ionosphere (in figure: delay on GPS L1 frequency).
The Sun's radiation ionizes the Earth's upper atmosphere, the ionosphere, located from about 60km to 1000km above the Earth's surface.The ionization process in the ionosphere produces ions and free electrons. These electrons perturb the propagation of the GNSS (Global Navigation Satellite System) signals by inducing a so-called ionospheric delay.
See http://stce.be/newsletter/GNSS_final.pdf for some more explanations ; for detailed information, see http://gnss.be/ionosphere_tutorial.php