- Table of Content
- 1.A cat between ...
- 2.SWx Service Pr...
- 3.Review of sola...
- 4.PROBA2 Observa...
- 5.The Internatio...
- 6.Geomagnetic Ob...
- 7.The SIDC space...
- 8.Review of iono...
2. SWx Service Providers at ESWW2019
3. Review of solar and geomagnetic activity
4. PROBA2 Observations (23 Sep 2019 - 29 Sep 2019)
5. The International Sunspot Number by SILSO
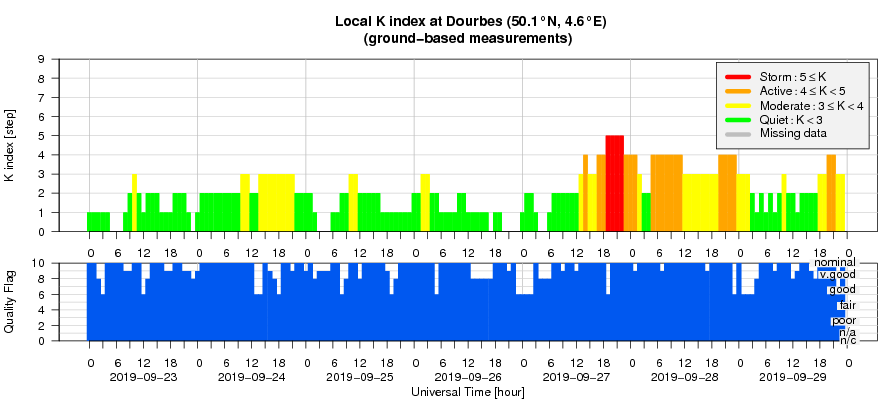
6. Geomagnetic Observations at Dourbes (23 Sep 2019 - 29 Sep 2019)
7. The SIDC space weather Briefing
8. Review of ionospheric activity (23 Sep 2019 - 29 Sep 2019)
A cat between the pigeons
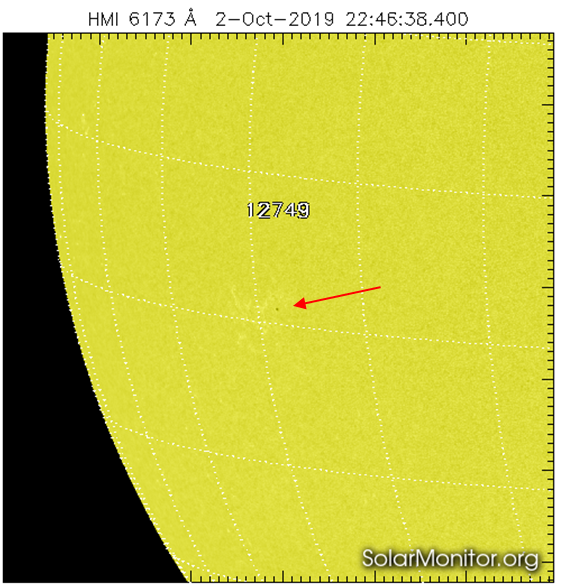
A small sunspot region appeared on 1 October near the Sun's east limb. The spots were barely visible and the region had nearly disappeared a day later (see SDO image underneath), but it lasted long enough to produce a small B-class flare. This active region NOAA 2749 belonged to the old solar cycle (SC24), as can be deduced from its low latitude (-9 degrees) and magnetic configuration.
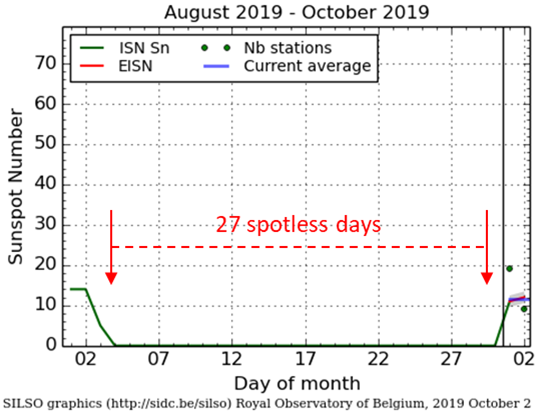
The sunspot group ended a stretch of 27 consecutive days without a single sunspot on the solar surface. Indeed, from 4 till 30 September, the Sun was blemishless and offered little excitement to solar observers (see SILSO graph underneath). This was the longest spotless period so far this solar cycle transition. Moreover, so far in 2019, the Sun was devoid of sunspots for 190 days. This makes it very likely that 2019 will accumulate more spotless days than 2018, and may even attempt to break the 265 days in 2008. That was one of the deepest cycle minima in a century, and it looks like the current transition is heading the same way. More graphs and details can be found on the Spotless Days page maintained by SILSO (http://sidc.oma.be/silso/spotless ).
SWx Service Providers at ESWW2019

Dear Space Weather Service Provider
This year’s tutorial is about service providers. If you have a great space weather service that you are eager to show and that people should start using, the tutorial is the place. The tutorial will take place on Monday morning, 18/11, 10:00-11:45. The practical organisation will depend on the number of submissions.
If you want to present your service, send the esww.loc@stce.be, by October 20, a simple email with a description of your service and how you would like to present it.
This call is also published online: http://www.stce.be/esww2019/tutorial.php
Curious for your service!
Elke and Petra
Our favourite cat about the concept ‘service’

Review of solar and geomagnetic activity
SOLAR ACTIVITY
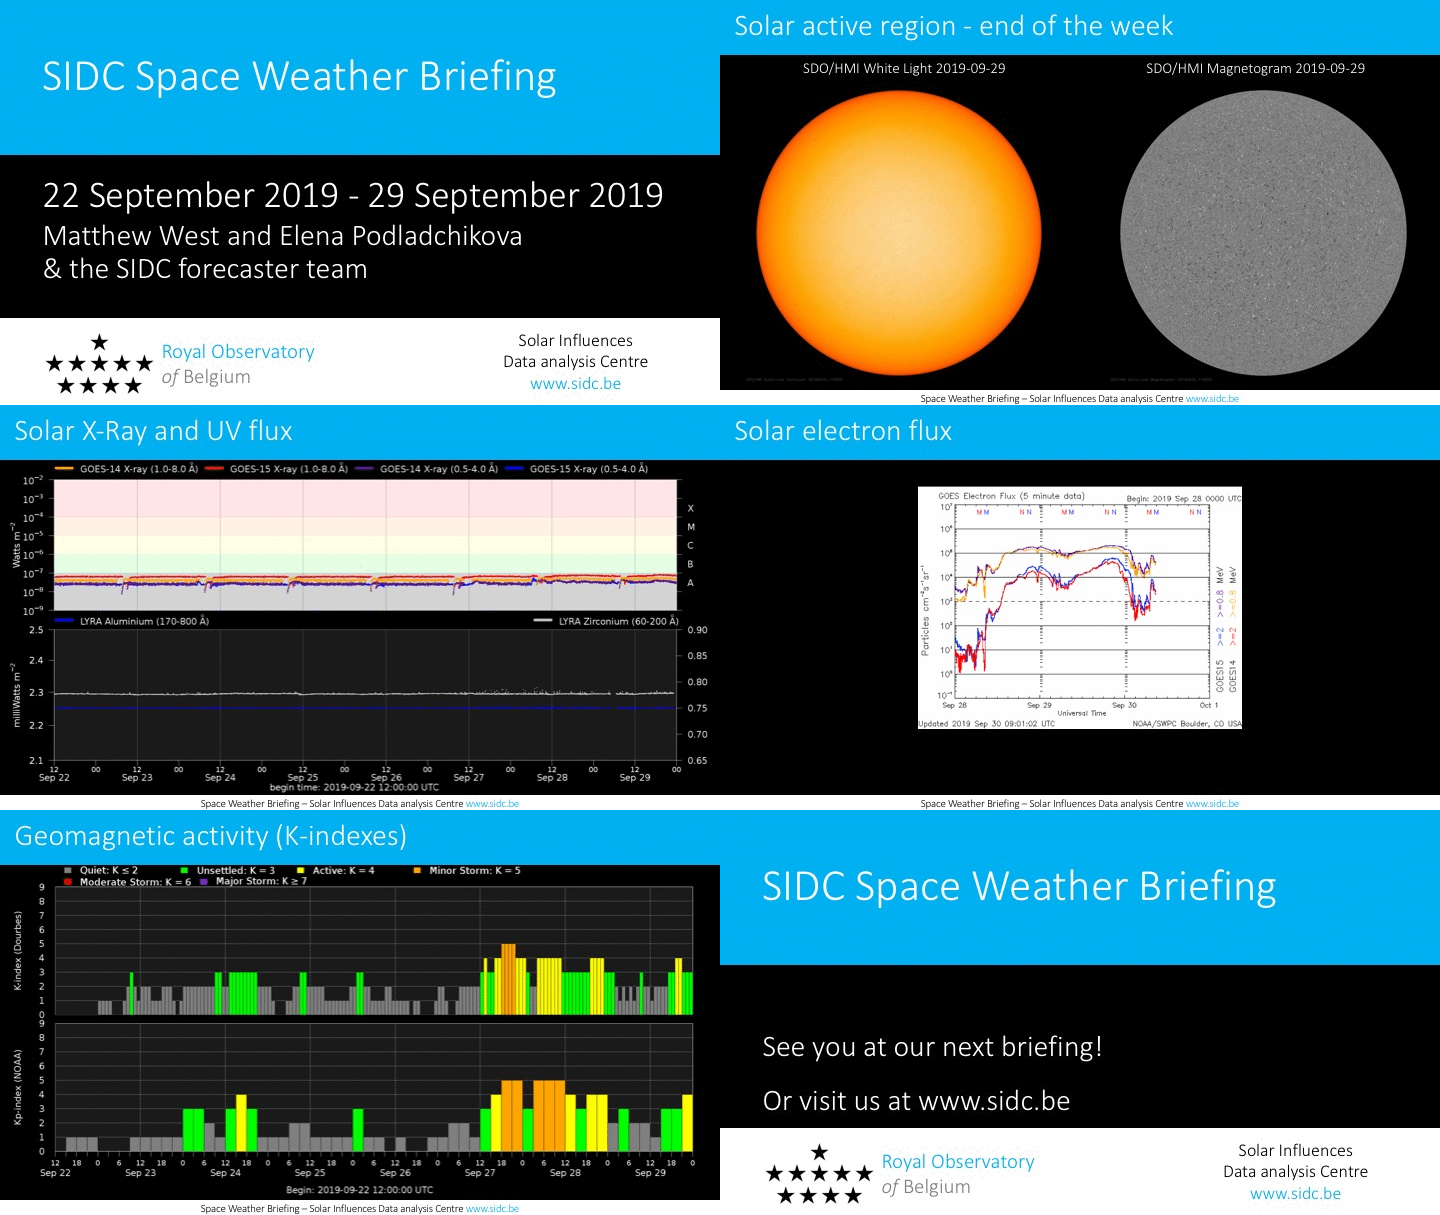
The solar disk was spotless and Solar X-ray flux remained below B class levels.
There were no Earth-directed Coronal Mass Ejections (CME) observed in coronagraph data.
A large equatorial positive polarity coronal hole crossed the central meridian on Sep-25.
Proton levels were at background values.
GEOMAGNETIC ACTIVITY
The solar wind speed began the week at nominal levels before increasing to around 500 km/s on 24-Sep due to the arrival of a High Speed Stream (HSS) from a small low latitude coronal hole (CH). The solar wind speed returned to nominal levels before encountering a second HSS on 27-Sep, from a recurrent positive polarity CH, which increased solar wind speeds to 700 km/s. The second HSS created Bz values of -10 nT. The magnetic field phi angle was mainly in the positive sector, with a few short periods in the negative sector.
Geomagnetic conditions were initially quiet, reaching 4 on 24-Sep, due to the arrival of the first HSS. However they increased on 27-Sep with the arrival of the second HSS, creating active and minor storm conditions, with kp 5 reached several times throughout 27-Sep.
PROBA2 Observations (23 Sep 2019 - 29 Sep 2019)
Solar Activity
Solar flare activity remained very low during the week.
In order to view the activity of this week in more detail, we suggest to go to the following website from which all the daily (normal and difference) movies can be accessed: http://proba2.oma.be/ssa
This page also lists the recorded flaring events.
A weekly overview movie can be found here (SWAP week 496): http://proba2.oma.be/swap/data/mpg/movies/weekly_movies/weekly_movie_2019_09_23.mp4
Details about some of this week's events can be found further below.
If any of the linked movies are unavailable they can be found in the P2SC movie repository here: http://proba2.oma.be/swap/data/mpg/movies/
Wednesday Sep 25
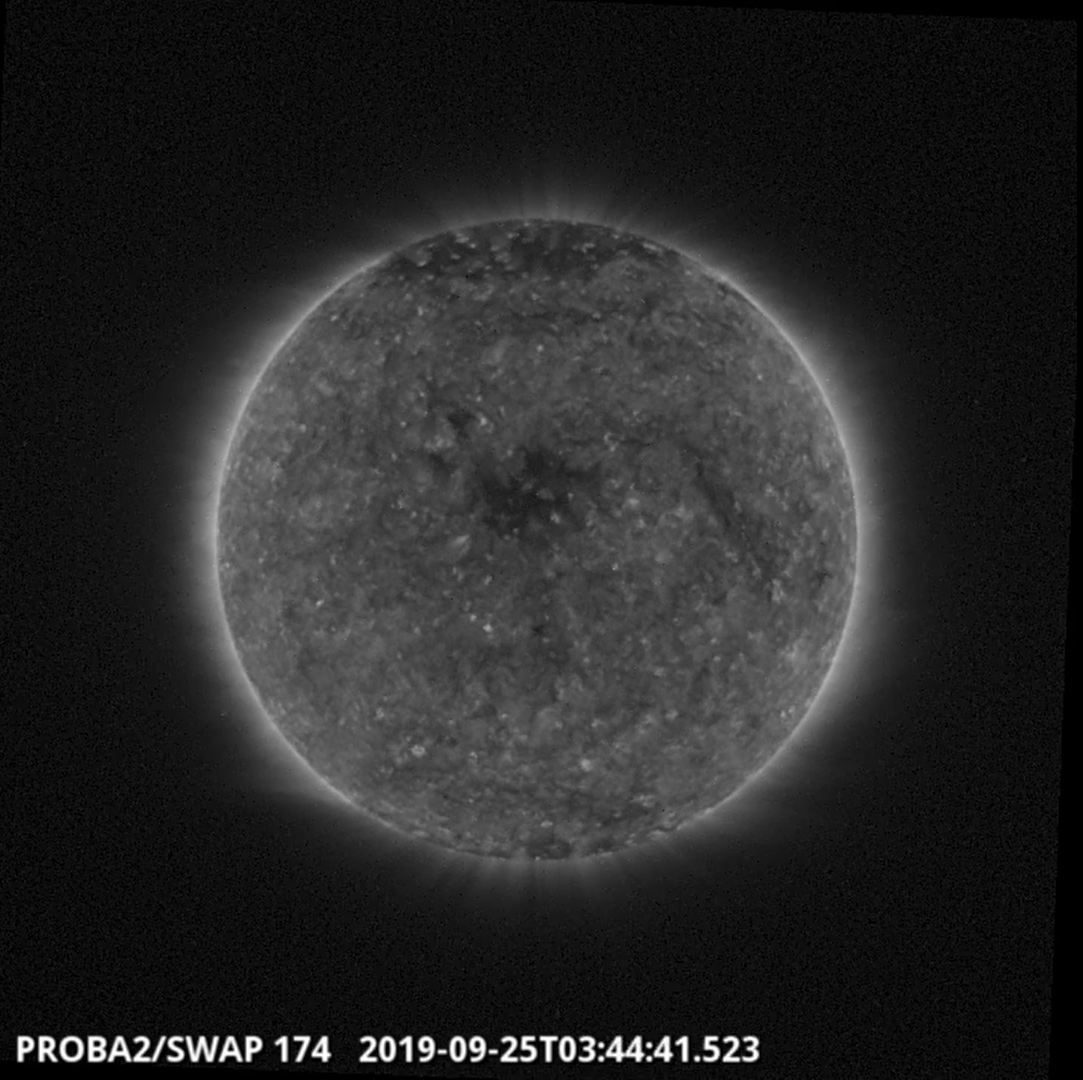
A large, low-latitude coronal hole of positive polarity was observed by SWAP as it crossed the central meridian on 2019-Sep-25.
Find a movie of the day here (SWAP movie): http://proba2.oma.be/swap/data/mpg/movies/20190925_swap_movie.mp4
The International Sunspot Number by SILSO
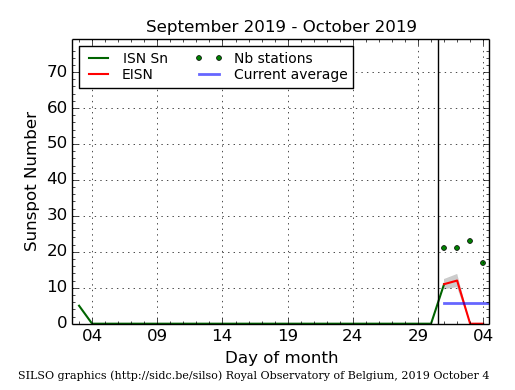
The daily Estimated International Sunspot Number (EISN, red curve with shaded error) derived by a simplified method from real-time data from the worldwide SILSO network. It extends the official Sunspot Number from the full processing of the preceding month (green line). The plot shows the last 30 days (about one solar rotation). The horizontal blue line shows the current monthly average, while the green dots give the number of stations included in the calculation of the EISN for each day.
The SIDC space weather Briefing
The Space Weather Briefing presented by the forecaster on duty from Sept 22 to 29. It reflects in images and graphs what is written in the Solar and Geomagnetic Activity report.
The pdf-version: http://www.stce.be/briefings/20190930_SWbriefing.pdf
The automatically running presentation: http://www.stce.be/briefings/20190930_SWbriefing.ppsm
Review of ionospheric activity (23 Sep 2019 - 29 Sep 2019)
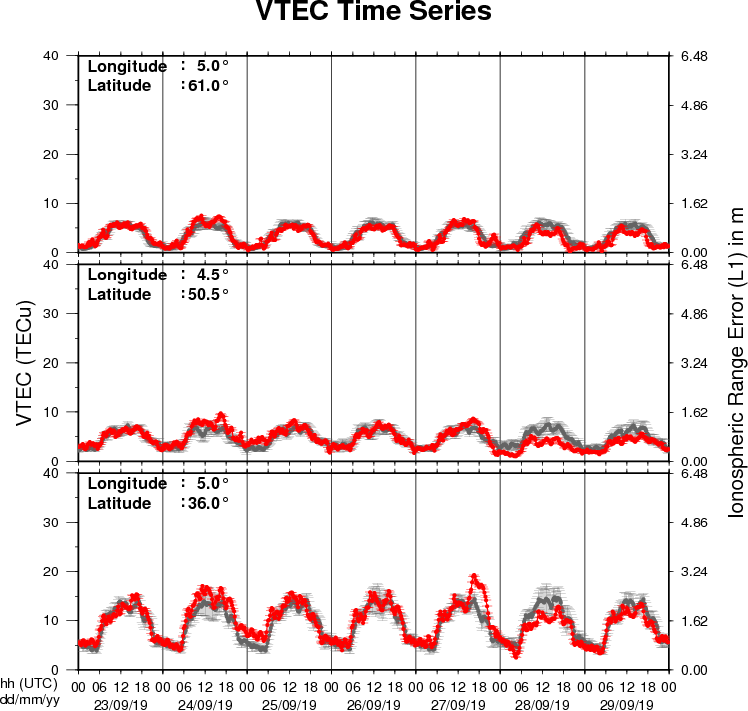
The figure shows the time evolution of the Vertical Total Electron Content (VTEC) (in red) during the last week at three locations:
a) in the northern part of Europe(N61°, 5°E)
b) above Brussels(N50.5°, 4.5°E)
c) in the southern part of Europe(N36°, 5°E)
This figure also shows (in grey) the normal ionospheric behaviour expected based on the median VTEC from the 15 previous days.
The VTEC is expressed in TECu (with TECu=10^16 electrons per square meter) and is directly related to the signal propagation delay due to the ionosphere (in figure: delay on GPS L1 frequency).
The Sun's radiation ionizes the Earth's upper atmosphere, the ionosphere, located from about 60km to 1000km above the Earth's surface.The ionization process in the ionosphere produces ions and free electrons. These electrons perturb the propagation of the GNSS (Global Navigation Satellite System) signals by inducing a so-called ionospheric delay.
See http://stce.be/newsletter/GNSS_final.pdf for some more explanations ; for detailed information, see http://gnss.be/ionosphere_tutorial.php
