- Table of Content
- 1.European appro...
- 2.Review of sola...
- 3.PROBA2 Observa...
- 4.The Internatio...
- 5.Geomagnetic Ob...
- 6.the SIDC space...
- 7.Review of iono...
2. Review of solar activity
3. PROBA2 Observations (30 Sep 2019 - 6 Oct 2019)
4. The International Sunspot Number by SILSO
5. Geomagnetic Observations at Dourbes (30 Sep 2019 - 6 Oct 2019)
6. the SIDC space weather Briefing (30 Sep 2019 - 6 Oct 2019)
7. Review of ionospheric activity (30 Sep 2019 - 6 Oct 2019)
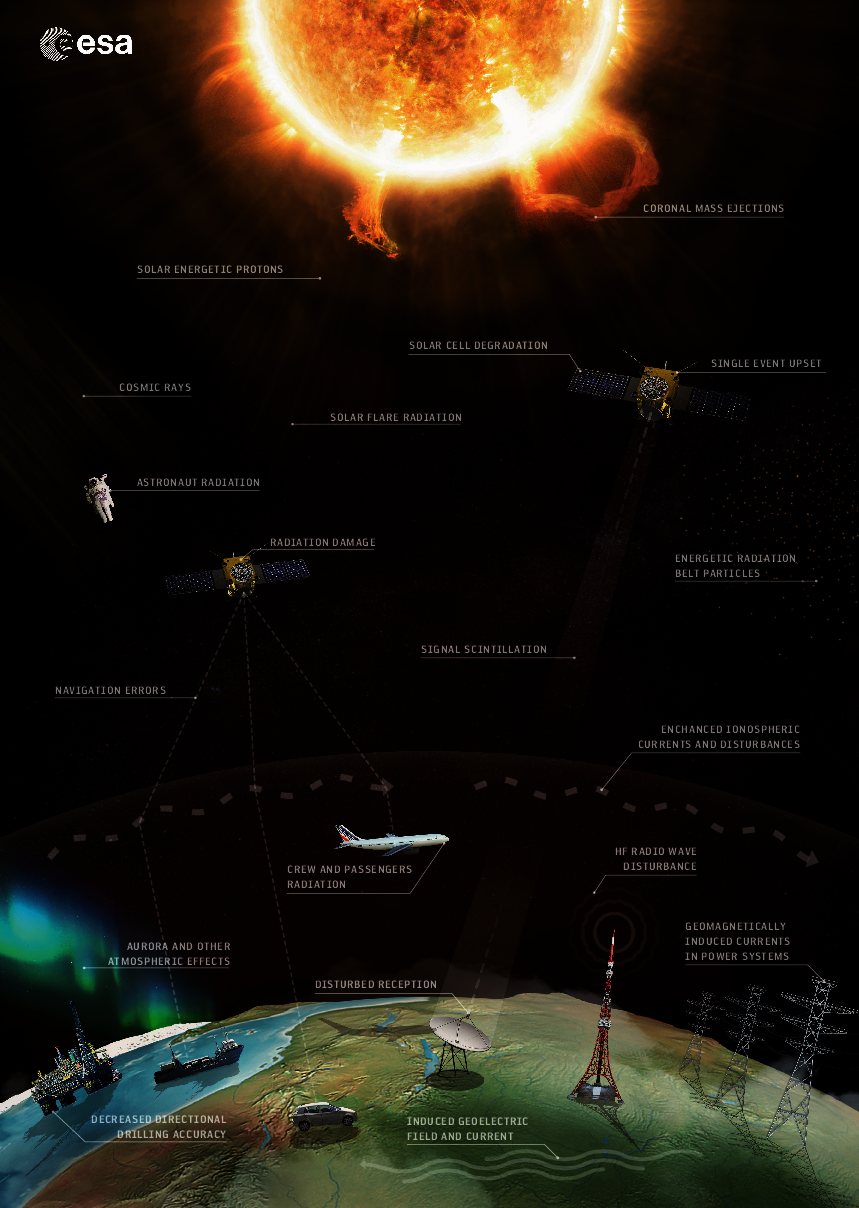
European approach to Space Weather
A special report from international experts was released on October 10, 2019, to explain the challenges of space weather and provide a set of recommendations against space weather radiation hazards.
Space weather refers to the environmental conditions in space as influenced by solar activity. To prevent radiation hazards on satellites and spacecrafts and health risks for astronautes, a thorough knowledge of space weather is of high importance.
The report, spearheaded by the European Science Foundation’s European Space Science Committee, is directed to the European Space Agency (ESA), the European Union (EU) and their respective member states. It highlights the need of strong coordination between members states and European bodies and organisation.
David Berghmans (STCE), is co-author of the report. You can read it on: https://www.swsc-journal.org/articles/swsc/abs/2019/01/swsc190036/swsc190036.html
Press release of the European Science Foundation: http://www.esf.org/news-media/news-press-releases/article/how-can-europe-explore-further-understand-more-and-prepare-better-for-adverse-space-weather-effects/
Review of solar activity
SOLAR ACTIVITY
Solar activity was very low. A small but inactive sunspot (NOAA Active Region 2749) was visible on the solar disk on 1 and 2 October, ending a 27 days spotless stretch.
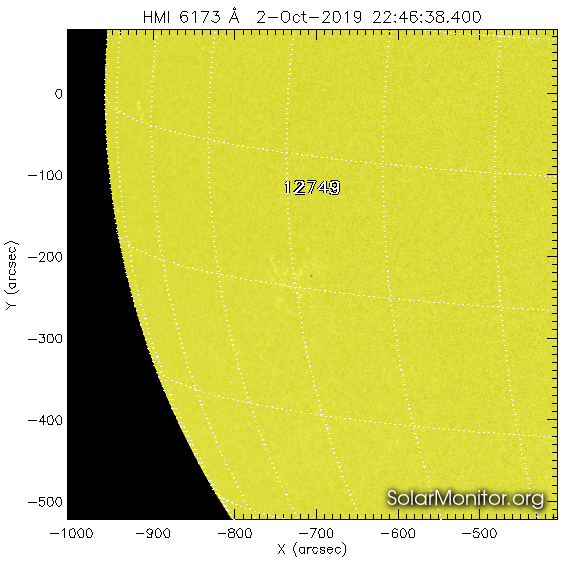
No earth-directed coronal mass ejections (CMEs) have been observed in available coronagraphic imagery. The greater than 10 MeV proton flux was at nominal values.
A patchy negative polarity coronal hole in the southern solar hemisphere transited the central meridian on 30 September.
GEOMAGNETIC ACTIVITY
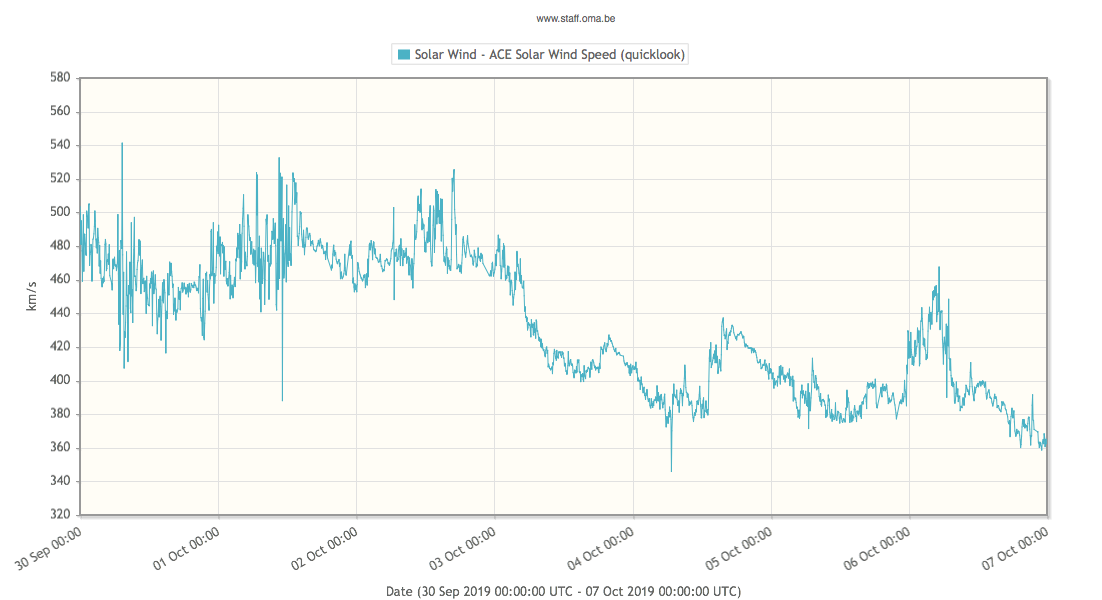
Solar wind speed ranged between 360 and 520 km/s, being in the upper half of this range until early on 4 October, and ending the week near 400 km/s (see ACE data in the graph above). During the first half of the week, solar wind was dominated by the waning wind stream from a positive polarity coronal hole. From 4 October onwards, solar wind parameters were indicative of a weaker and more variable wind stream, with intermittent and weak contributions from the patchy negative polarity coronal hole (see 'Solar Activity'). The interplanetary magnetic field (phi angle) was directed mostly away from the Sun (positive sector) until early on 4 October, after which it became more variable with the positive sector dominating. Bz varied between -8 and +7 nT, with relatively weak periods from noon on 1 October till early on 4 October.
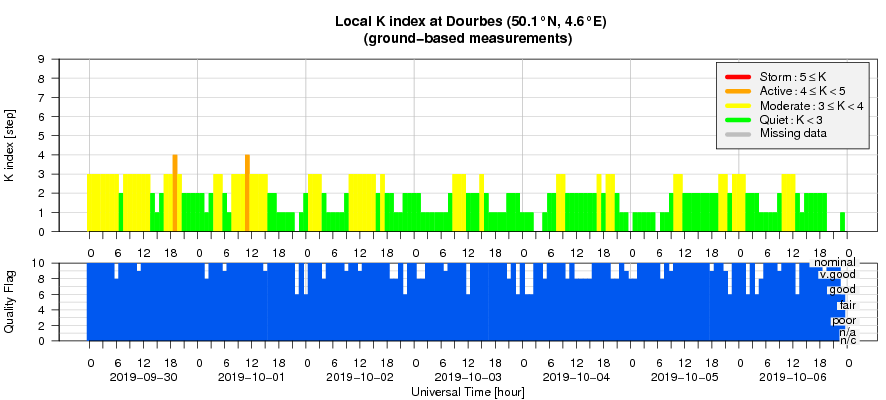
Geomagnetic activity ranged from quiet to active conditions, with the active episodes occurring during the enhanced solar wind conditions early in the week, i.e. on 30 September and 1 October.
PROBA2 Observations (30 Sep 2019 - 6 Oct 2019)
Solar Activity
Solar flare activity was very low during the week.
In order to view the activity of this week in more detail, we suggest to go to the following website from which all the daily (normal and difference) movies can be accessed: http://proba2.oma.be/ssa
This page also lists the recorded flaring events.
A weekly overview movie can be found here (SWAP week 497). http://proba2.oma.be/swap/data/mpg/movies/weekly_movies/weekly_movie_2019_09_30.mp4
Details about some of this week's events can be found further below.
If any of the linked movies are unavailable they can be found in the P2SC movie repository here
http://proba2.oma.be/swap/data/mpg/movies/
Monday Sep 30
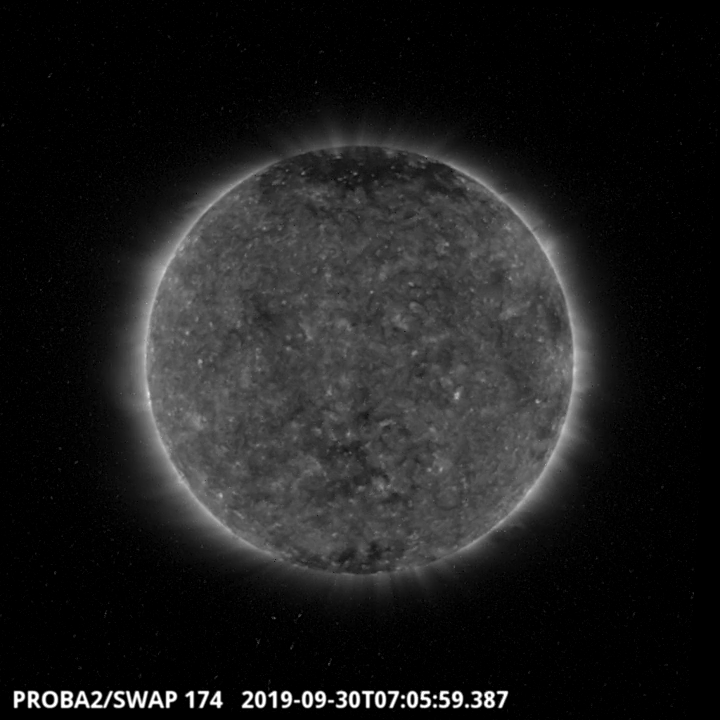
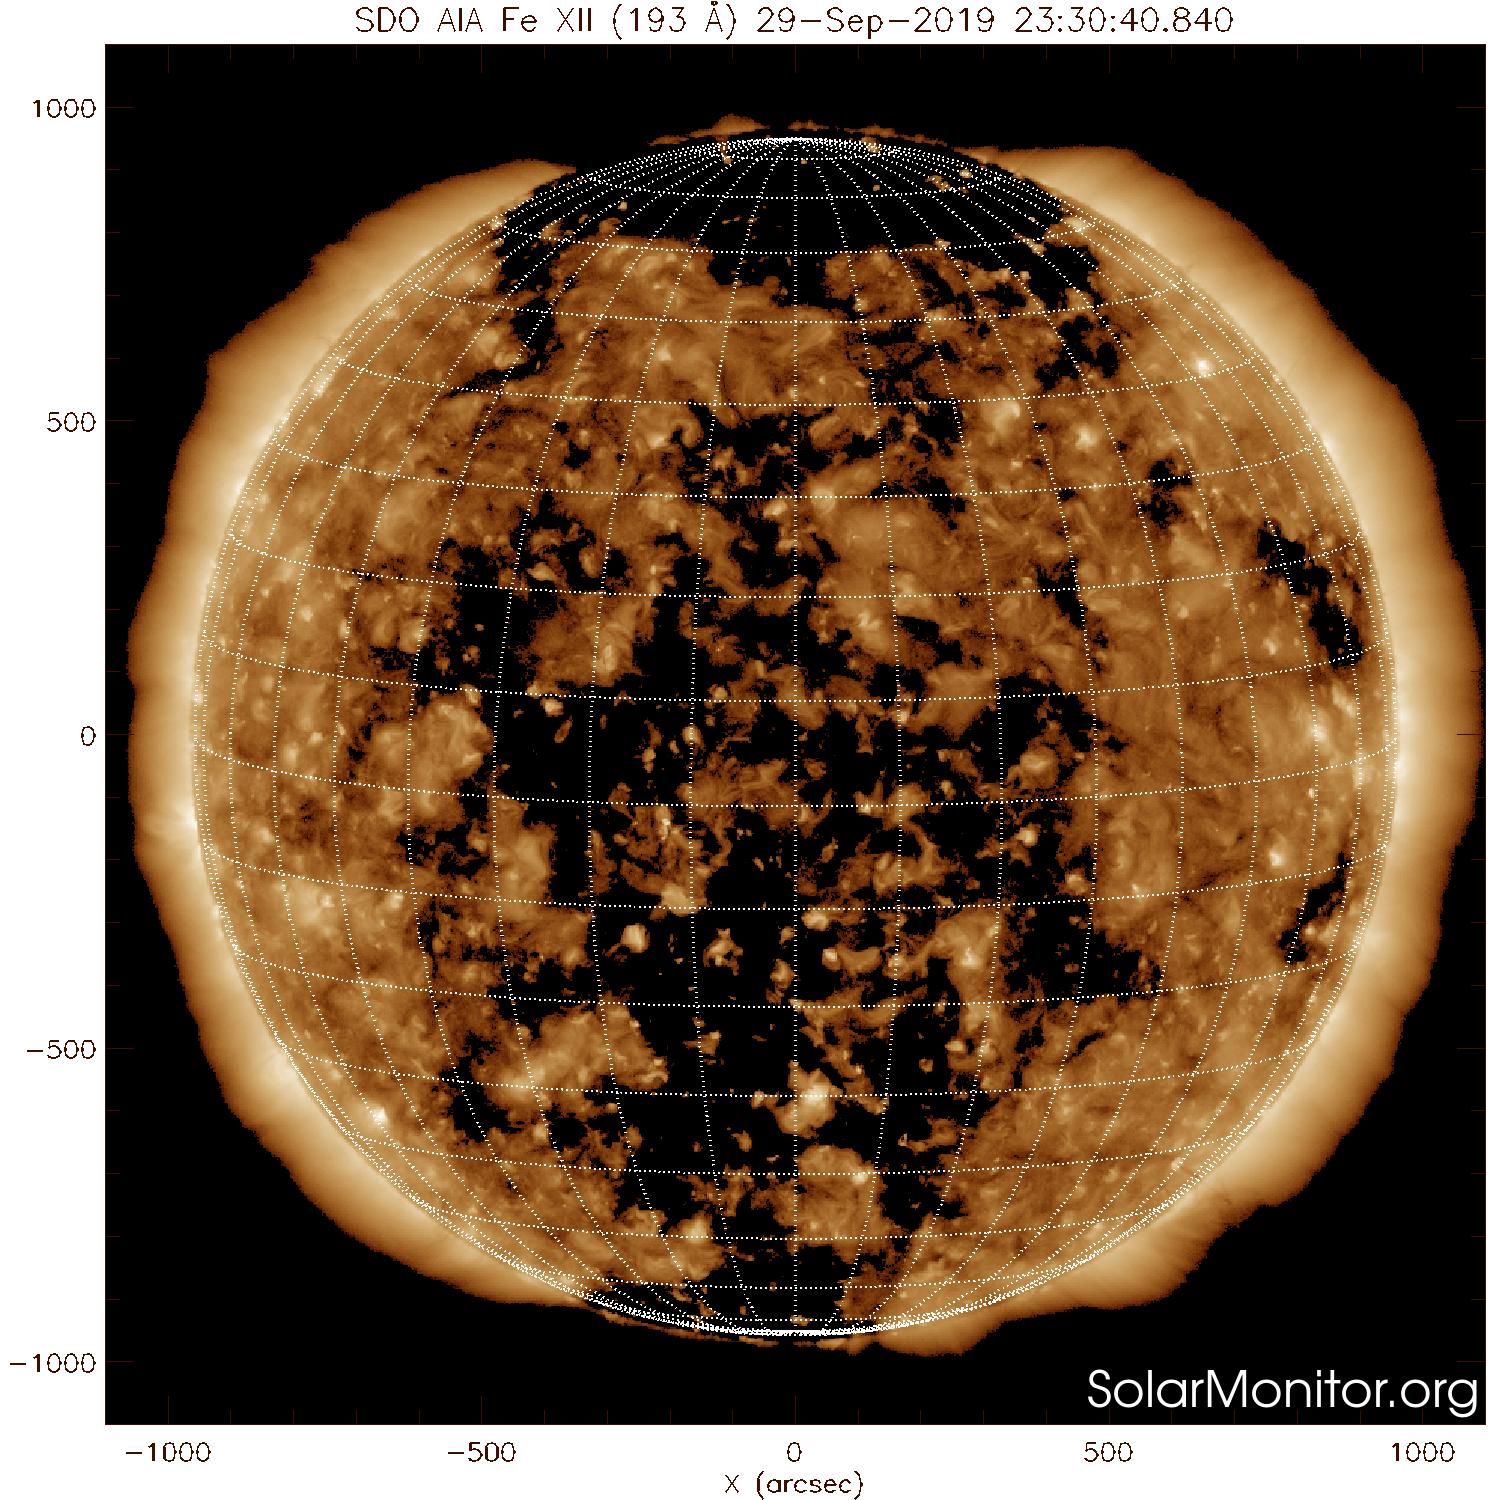
A patchy coronal hole crossed the central meridian on September 30. It is visible in the SWAP image above as a patchy dark region towards the south of the solar disk. Find a movie of the event here (SWAP movie) http://proba2.oma.be/swap/data/mpg/movies/20190930_swap_movie.mp4
Tuesday Oct 01
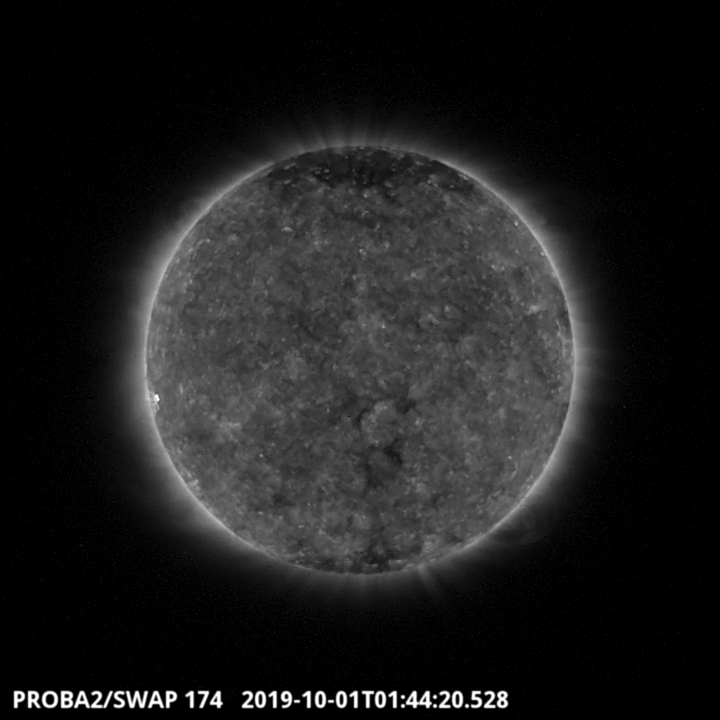
The only active region of the week is visible in the east part of the disk. It corresponds to the NOAA 2749 sunspot group which gave rise to a B1.6 class flare around 1:44 UT. Find a movie of the event here (SWAP movie) http://proba2.oma.be/swap/data/mpg/movies/20191001_swap_movie.mp4
The International Sunspot Number by SILSO
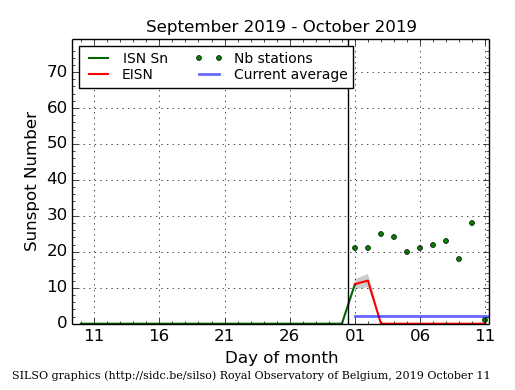
The daily Estimated International Sunspot Number (EISN, red curve with shaded error) derived by a simplified method from real-time data from the worldwide SILSO network. It extends the official Sunspot Number from the full processing of the preceding month (green line). The plot shows the last 30 days (about one solar rotation). The horizontal blue line shows the current monthly average, while the green dots give the number of stations included in the calculation of the EISN for each day.
Geomagnetic Observations at Dourbes (30 Sep 2019 - 6 Oct 2019)
the SIDC space weather Briefing (30 Sep 2019 - 6 Oct 2019)
The Space Weather Briefing presented by the forecaster on duty from Sept 29 to Oct 6. It reflects in images and graphs what is written in the Solar and Geomagnetic Activity report.
The pdf-version: http://www.stce.be/briefings/20191007_SWbriefing.pdf
The automatically running presentation: http://www.stce.be/briefings/20191007_SWbriefing.ppsm
Review of ionospheric activity (30 Sep 2019 - 6 Oct 2019)
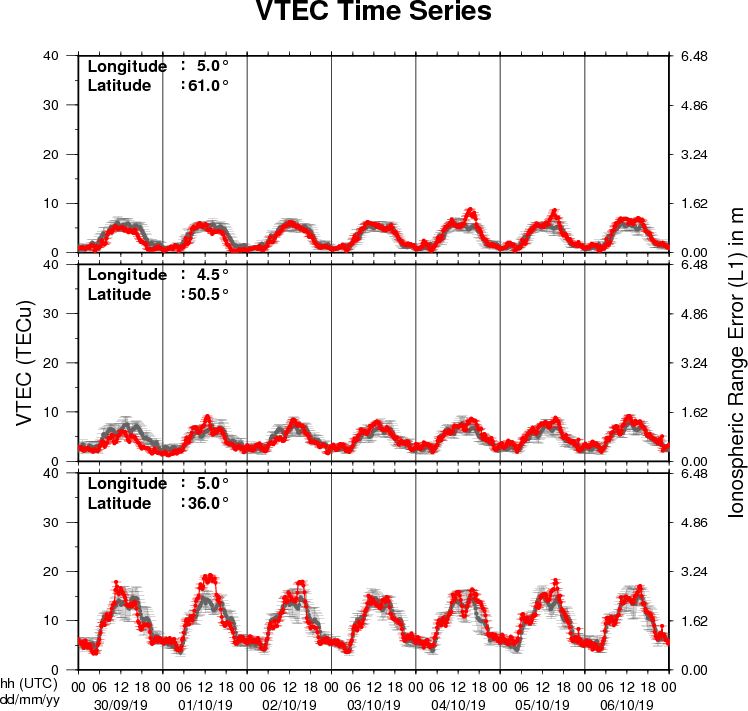
The figure shows the time evolution of the Vertical Total Electron Content (VTEC) (in red) during the last week at three locations:
a) in the northern part of Europe(N61°, 5°E)
b) above Brussels(N50.5°, 4.5°E)
c) in the southern part of Europe(N36°, 5°E)
This figure also shows (in grey) the normal ionospheric behaviour expected based on the median VTEC from the 15 previous days.
The VTEC is expressed in TECu (with TECu=10^16 electrons per square meter) and is directly related to the signal propagation delay due to the ionosphere (in figure: delay on GPS L1 frequency).
The Sun's radiation ionizes the Earth's upper atmosphere, the ionosphere, located from about 60km to 1000km above the Earth's surface.The ionization process in the ionosphere produces ions and free electrons. These electrons perturb the propagation of the GNSS (Global Navigation Satellite System) signals by inducing a so-called ionospheric delay.
See http://stce.be/newsletter/GNSS_final.pdf for some more explanations ; for detailed information, see http://gnss.be/ionosphere_tutorial.php