- Table of Content
- 1.Sunspots need ...
- 2.Review of sola...
- 3.PROBA2 Observa...
- 4.The Internatio...
- 5.Geomagnetic Ob...
- 6.The SIDC space...
- 7.Review of iono...
2. Review of solar and geomagnetic activity
3. PROBA2 Observations (14 Oct 2019 - 20 Oct 2019)
4. The International Sunspot Number by SILSO
5. Geomagnetic Observations at Dourbes (14 Oct 2019 - 20 Oct 2019)
6. The SIDC space weather Briefing
7. Review of ionospheric activity (14 Oct 2019 - 20 Oct 2019)
Sunspots need YOU
Val-u-Sun citizen science project needs citizens to be part of scientific research
Maybe you have already heard of sunspots. Basically, they're just dark, 'cold' spots on the surface of the Sun. But did you know that observers around the globe have been observing and drawing them by hand for more than 400 years and still continue to do so ? One might wonder why we, in our digital modern era still do it the old fashioned-way, with a pencil and a paper sheet. The answer is continuity. We keep the same method to be able to compare observations from the past with modern observations. This gives one of the longest scientific data archives in the history of science since Galileo started it more than 400 years ago !
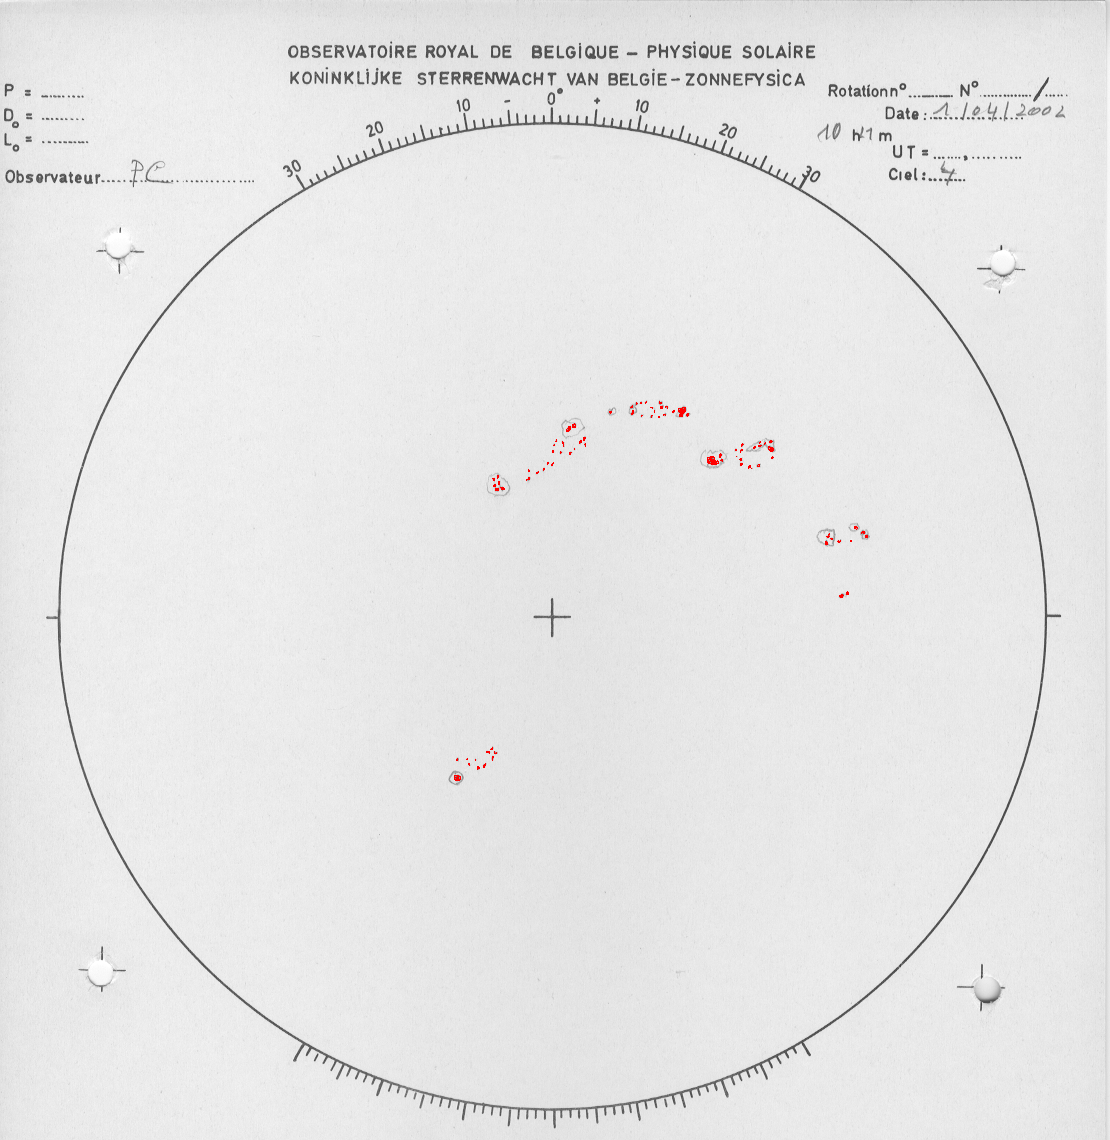
You can help us by counting sunspots on the original drawings from our archive: http://sidc.be/valusun/citizenscience/index.php
Review of solar and geomagnetic activity
SOLAR ACTIVITY
There were no sunspots on the visible side of the Sun. No flares were recorded. The GOES X-ray flux background was around A7-A8 level. No Earth-directed CMEs were detected in coronograph imagery. The greater than 10 MeV proton flux was at nominal level.
GEOMAGNETIC ACTIVITY
The solar wind as registered by ACE was at nominal level, with the solar wind speed between about 310 and 460 km/s and a magnitude of the Interplanetary Magnetic Field between about 0 and 9 nT.
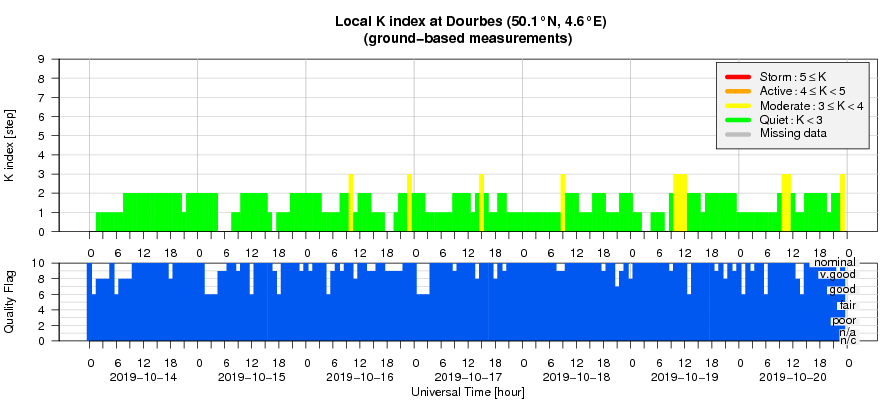
Quiet to unsettled geomagnetic levels were registered (K Dourbes and NOAA Kp smaller than 4).
PROBA2 Observations (14 Oct 2019 - 20 Oct 2019)
Solar Activity
Solar flare activity was very low during the week.
In order to view the activity of this week in more detail, we suggest to go to the following website from which all the daily (normal and difference) movies can be accessed: http://proba2.oma.be/ssa
This page also lists the recorded flaring events.
A weekly overview movie can be found here (SWAP week 499).
https://proba2.sidc.be/swap/data/mpg/movies/weekly_movies/weekly_movie_2019_10_14.mp4
Details about some of this week's events can be found further below.
If any of the linked movies are unavailable they can be found in the P2SC movie repository here
http://proba2.oma.be/swap/data/mpg/movies/
Monday Oct 17
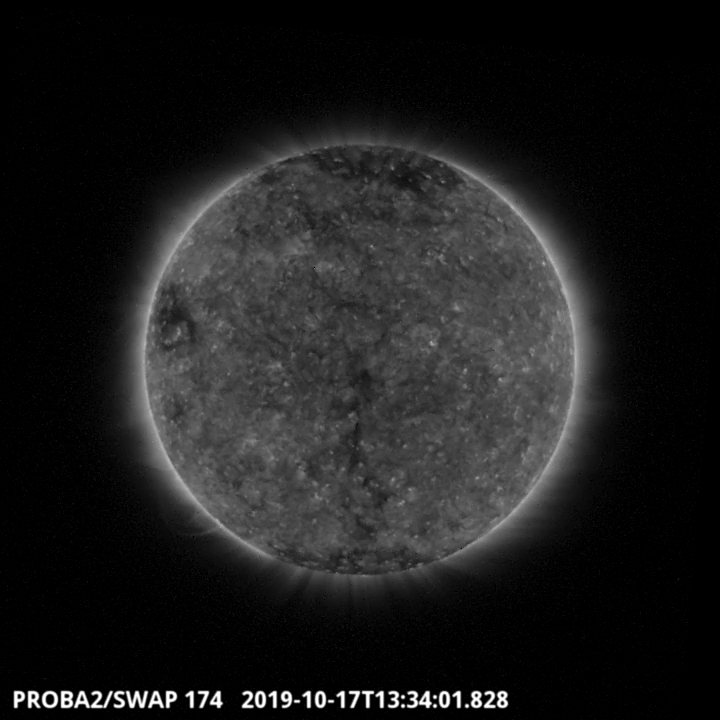
An extended southern coronal hole crossed the central meridian on October 17 and another coronal hole appeared in the North-West part of the Solar disk. They are visible in the SWAP image above. Find a movie of the event here (SWAP movie) https://proba2.sidc.be/swap/data/mpg/movies/20191017_swap_movie.mp4
The International Sunspot Number by SILSO
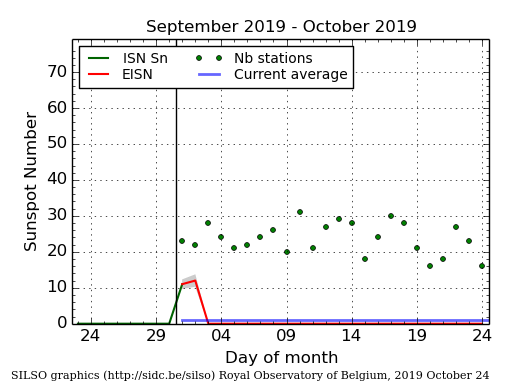
The daily Estimated International Sunspot Number (EISN, red curve with shaded error) derived by a simplified method from real-time data from the worldwide SILSO network. It extends the official Sunspot Number from the full processing of the preceding month (green line). The plot shows the last 30 days (about one solar rotation). The horizontal blue line shows the current monthly average, while the green dots give the number of stations included in the calculation of the EISN for each day.
Geomagnetic Observations at Dourbes (14 Oct 2019 - 20 Oct 2019)
The SIDC space weather Briefing
The Space Weather Briefing presented by the forecaster on duty from Oct 13 to 20. It reflects in images and graphs what is written in the Solar and Geomagnetic Activity report.
The pdf-version: http://www.stce.be/briefings/20191021_SWbriefing.pdf
The automatically running presentation: http://www.stce.be/briefings/20191021_SWbriefing.ppsm
Review of ionospheric activity (14 Oct 2019 - 20 Oct 2019)
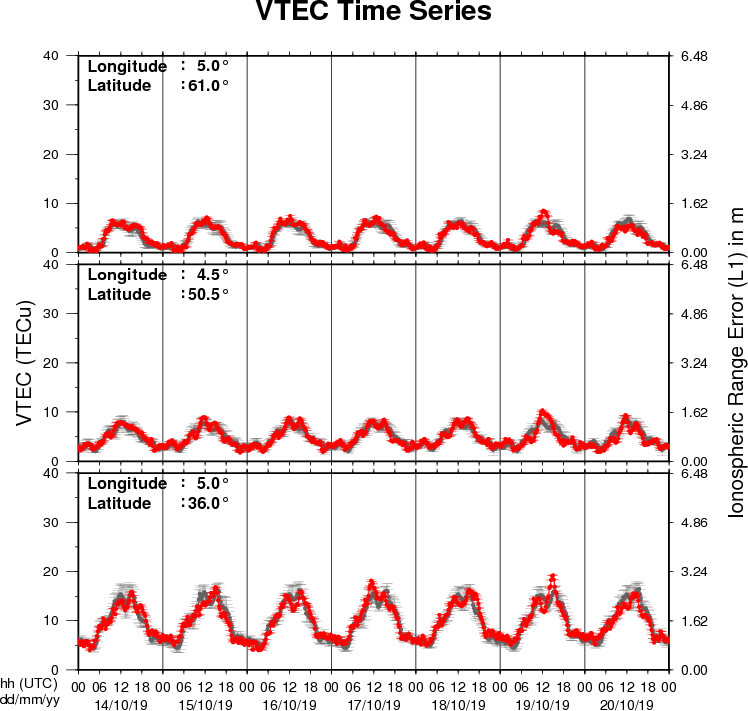
The figure shows the time evolution of the Vertical Total Electron Content (VTEC) (in red) during the last week at three locations:
a) in the northern part of Europe(N61°, 5°E)
b) above Brussels(N50.5°, 4.5°E)
c) in the southern part of Europe(N36°, 5°E)
This figure also shows (in grey) the normal ionospheric behaviour expected based on the median VTEC from the 15 previous days.
The VTEC is expressed in TECu (with TECu=10^16 electrons per square meter) and is directly related to the signal propagation delay due to the ionosphere (in figure: delay on GPS L1 frequency).
The Sun's radiation ionizes the Earth's upper atmosphere, the ionosphere, located from about 60km to 1000km above the Earth's surface.The ionization process in the ionosphere produces ions and free electrons. These electrons perturb the propagation of the GNSS (Global Navigation Satellite System) signals by inducing a so-called ionospheric delay.
See http://stce.be/newsletter/GNSS_final.pdf for some more explanations ; for detailed information, see http://gnss.be/ionosphere_tutorial.php