- Table of Content
- 1.Where is Mercu...
- 2.Review of sola...
- 3.USET Observati...
- 4.PROBA2 Observa...
- 5.Geomagnetic Ob...
- 6.Review of iono...
2. Review of solar and geomagnetic activity
3. USET Observations
4. PROBA2 Observations (4 Nov 2019 - 10 Nov 2019)
5. Geomagnetic Observations at Dourbes (4 Nov 2019 - 10 Nov 2019)
6. Review of ionospheric activity (4 Nov 2019 - 10 Nov 2019)
Where is Mercure?
Mercure transited the Sun and SWAP onboard of PROBA2, the 10 year old satellite saw it.
Can you detect Mercure in the EUV image below?
Read all about it on https://proba2.sidc.be/mercurytransit2019
Review of solar and geomagnetic activity
SOLAR ACTIVITY
Solar flaring activity was low: only one B-class flare was reported. The B 1.3 flare peaked at 06:11 UT on November 5 and originated from the NOAA AR 2750. Besides NOAA AR 2750, one more active region was observed, NOAA AR 2751.
There were no wide CMEs reported and the solar protons remained at the background level.
An equatorial coronal hole of negative polarity was observed. The patchy, equatorial coronal hole reached central meridian in the afternoon of November 06.
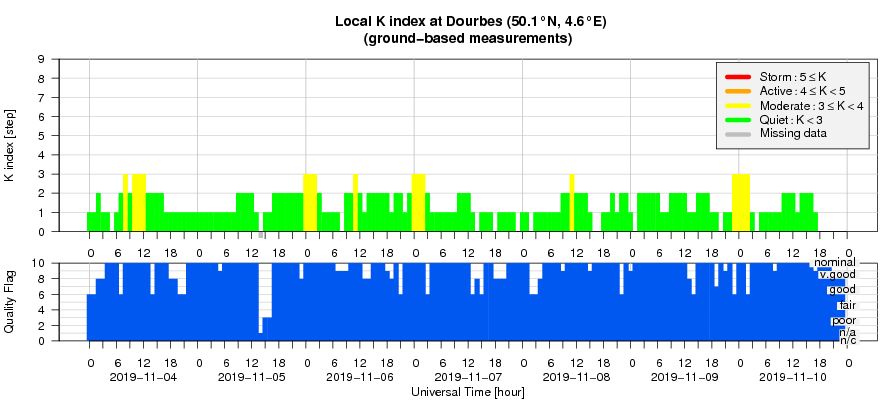
GEOMAGNETIC ACTIVITY
The Earth was inside the slow solar wind with the speed between about 310 and 450 km/s during the whole week. The total interplanetary magnetic field magnitude was ranged between 3 to 5 nT.
Geomagnetic conditions were quiet with only few short and isolated intervals of unsettled conditions (local station at Dourbes reported K=3, and NOAA reported Kp=3).
USET Observations
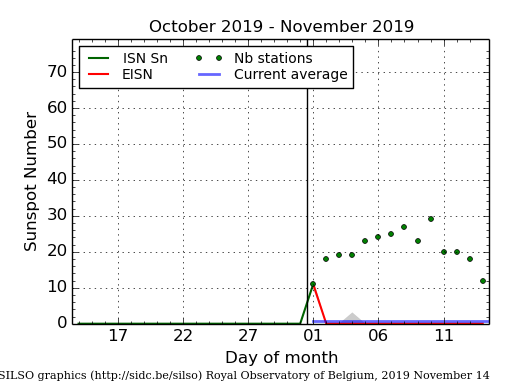
The daily Estimated International Sunspot Number (EISN, red curve with shaded error) derived by a simplified method from real-time data from the worldwide SILSO network. It extends the official Sunspot Number from the full processing of the preceding month (green line). The plot shows the last 30 days (about one solar rotation). The horizontal blue line shows the current monthly average, while the green dots give the number of stations included in the calculation of the EISN for each day.
PROBA2 Observations (4 Nov 2019 - 10 Nov 2019)
Solar Activity
Solar flare activity remained very low during the week.
In order to view the activity of this week in more detail, we suggest to go to the following website from which all the daily (normal and difference) movies can be accessed: http://proba2.oma.be/ssa
This page also lists the recorded flaring events.
A weekly overview movie can be found here (SWAP week 502): https://proba2.sidc.be/swap/data/mpg/movies/weekly_movies/weekly_movie_2019_11_04.mp4
Details about some of this week's events can be found further below.
If any of the linked movies are unavailable they can be found in the P2SC movie repository here: http://proba2.oma.be/swap/data/mpg/movies/
Tuesday Nov 05
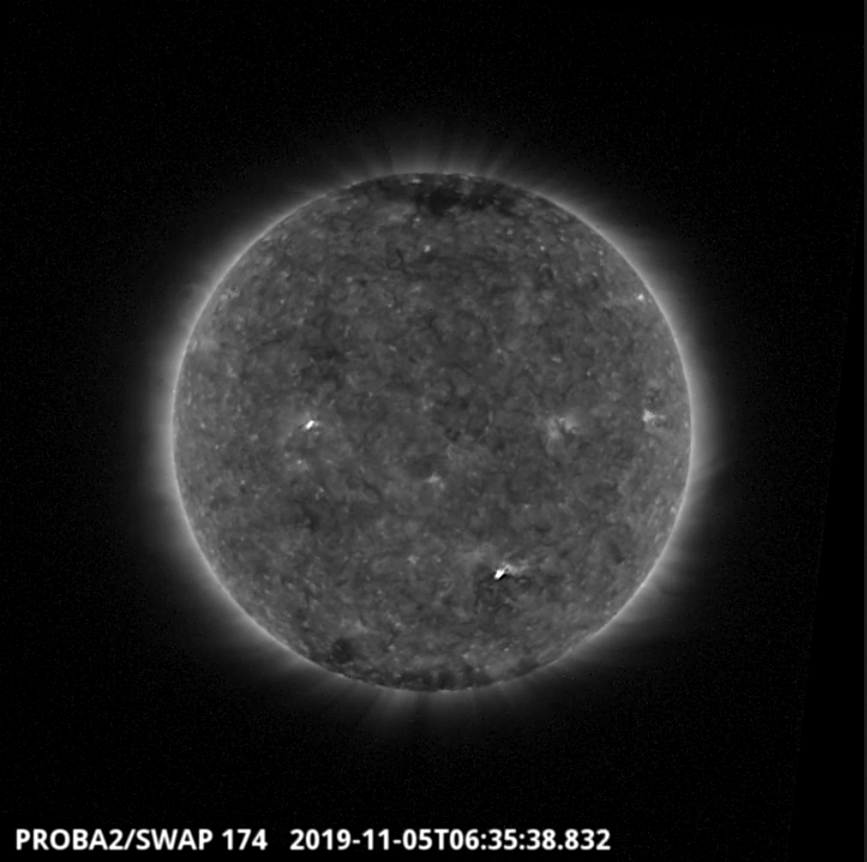
A B-class (B1.3) flare was observed by SWAP and LYRA on 2019-Nov-05. The flare and associated eruption are visible in the SWAP image above at 06:35 UT, located in the south-west of the solar disk.
Find a movie of the event here: http://proba2.oma.be/swap/data/mpg/movies/20191105_swap_movie.mp4(SWAP movie) and here: http://proba2.oma.be/swap/data/mpg/movies/20191105_swap_diff.mp4 (SWAP difference movie)
Geomagnetic Observations at Dourbes (4 Nov 2019 - 10 Nov 2019)
Review of ionospheric activity (4 Nov 2019 - 10 Nov 2019)
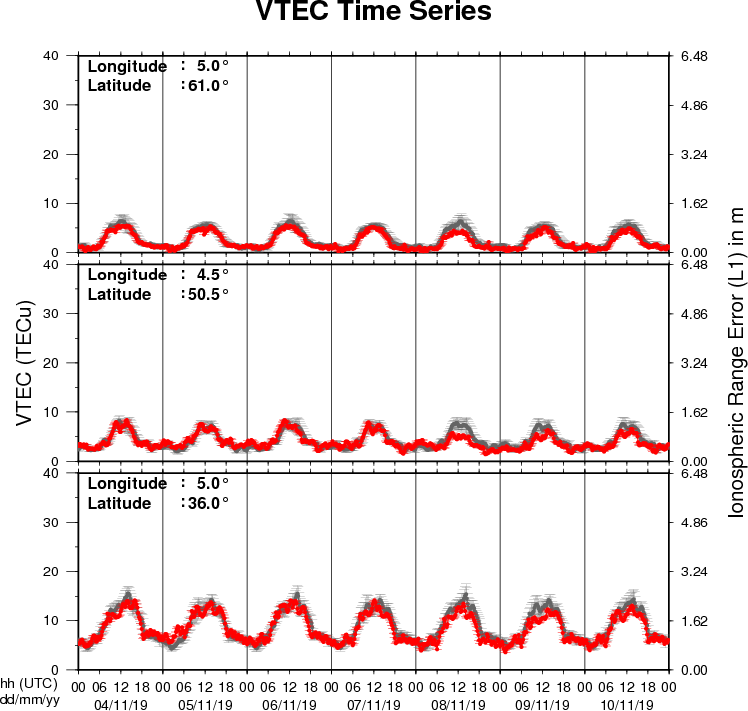
The figure shows the time evolution of the Vertical Total Electron Content (VTEC) (in red) during the last week at three locations:
a) in the northern part of Europe(N61°, 5°E)
b) above Brussels(N50.5°, 4.5°E)
c) in the southern part of Europe(N36°, 5°E)
This figure also shows (in grey) the normal ionospheric behaviour expected based on the median VTEC from the 15 previous days.
The VTEC is expressed in TECu (with TECu=10^16 electrons per square meter) and is directly related to the signal propagation delay due to the ionosphere (in figure: delay on GPS L1 frequency).
The Sun's radiation ionizes the Earth's upper atmosphere, the ionosphere, located from about 60km to 1000km above the Earth's surface.The ionization process in the ionosphere produces ions and free electrons. These electrons perturb the propagation of the GNSS (Global Navigation Satellite System) signals by inducing a so-called ionospheric delay.
See http://stce.be/newsletter/GNSS_final.pdf for some more explanations ; for detailed information, see http://gnss.be/ionosphere_tutorial.php