- Table of Content
- 1.ESWW2019
- 2.Review of sola...
- 3.PROBA2 Observa...
- 4.The Internatio...
- 5.Geomagnetic Ob...
- 6.Review of iono...
2. Review of solar and geomagnetic activity
3. PROBA2 Observations (11 Nov 2019 - 17 Nov 2019)
4. The International Sunspot Number by SILSO
5. Geomagnetic Observations at Dourbes (11 Nov 2019 - 17 Nov 2019)
6. Review of ionospheric activity (11 Nov 2019 - 17 Nov 2019)
ESWW2019
The fifth day of ESWW2019 started. We can already look back to a successful week, plenty of old and new friends, discussions. For now, we won't say much more because the last sessions and topical discussion meetings are still going on.
Delores Knipp could capture this view from the conference site.

Review of solar and geomagnetic activity
SOLAR ACTIVITY
The solar activity has been very low. The Sun was mostly spotless. A small short-lived bipolar sunspot group (Catania sunspot group 23, NOAA-AR 2752) emerged on Nov 21 on the East limb, but did not show any flaring activity and decayed the day after. The X-ray flux remains below B-level.
No earth-directed coronal mass ejections (CMEs) have been observed in the available coronagraphic imagery.
The greater than 10 MeV proton flux was at nominal values.
GEOMAGNETIC ACTIVITY
From Nov 11 to 12, the solar wind was slightly enhanced. The total magnetic field ranged between 9 nT and 12 nT, the southern component of the magnetic filed remained positive. The solar wind speed varied around 315 km/s. This enhancement was probably due to the passage of an Interplanetary CME, which we could not fully identify. One candidate was the CME seen in STEREO/COR2 on Nov 06 at 15:24.
After this relatively short and minor disturbance, the solar wind parameters returned to the nominal levels.
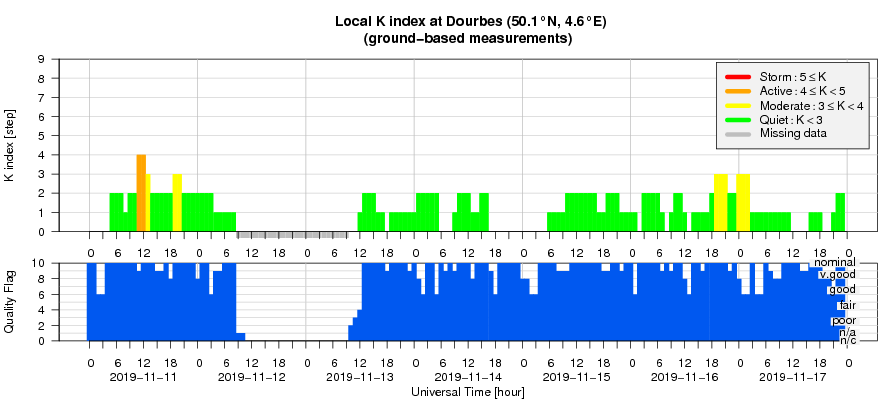
On Nov 15, a minor enhancement was observed which was linked to a coronal hole. This coronal hole reached the central meridian on Nov 13. The total magnetic field went up to 7 nT, and the southern component of the magnetic filed fluctuated between -5.7 nT and 5 nT. The solar wind speed was maximum 400 km/s. The fast wind of the coronal hole arrived on Nov 16 around 17:00 UTC. The total magnetic field reached 9.5 nT at 18:00 UTC, the southern component of the magnetic filed fluctuated between -7.7 nT and 9.2 nT. The solar wind speed rose up to 450 km/s.
Geomagnetic conditions were quiet with short periods of unsettled conditions on Nov 16 and 17 in response to the coronal hole.
PROBA2 Observations (11 Nov 2019 - 17 Nov 2019)
Solar Activity
Solar flare activity was very low during the week.
In order to view the activity of this week in more detail, we suggest to go to the following website from which all the daily (normal and difference) movies can be accessed: http://proba2.oma.be/ssa
This page also lists the recorded flaring events.
A weekly overview movie can be found here (SWAP week 503). https://proba2.sidc.be/swap/data/mpg/movies/weekly_movies/weekly_movie_2019_11_11.mp4
Details about some of this week's events can be found further below.
If any of the linked movies are unavailable they can be found in the P2SC movie repository here http://proba2.oma.be/swap/data/mpg/movies/
Tuesday Nov 12
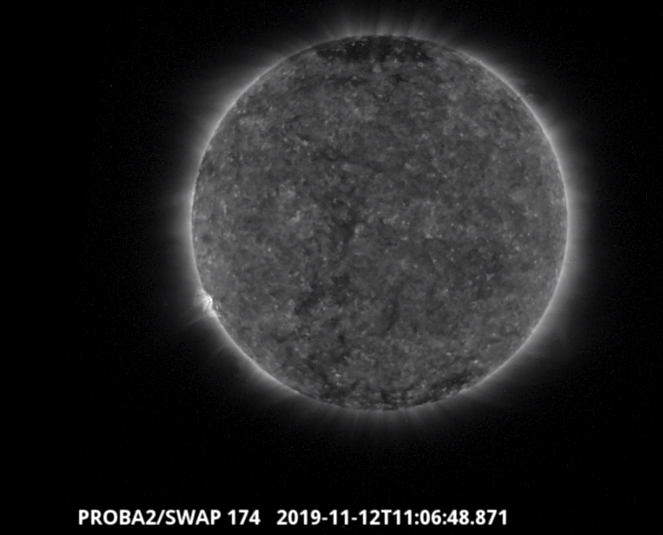
An active region is visible in the SWAP image above. It emerged on Nov 12 on the East limb, it is labelled NOAA 2752, it doesn't produced flare during the week. Find a movie of the events here (SWAP movie) https://proba2.sidc.be/swap/data/mpg/movies/20191112_swap_movie.mp4
The International Sunspot Number by SILSO
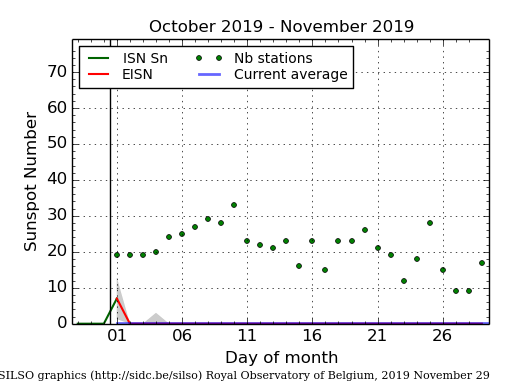
The daily Estimated International Sunspot Number (EISN, red curve with shaded error) derived by a simplified method from real-time data from the worldwide SILSO network. It extends the official Sunspot Number from the full processing of the preceding month (green line). The plot shows the last 30 days (about one solar rotation). The horizontal blue line shows the current monthly average, while the green dots give the number of stations included in the calculation of the EISN for each day.
Geomagnetic Observations at Dourbes (11 Nov 2019 - 17 Nov 2019)
Review of ionospheric activity (11 Nov 2019 - 17 Nov 2019)
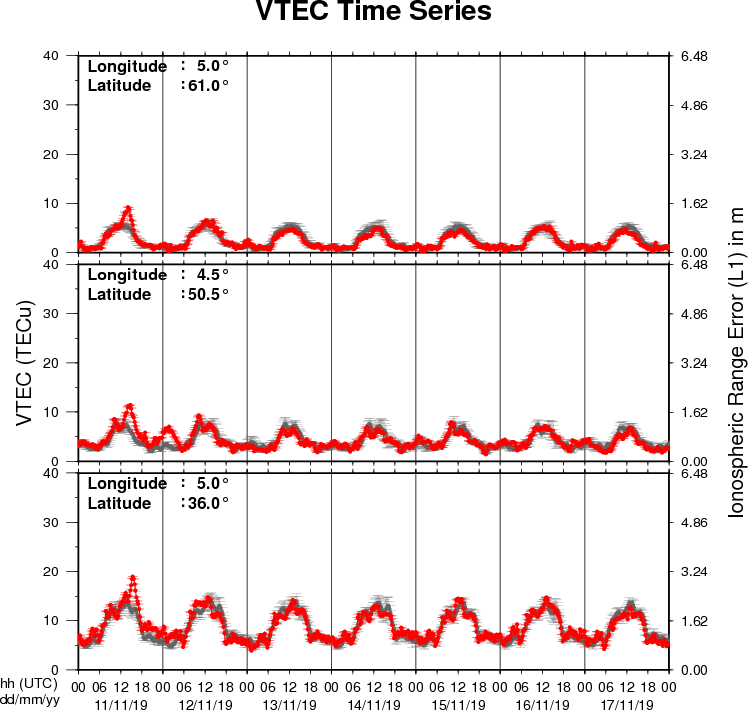
The figure shows the time evolution of the Vertical Total Electron Content (VTEC) (in red) during the last week at three locations:
a) in the northern part of Europe(N61°, 5°E)
b) above Brussels(N50.5°, 4.5°E)
c) in the southern part of Europe(N36°, 5°E)
This figure also shows (in grey) the normal ionospheric behaviour expected based on the median VTEC from the 15 previous days.
The VTEC is expressed in TECu (with TECu=10^16 electrons per square meter) and is directly related to the signal propagation delay due to the ionosphere (in figure: delay on GPS L1 frequency).
The Sun's radiation ionizes the Earth's upper atmosphere, the ionosphere, located from about 60km to 1000km above the Earth's surface.The ionization process in the ionosphere produces ions and free electrons. These electrons perturb the propagation of the GNSS (Global Navigation Satellite System) signals by inducing a so-called ionospheric delay.
See http://stce.be/newsletter/GNSS_final.pdf for some more explanations ; for detailed information, see http://gnss.be/ionosphere_tutorial.php