- Table of Content
- 1.ESWW2019 - Tha...
- 2.Spotless!
- 3.Review of sola...
- 4.The Internatio...
- 5.PROBA2 Observa...
- 6.Review of geom...
- 7.Geomagnetic Ob...
- 8.The SIDC space...
- 9.Review of iono...
2. Spotless!
3. Review of solar activity
4. The International Sunspot Number by SILSO - all equal to zero
5. PROBA2 Observations (9 Dec 2019 - 15 Dec 2019)
6. Review of geomagnetic activity
7. Geomagnetic Observations at Dourbes (9 Dec 2019 - 15 Dec 2019)
8. The SIDC space weather Briefing
9. Review of ionospheric activity (9 Dec 2019 - 15 Dec 2019)
ESWW2019 - Thank you!
Dear ESWW2019 participants
We can look back to a great ESWW edition with 417 participants from all over the world.
All of you contributed: convening a session and running after contributions, leading a topical discussion meeting, setting up a fair-booth, presenting a poster, contribute to the tutorial (on stage or from the room), giving a presentation, singing and dancing, playing, presenting a live space weather forecast, being present at the beer-tasting, visit, keynote, …
All of you deserve a medal ‘Excellent ESWW participant’. Thanks to all for your valuable contribution!
If you want to revive ESWW2019: click on ‘pictures and videos’ at http://www.stce.be/esww2019/index.php
If you are curious for the next ESWW2020, check http://esww17.iopconfs.org/Home
Enjoy the holidays!
Petra, Mario, Ronald, Alexi, Anna, Daniel, Dave, David, Ellen, Gareth, Jean, Jussi, Luke, Nicole, Peter, Piers, Stefaan, Volker

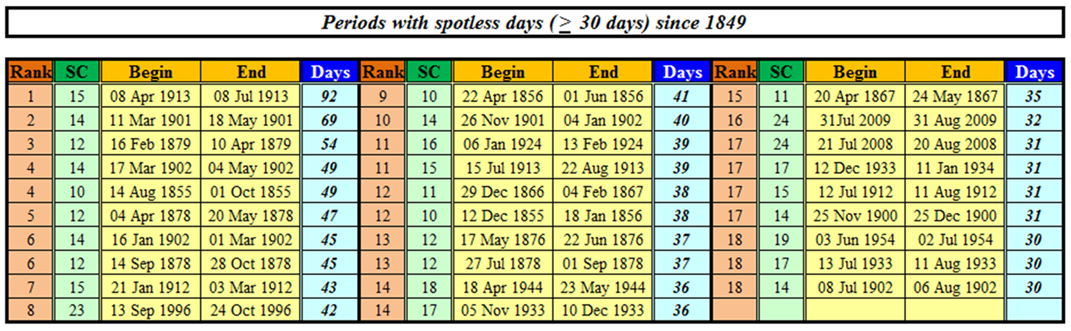
Spotless!
Based on the *provisional* sunspot numbers as provided by SILSO (http://sidc.be/silso/ ), the Sun has been spotless since 14 November. Said otherwise, no sunspots have appeared for at least 33 consecutive days. This is longer than the longest spotless stretch of the previous solar cycle minimum, when the Sun was spotless from 31 July till 31 August 2009. The next "target" (in recent history) is the 42 days stretch from the solar cycle 22-23 minimum, when there were no sunspots observed from 13 September till 24 October 1996. That would propel the currently ongoing spotless stretch into the Top 10 of periods with spotless days since 1849, as shown in the table underneath (http://sidc.be/silso/spotless ).
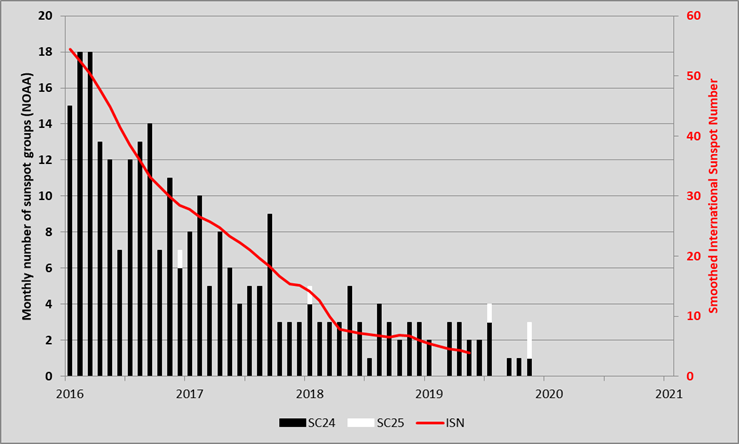
Gradually, more and more sunspot groups from the new solar cycle (SC25) are showing. The graph below shows the monthly number of sunspot groups (having received a NOAA number) from SC24 (black) and from SC25 (white) since 2016. The red curve represents the smoothed monthly international sunspot number (SILSO). While the number of regions is low so close to the solar minimum, SC25 sunspot regions will gradually become more numerous than the SC24 regions eventually outnumbering those from the "old" cycle. The cycle minimum usually occurs within just a few months of this "break-even".
In view of the decreasing solar activity, the earth environment is exposed again to more high-energetic particles coming from outside our solar system, the so-called galactic cosmic rays (GCR - see the STCE newsitem at http://www.stce.be/news/433/welcome.html ). When entering the heliosphere, cosmic rays encounter a turbulent solar wind with an embedded heliospheric magnetic field. The higher the solar activity, the more intense and complex this magnetic field, and the more difficult it is for a particle to make it all the way to the Earth. When some finally arrive, they collide with particles in the Earth's atmosphere, creating a shower of secondary particles such as neutrons. These neutrons are detected by neutron monitors such as in Dourbes (http://ionosphere.meteo.be/instruments/neutron.php ) or various other sites around the world (Moscow, Oulu,...). The graph underneath shows the monthly Oulu neutron count relative to the average of the last 20 years. The neutron count is 6 percent above this average, almost as high as during the previous solar cycle minimum (8 percent). The GCRs are the cause of increased radiation and so the monitoring is important for aviation and astronauts.
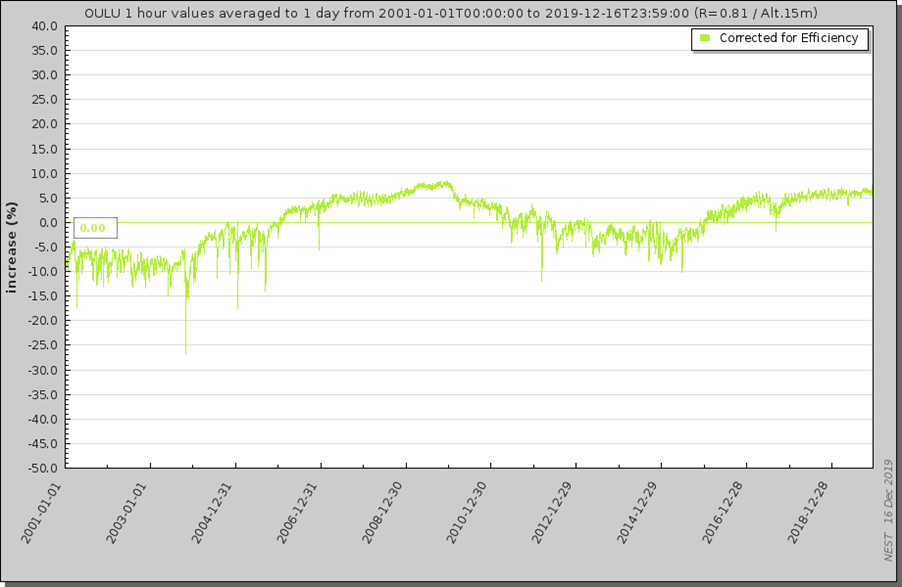
Acknowledgements to the NMDB database (www.nmdb.eu), founded under the European Union's FP7 programme (contract no. 213007) for providing data, as well as to the Oulu neutron monitor webpage at http://cosmicrays.oulu.fi and the Sodankyla Geophysical Observatory.
Review of solar activity
Solar flaring activity was very low, without C-class, or even B-class flares reported. No numbered active regions were observed on the visible side of the Sun. No wide CMEs reported and the solar protons remained at the background level.
Two coronal holes were observed on the visible side of the Sun. The coronal hole that reached the central meridian on December 10, was situated near the equator, narrow, and had a negative polarity. The coronal hole that reached the central meridian on December 14, was also situated near the equator, but with a positive polarity.
The International Sunspot Number by SILSO - all equal to zero
It happened: the first Sunspot Number graph of this solar minimum in the STCE Newsletter with all numbers equal to zero!
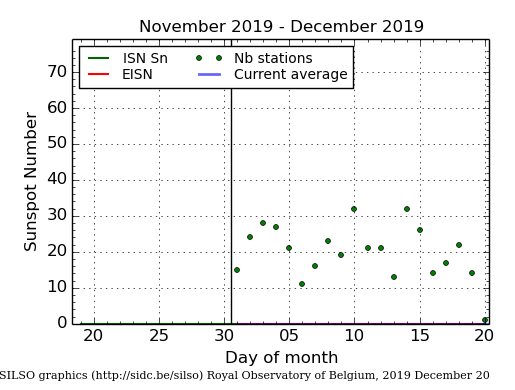
The daily Estimated International Sunspot Number (EISN, red curve with shaded error) derived by a simplified method from real-time data from the worldwide SILSO network. It extends the official Sunspot Number from the full processing of the preceding month (green line). The plot shows the last 30 days (about one solar rotation). The horizontal blue line shows the current monthly average, while the green dots give the number of stations included in the calculation of the EISN for each day.
PROBA2 Observations (9 Dec 2019 - 15 Dec 2019)
Solar Activity
Solar flare activity was very low during the week.
In order to view the activity of this week in more detail, we suggest to go to the following website from which all the daily (normal and difference) movies can be accessed: https://proba2.oma.be/ssa
This page also lists the recorded flaring events.
A weekly overview movie can be found here (SWAP week 507). http://proba2.oma.be/swap/data/mpg/movies/weekly_movies/weekly_movie_2019_12_09.mp4
Details about some of this week's events can be found further below.
If any of the linked movies are unavailable they can be found in the P2SC movie repository here https://proba2.oma.be/swap/data/mpg/movies/
Tuesday Dec 10
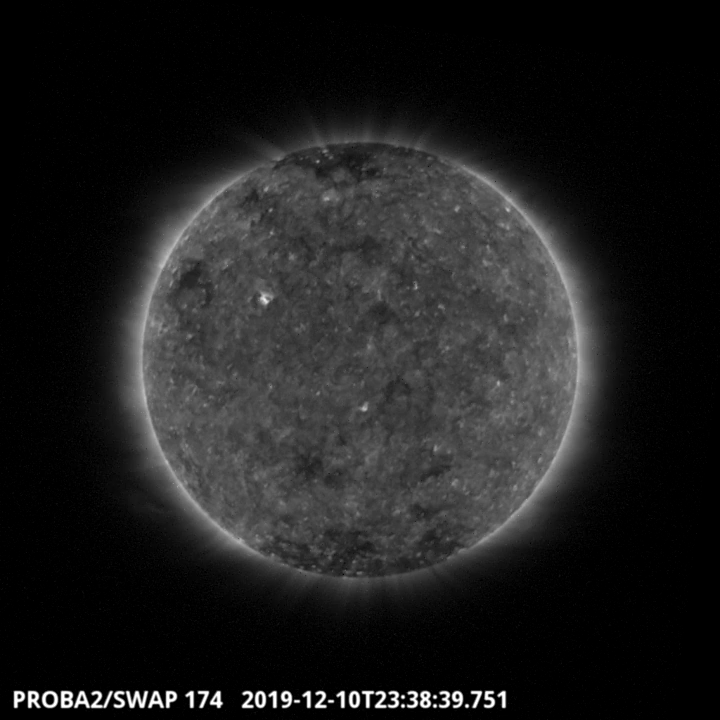
A southern elongated coronal hole transited the central meridian on 2019-Dec-10 and is visible on the SWAP image above. Find a movie of the day here (SWAP movie) http://proba2.oma.be/swap/data/mpg/movies/2019/11/20191210_swap_movie.mp4
Saturday Dec 14
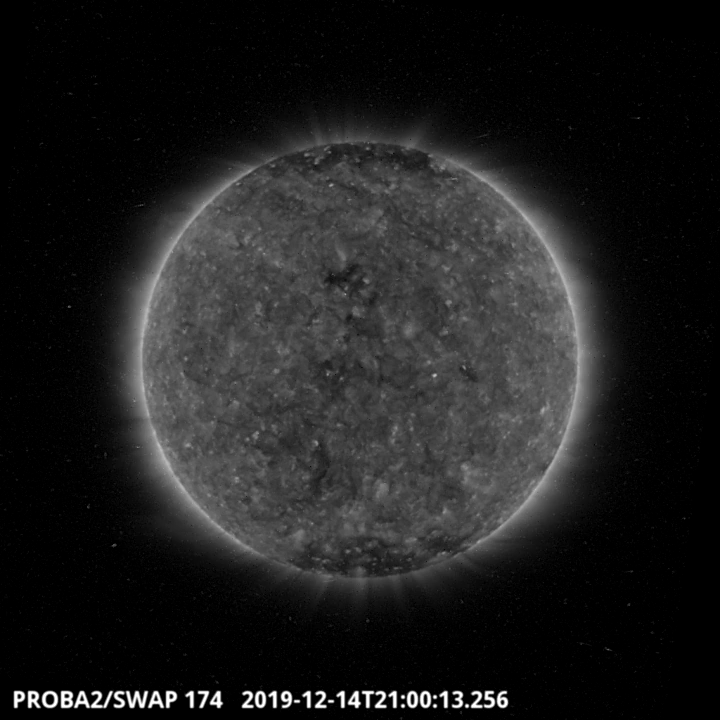
An extended central coronal hole transited the central meridian on 2019-Dec-14 is visible on the SWAP image above. Find a movie of the day here (SWAP movie) http://proba2.oma.be/swap/data/mpg/movies/2019/11/20191214_swap_movie.mp4
Review of geomagnetic activity
At the beginning of the week, the solar wind at L1 had a speed around 350 km/s. The interplanetary magnetic field strength was 5 nT. The in situ observations indicated the passage of an ICME (of unclear solar origin) at L1 early in the morning of December 10. The ICME was followed by the solar wind from the patchy, negative polarity coronal hole (which reached central meridian on December 05). The solar wind speed reached maximum value of about 480 km/s and the interplanetary magnetic field magnitude was up to 9 nT.
Another interval of slightly enhanced solar wind speed (up to 430 km/s) and the interplanetary magnetic field magnitude (up to 7 nT) was observed in the afternoon of December 15. This was possibly associated with the negative polarity coronal hole that crossed central meridian on December 10.
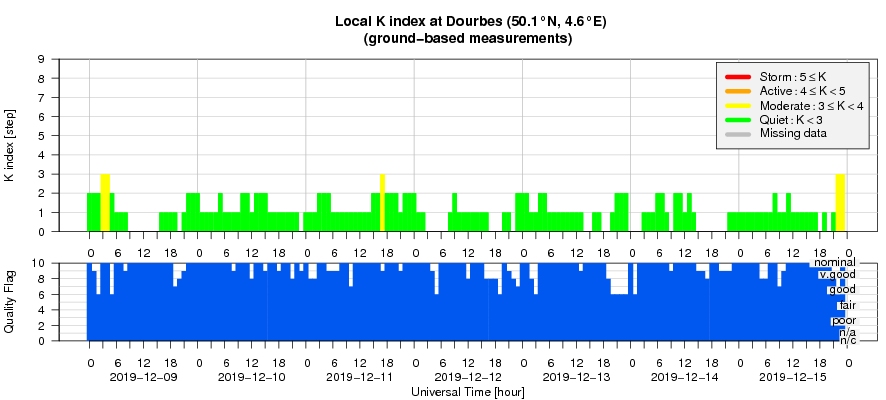
Geomagnetic conditions were quiet with a few intervals of unsettled conditions, both locally (Dourbes) and on the planetary level. The 'All quiet alert' was on during the whole week.
Geomagnetic Observations at Dourbes (9 Dec 2019 - 15 Dec 2019)
The SIDC space weather Briefing
The Space Weather Briefing presented by the forecaster on duty from December 8 to 15. It reflects in images and graphs what is written in the Solar and Geomagnetic Activity report.
The pdf-version: http://www.stce.be/briefings/20191216_SWbriefing.pdf
The automatically running presentation: http://www.stce.be/briefings/20191216_SWbriefing.ppsm
Review of ionospheric activity (9 Dec 2019 - 15 Dec 2019)
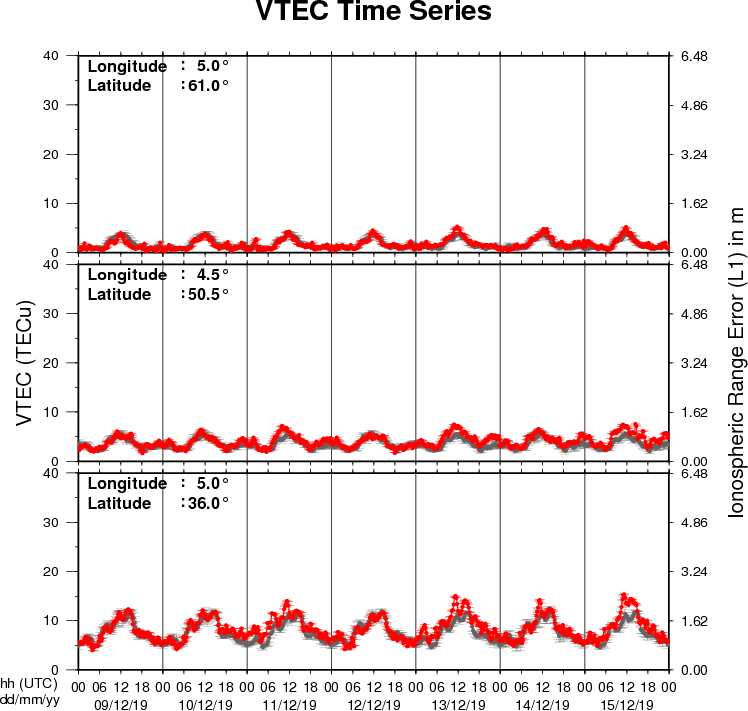
The figure shows the time evolution of the Vertical Total Electron Content (VTEC) (in red) during the last week at three locations:
a) in the northern part of Europe(N61°, 5°E)
b) above Brussels(N50.5°, 4.5°E)
c) in the southern part of Europe(N36°, 5°E)
This figure also shows (in grey) the normal ionospheric behaviour expected based on the median VTEC from the 15 previous days.
The VTEC is expressed in TECu (with TECu=10^16 electrons per square meter) and is directly related to the signal propagation delay due to the ionosphere (in figure: delay on GPS L1 frequency).
The Sun's radiation ionizes the Earth's upper atmosphere, the ionosphere, located from about 60km to 1000km above the Earth's surface.The ionization process in the ionosphere produces ions and free electrons. These electrons perturb the propagation of the GNSS (Global Navigation Satellite System) signals by inducing a so-called ionospheric delay.
See http://stce.be/newsletter/GNSS_final.pdf for some more explanations ; for detailed information, see http://gnss.be/ionosphere_tutorial.php