- Table of Content
- 1.Two sunspot gr...
- 2.Review of sola...
- 3.The Internatio...
- 4.Geomagnetic Ob...
- 5.The SIDC space...
- 6.Review of iono...
2. Review of solar and geomagnetic activity
3. The International Sunspot Number by SILSO
4. Geomagnetic Observations at Dourbes (16 Dec 2019 - 22 Dec 2019)
5. The SIDC space weather Briefing
6. Review of ionospheric activity (16 Dec 2019 - 22 Dec 2019)
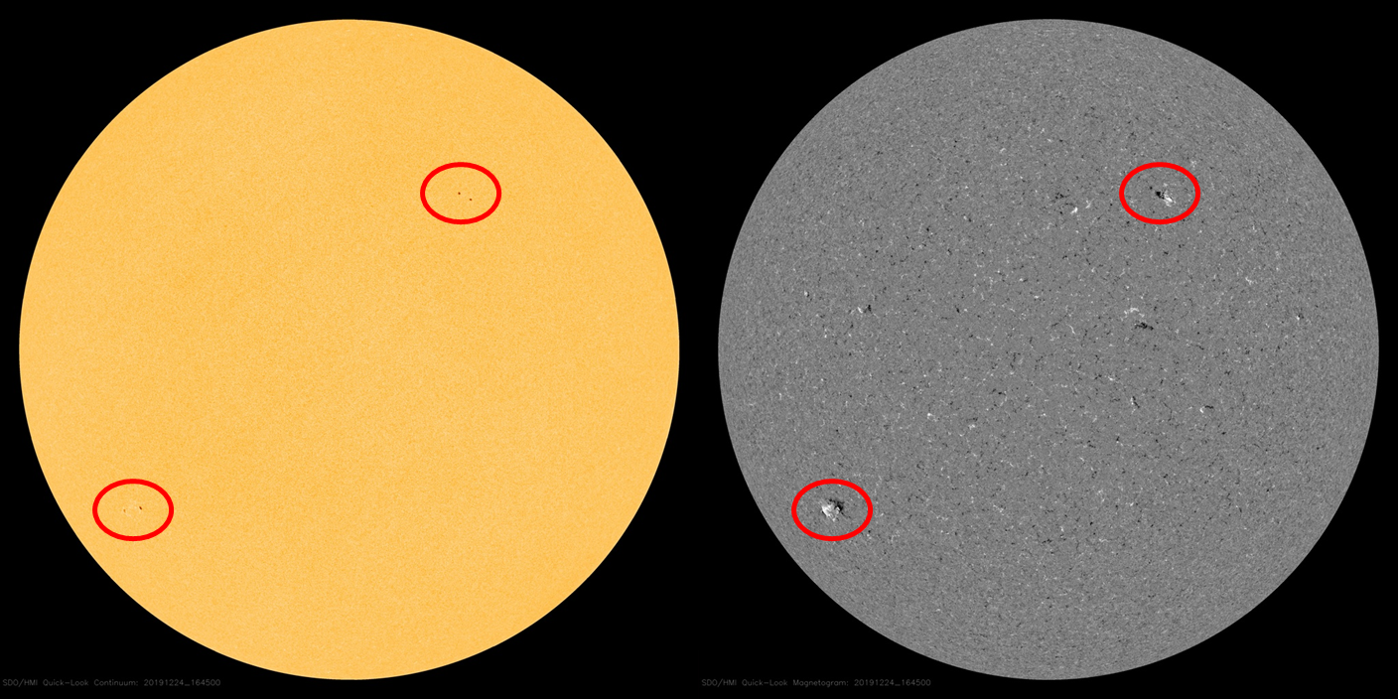
Two sunspot groups from the new solar cycle
On 24 December, 2 sunspot regions of the new solar cycle (SC25) were visible on the solar disk at the same time. NOAA 2753, located in the southeast quadrant near latitude -30 degrees, developed during the afternoon hours of 23 December. NOAA 2754 located in the northwest quadrant near latitude +25 degrees, developed during the morning hours of 24 December. SDO imagery shows the Sun on 24 December, with a white light image on the left and a magnetogram on the right. The high latitude of these sunspot regions as well as their magnetic polarity leave no doubt: Both groups belong to the new solar cycle 25. Both sunspot regions are currently (late on 24 December) still visible as small bipolar groups.
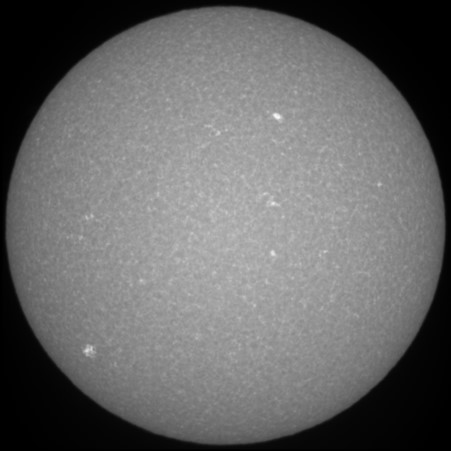
Also the solar telescopes of the Uccle Solar Equatorial Table (USET - http://www.sidc.be/uset/ ) recorded the groups. Underneath an image taken on 24 December in the CaIIK line (a line in the blue end of the solar spectrum). The appearance of these groups halt a period of spotless days that started on 14 November (preliminary SILSO data). It is the longest stretch of spotless days since 1996 (see last week's STCE Newsitem at http://www.stce.be/news/466/welcome.html ).
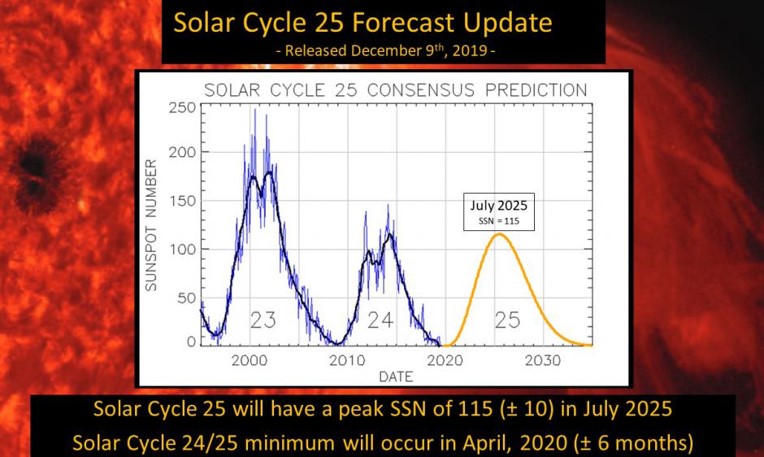
Earlier this month, the international Solar Cycle 25 forecast panel released an updated prediction on the start and strength of the new solar cycle (source: NOAA/SWPC at https://www.swpc.noaa.gov/news/solar-cycle-25-forecast-update ). SC25 is predicted to start in April 2020 (+/- 6 months) and to peak in July 2025 (+/- 8 months) with a maximum smoothed monthly sunspot number of 115 (+/- 10), making its amplitude very similar to that of the previous SC24.
Review of solar and geomagnetic activity
SOLAR ACTIVITY
The Sun was spotless throughout the week and the X-ray flux was below B level.
No Earth directed CME's were observed.
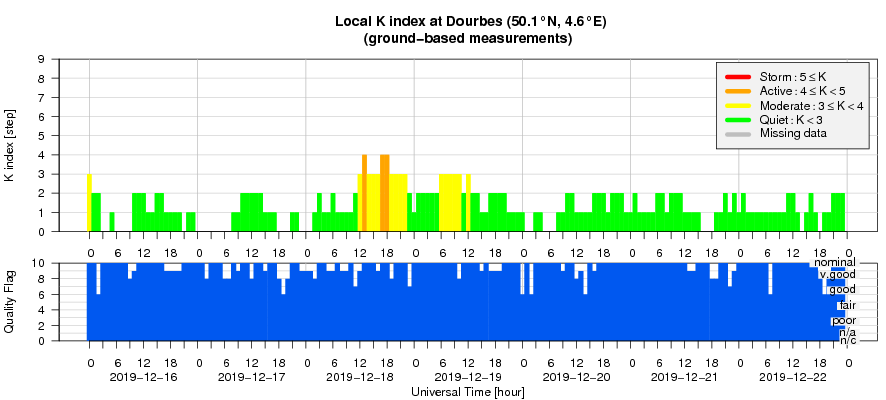
GEOMAGNETIC ACTIVITY
Solar wind was dominated by the passage of a high speed stream which set in on December 18, rising to speeds of a maximum of 560 km/s and with total magnetic field attaining a maximum of 12nT. Solar wind speed then slowly declined over the remainder of the week to a nominal 350 km/s.
Geomagnetic conditions reached active periods on December 18 and 19 when the high speed stream was strongest. Otherwise geomagnetic conditions were overall quiet.
High energy (>2MeV) electron flux was enhanced following the high speed stream passage but did not reach the event threshold.
The International Sunspot Number by SILSO
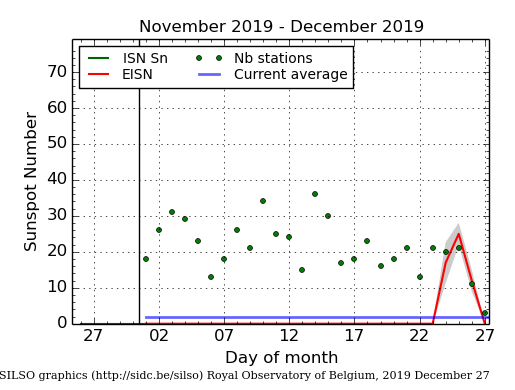
The daily Estimated International Sunspot Number (EISN, red curve with shaded error) derived by a simplified method from real-time data from the worldwide SILSO network. It extends the official Sunspot Number from the full processing of the preceding month (green line). The plot shows the last 30 days (about one solar rotation). The horizontal blue line shows the current monthly average, while the green dots give the number of stations included in the calculation of the EISN for each day.
Geomagnetic Observations at Dourbes (16 Dec 2019 - 22 Dec 2019)
The SIDC space weather Briefing
The Space Weather Briefing presented by the forecaster on duty from Dec 15 to 22. It reflects in images and graphs what is written in the Solar and Geomagnetic Activity report.
The pdf-version: http://www.stce.be/briefings/20191223_SWbriefing.pdf
The automatically running presentation: http://www.stce.be/briefings/20191223_SWbriefing.ppsm
Review of ionospheric activity (16 Dec 2019 - 22 Dec 2019)
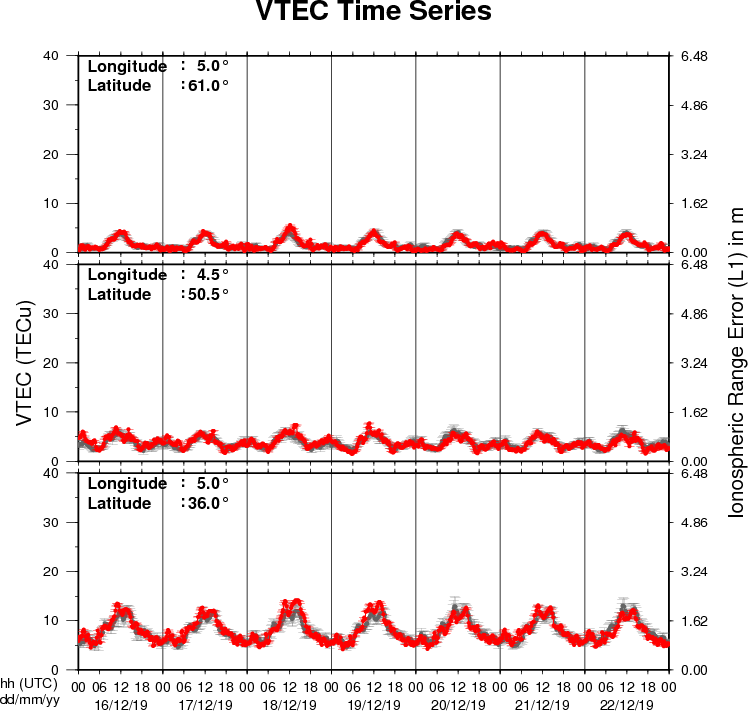
The figure shows the time evolution of the Vertical Total Electron Content (VTEC) (in red) during the last week at three locations:
a) in the northern part of Europe(N61°, 5°E)
b) above Brussels(N50.5°, 4.5°E)
c) in the southern part of Europe(N36°, 5°E)
This figure also shows (in grey) the normal ionospheric behaviour expected based on the median VTEC from the 15 previous days.
The VTEC is expressed in TECu (with TECu=10^16 electrons per square meter) and is directly related to the signal propagation delay due to the ionosphere (in figure: delay on GPS L1 frequency).
The Sun's radiation ionizes the Earth's upper atmosphere, the ionosphere, located from about 60km to 1000km above the Earth's surface.The ionization process in the ionosphere produces ions and free electrons. These electrons perturb the propagation of the GNSS (Global Navigation Satellite System) signals by inducing a so-called ionospheric delay.
See http://stce.be/newsletter/GNSS_final.pdf for some more explanations ; for detailed information, see http://gnss.be/ionosphere_tutorial.php