- Table of Content
- 1.B-class flarin...
- 2.EUI - a quick ...
- 3.Review of sola...
- 4.PROBA2 Observa...
- 5.The Internatio...
- 6.Geomagnetic Ob...
- 7.The SIDC space...
- 8.Review of iono...
2. EUI - a quick update
3. Review of solar activity
4. PROBA2 Observations
5. The International Sunspot Number by SILSO
6. Geomagnetic Observations at Dourbes
7. The SIDC space weather Briefing
8. Review of ionospheric activity
B-class flaring in NOAA 2759
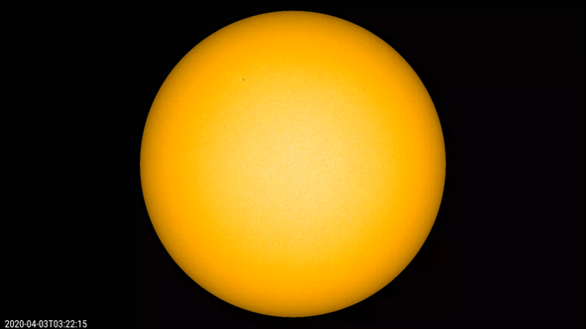
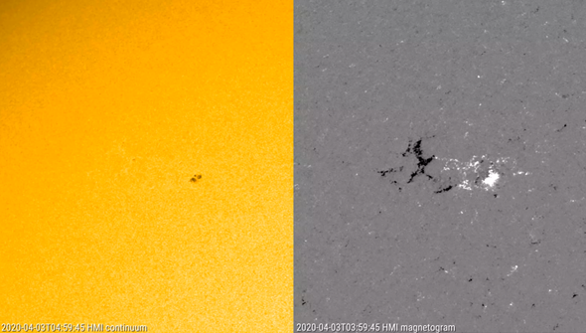
NOAA 2759 was a small sunspot group that appeared on 30 March near the northeast limb. Based on its magnetic configuration and its high latitude (+28 degrees), it belonged to the new solar cycle 25 (SC25). See this STCE Newsitem at http://www.stce.be/news/422/welcome.html for more info on magnetic polarities and on how to identify to which solar cycle a sunspot group belongs. The SDO/HMI imagery underneath first shows the (full disk) evolution of the sunspot group as it transits the solar disk from 30 March till 07 April, followed (zoom) by a comparison between a white light image and the magnetogram of the region. Both images show the region's outlook early on 3 April, when the group's sunpot area was at its largest. All movies for this article can be found in the online newsitem at http://www.stce.be/news/476/welcome.html
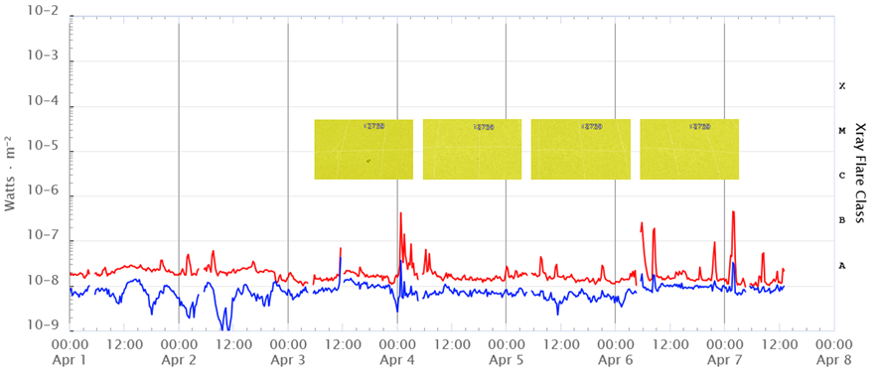
As is normal for such a small and simple group, it did not produce significant flaring. In fact, the group was already decaying when it produced the first two of a total of 5 B-class flares (so far). Overlaid on the GOES x-ray flux (red curve) for the period from 1 till 7 April, are 4 close-ups of NOAA 2759 from 3 till 6 April, each around 18UT. One can clearly see the group decaying on 4 April, and it was basically spotless from 5 April onwards as reported by the SILSO network. It's interesting to note that the last 3 B-class flares, i.e. the ones on 6 and 7 April happened when the sunspot region was already spotless.
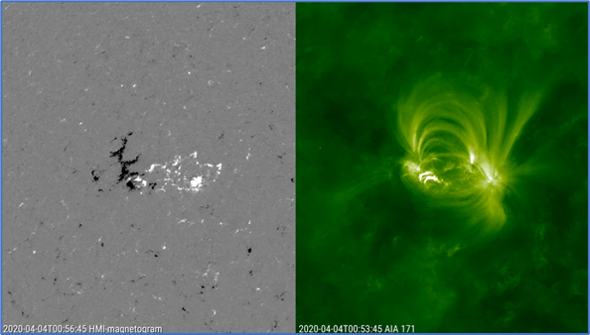
Late on 3 April, a small bipolar region can be seen emerging in the trailing ("left") portion of NOAA 2759. This area of mixed magnetic polarity is the source of 2 B-class flares early on 4 April: A B4.2 peaking at 00:52UT and a B1.4 at 01:38UT. The images underneath combine a magnetogram on the left and an extreme ultraviolet (EUV; SDO/AIA 171 at temperatures around 700.000 degrees) image on the right clearly showing the location of the B4.2 flare at the time of its peak.
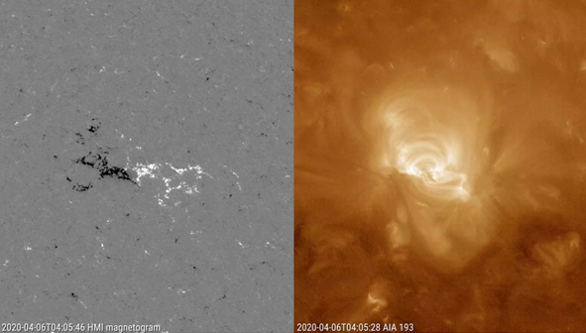
By 6 April, the region was virtually spotless. Two B-class flares were the result of instabilities in the group filament, that can be seen running along the polarity inversion line (PIL), i.e. the line marking the border between the two main areas of opposite magnetic flux. The images underneath combine a magnetogram on the left and an EUV image (SDO/AIA 193 at temperatures around 1.250.000 degrees) on the right showing the location of the filament about 1.5 hours prior to the eruptive activity. The flares peaked at 05:48UT (B2.5) and at 08:31UT (B1.8). The filament was not ejected, as no coronal mass ejections observed in SOHO and STEREO-A coronagraphic imagery.
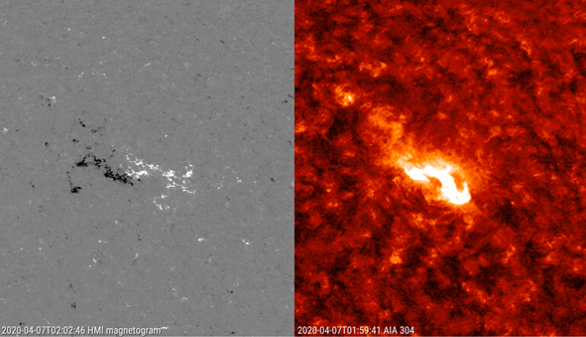
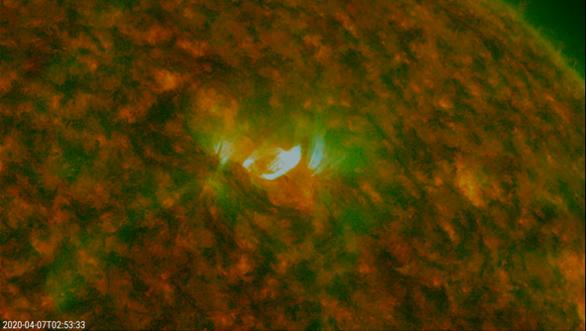
One day later, the strongest of the 5 B-class flares took place, i.e. a B4.5 peaking at 01:59UT. The images underneath combine a magnetogram on the left and an EUV image (SDO/AIA 304 at temperatures around 80.000 degrees) on the right showing the event at the moment of the flare peak. Again the eruption took place along the PIL, and also here no CME was observed. The last image is a combination of SDO/AIA 304 (red channel) and SDO/AIA 171 (green and blue channel) highlighting the dynamics along the PIL during the eruption as well as the post-flare coronal loops about an hour after the flare peak.
For this article, data and imagery were taken from SDO (https://sdo.gsfc.nasa.gov/data/aiahmi/), SWPC/GOES (https://www.swpc.noaa.gov/products/goes-x-ray-flux), Solar Monitor (https://www.solarmonitor.org/), SILSO (http://sidc.oma.be/silso/), SOHO (https://sohowww.nascom.nasa.gov/home.html), STEREO-A (https://stereo-ssc.nascom.nasa.gov/beacon/beacon_secchi.shtml), and CACTus (http://www.sidc.oma.be/cactus/). The movies were created with JHelioviewer (http://swhv.oma.be/user_manual/).
EUI - a quick update
Although the Solar Orbiter in-orbit commissioning has been put on hold, a few things are still checked during the 'Near Earth Phase'. Here is a quick update for the EUI telescope:
* The flap covering the hole in the heat shield in front of EUI have been moved aside. This helps outgassing. Done.
* The flap covering the hole in the heat shield in front of EUI have been moved back. Done.
* The EUI door has been opened. This helps outgassing. Done.
The heat shield protecting Solar Orbiter from extreme heat when facing the Sun
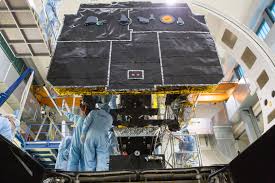
In a next step, the EUI door will be closed again and then both the flap and the door will be opened for the First Light. When this will happen, we don't know. Covid-19 controles our agenda.
Stay safe!
Review of solar activity
SOLAR ACTIVITY
The solar activity was at low levels over the past week with the X-ray flux at or below B-level. A sunspot emerged on the March 30 in the North-East quadrant on the solar disc (NOAA Active Region 2759).
No earth-directed coronal mass ejections (CMEs) have been identified in available coronagraphic imagery.
The greater than 10 MeV proton flux was at nominal values.
The greater than 2 MeV electron flux increased on late March 31 and crossed the threshold on April 2.
A small positive coronal hole crossed the central meridian on late March 31.
GEOMAGNETIC ACTIVITY
The solar wind registered by DSCOVR was at nominal levels on March 29, and got elevated on March 30, possibly due to the coronal hole crossing the central meridian on March 26. This regime continued for the rest of the week. Solar wind speeded up to about 535 km/s and Interplanetary Magnetic Field magnitudes up to about 8 nT were registered.
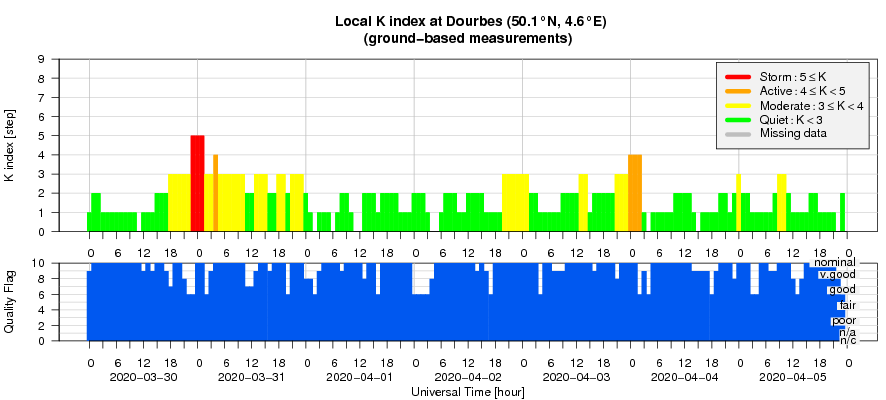
Quiet to unsettled geomagnetic levels were registered (K Dourbes and NOAA Kp less than 4), with two active events (K Dourbes = 5 and 4 respectively and NOAA Kp = 4), possibly due to the effects of the aforementioned coronal hole and possibly favoured by Bz equalling to -7nT.
PROBA2 Observations
Solar Activity
Solar flare activity was very low during the week.
In order to view the activity of this week in more detail, we suggest to go to the following website from which all the daily (normal and difference) movies can be accessed: https://proba2.oma.be/ssa
This page also lists the recorded flaring events.
A weekly overview movie can be found here (SWAP week 523). https://proba2.sidc.be/swap/data/mpg/movies/weekly_movies/weekly_movie_2020_03_30.mp4
Details about some of this week's events can be found further below.
If any of the linked movies are unavailable they can be found in the P2SC movie repository here https://proba2.oma.be/swap/data/mpg/movies/
Saturday Apr 04
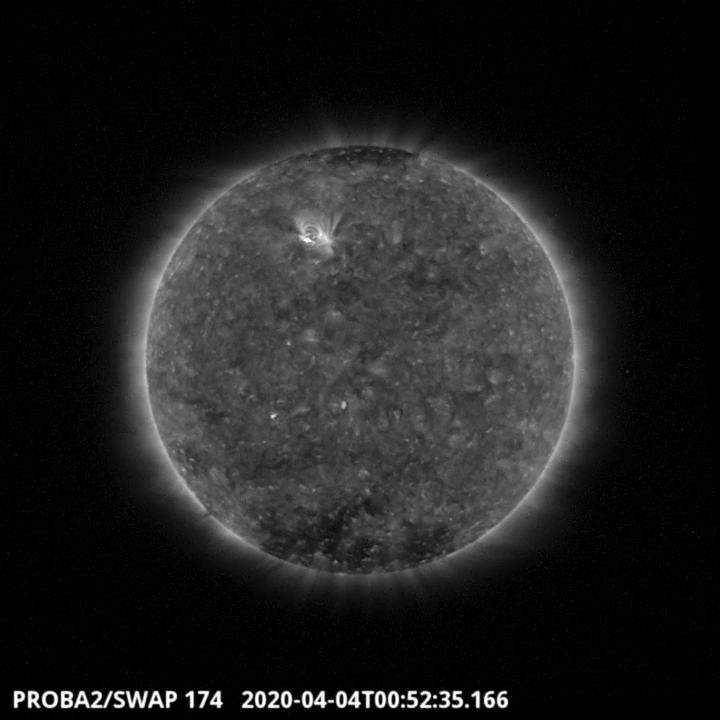
A new active region emerged on the solar disk on 2020-Mar-30 in the North-East quadrant on
the solar disc (NOAA Active Region 2759). This active region produced a B4.2 flare on
2020-Apr-04 around 00:52 UT. Find a movie of the event here (SWAP movie) http://proba2.oma.be/swap/data/mpg/movies/20200404_swap_movie.mp4
The International Sunspot Number by SILSO
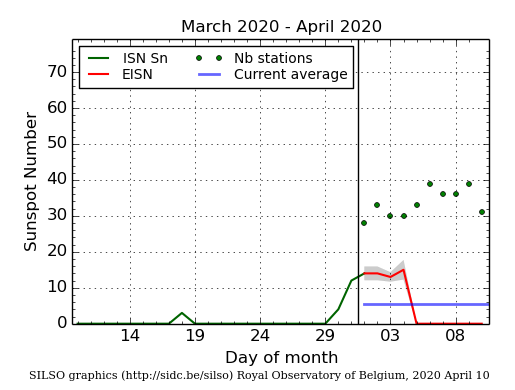
The daily Estimated International Sunspot Number (EISN, red curve with shaded error) derived by a simplified method from real-time data from the worldwide SILSO network. It extends the official Sunspot Number from the full processing of the preceding month (green line). The plot shows the last 30 days (about one solar rotation). The horizontal blue line shows the current monthly average, while the green dots give the number of stations included in the calculation of the EISN for each day.
Geomagnetic Observations at Dourbes
The SIDC space weather Briefing
The Space Weather Briefing presented by the forecaster on duty from March 29 to April 5. It reflects in images and graphs what is written in the Solar and Geomagnetic Activity report.
The pdf-version: http://www.stce.be/briefings/20200406_SWbriefing.pdf
The automatically running presentation: http://www.stce.be/briefings/20200406_SWbriefing.ppsm
Review of ionospheric activity
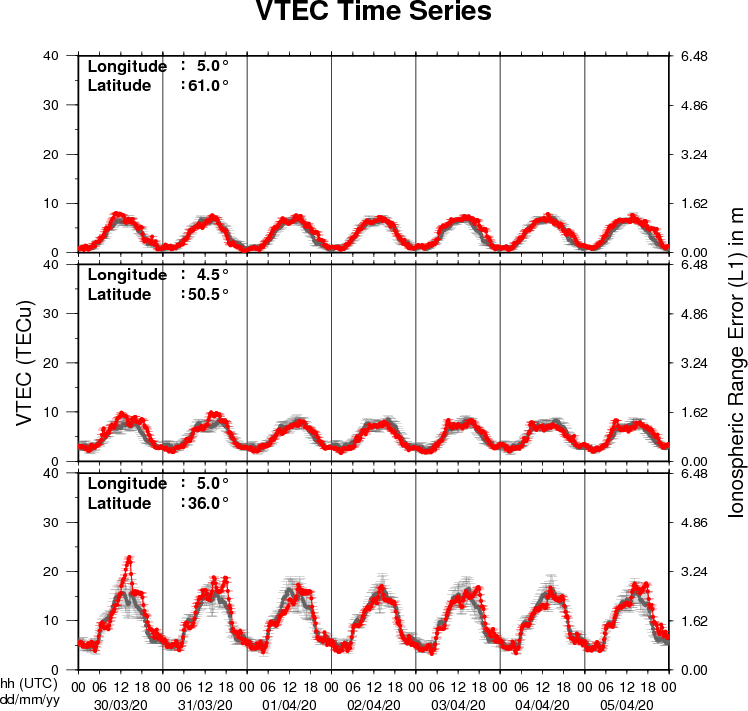
The figure shows the time evolution of the Vertical Total Electron Content (VTEC) (in red) during the last week at three locations:
a) in the northern part of Europe(N61°, 5°E)
b) above Brussels(N50.5°, 4.5°E)
c) in the southern part of Europe(N36°, 5°E)
This figure also shows (in grey) the normal ionospheric behaviour expected based on the median VTEC from the 15 previous days.
The VTEC is expressed in TECu (with TECu=10^16 electrons per square meter) and is directly related to the signal propagation delay due to the ionosphere (in figure: delay on GPS L1 frequency).
The Sun's radiation ionizes the Earth's upper atmosphere, the ionosphere, located from about 60km to 1000km above the Earth's surface.The ionization process in the ionosphere produces ions and free electrons. These electrons perturb the propagation of the GNSS (Global Navigation Satellite System) signals by inducing a so-called ionospheric delay.
See http://stce.be/newsletter/GNSS_final.pdf for some more explanations ; for detailed information, see http://gnss.be/ionosphere_tutorial.php