- Table of Content
- 1.Val-u-Sun
- 2.Solar Orbiter ...
- 3.Review of sola...
- 4.PROBA2 Observa...
- 5.The Internatio...
- 6.Geomagnetic Ob...
- 7.Review of iono...
2. Solar Orbiter connects different generations and nations
3. Review of solar and geomagnetic activity
4. PROBA2 Observations (6 Apr 2020 - 12 Apr 2020)
5. The International Sunspot Number by SILSO
6. Geomagnetic Observations at Dourbes (6 Apr 2020 - 12 Apr 2020)
7. Review of ionospheric activity (6 Apr 2020 - 12 Apr 2020)
Val-u-Sun
The Sunspot Number is the longest scientific experiment still ongoing and a crucial benchmark to study solar activity, space weather and climate change. The Royal Observatory of Belgium (ROB) plays a central role in the continuation of this experiment, as it hosts the Sunspot Index and Long-term Solar Observations World Data Center (SILSO-WDC). This World Data Center aims at collecting solar data, as well as producing and distributing the International Sunspot Number, which is used in about two hundred scientific publications on an annual basis.
The Val-u-Sun project hinges on two sunspot collections kept at ROB. The first collection consists of a series of about 20.000 digitized sunspot drawings acquired at the Uccle Solar Equatorial Table station (USET) since 1940 and a corresponding database. The second collection, the SILSO database, contains the numbers of spots and groups of spots on the Sun observed by a worldwide network since 1981 (more than 530.000 measurements).
The objective to achieve on these two collections is threefold: (1) Bring the databases to the modern era by adding essential metadata, whether it is additional parameters or techniques for quality assessment and quality control. (2) Use the value of solar parameters recorded in these databases to address today’s scientific questions and (3) disseminate the collections and added value.
For this, modern methods for statistical quality control must be used and adapted. As this is a growing database that still receives data on a daily basis, the process of determining a multi-station reference needs to be done dynamically. For statistical purposes, the project needs everyone with different backgrounds, a different knowledge and experience. The Val-u-Sun team has set up a citizen science website where you'll be guided through a fairly simple tutorial. You'll learn about the way people who actually work as solar observers draw and count sunspot groups. And finally you will be asked to count them as any other solar observer.
So, you can help the project by counting sunspots and groups of sunspots on the original drawings from the ROB's archive. A selection of drawings has been made, from different phases of the Sun's activity. Some have a lot of sunspots and sunspot groups, some have only a few. The drawings you get have already been counted and analyzed by the project team. The goal of this project is to compare statistically the number of sunspots counted by the project team against those found by others. Since the drawing and counting of the sunspots can be a little subjective, some point of comparison is needed. That would be you, dear reader! No worries: there is no good or bad answer, your best effort is perfect.
This citizen science project "Val-u-Sun" (http://sidc.be/valusun/citizenscience/index.php ) started already in October last
year, but it is now also available
- in Nederlands http://sidc.be/valusun/citizenscience/index-nl.php and
- en Français http://sidc.be/valusun/citizenscience/index-fr.php
Spread the word, and enjoy!

Solar Orbiter connects different generations and nations
Wednesday April 15 - a television broadcast about Solar Orbiter and our beloved EUI-instrument on the Dutch television.
We could tell the whole - Dutch speaking - world about our passion and work. We are flying to the Sun and we will be able photograph parts of the Sun which were never photographed before.
Besides data, this mission to the Sun shows that science connects different generations and nations, a comforting idea during these hard times.
Astronomer Kees de Jager (1921) and television presentator Lieven Scheire are watching the launch of Solar Orbiter.
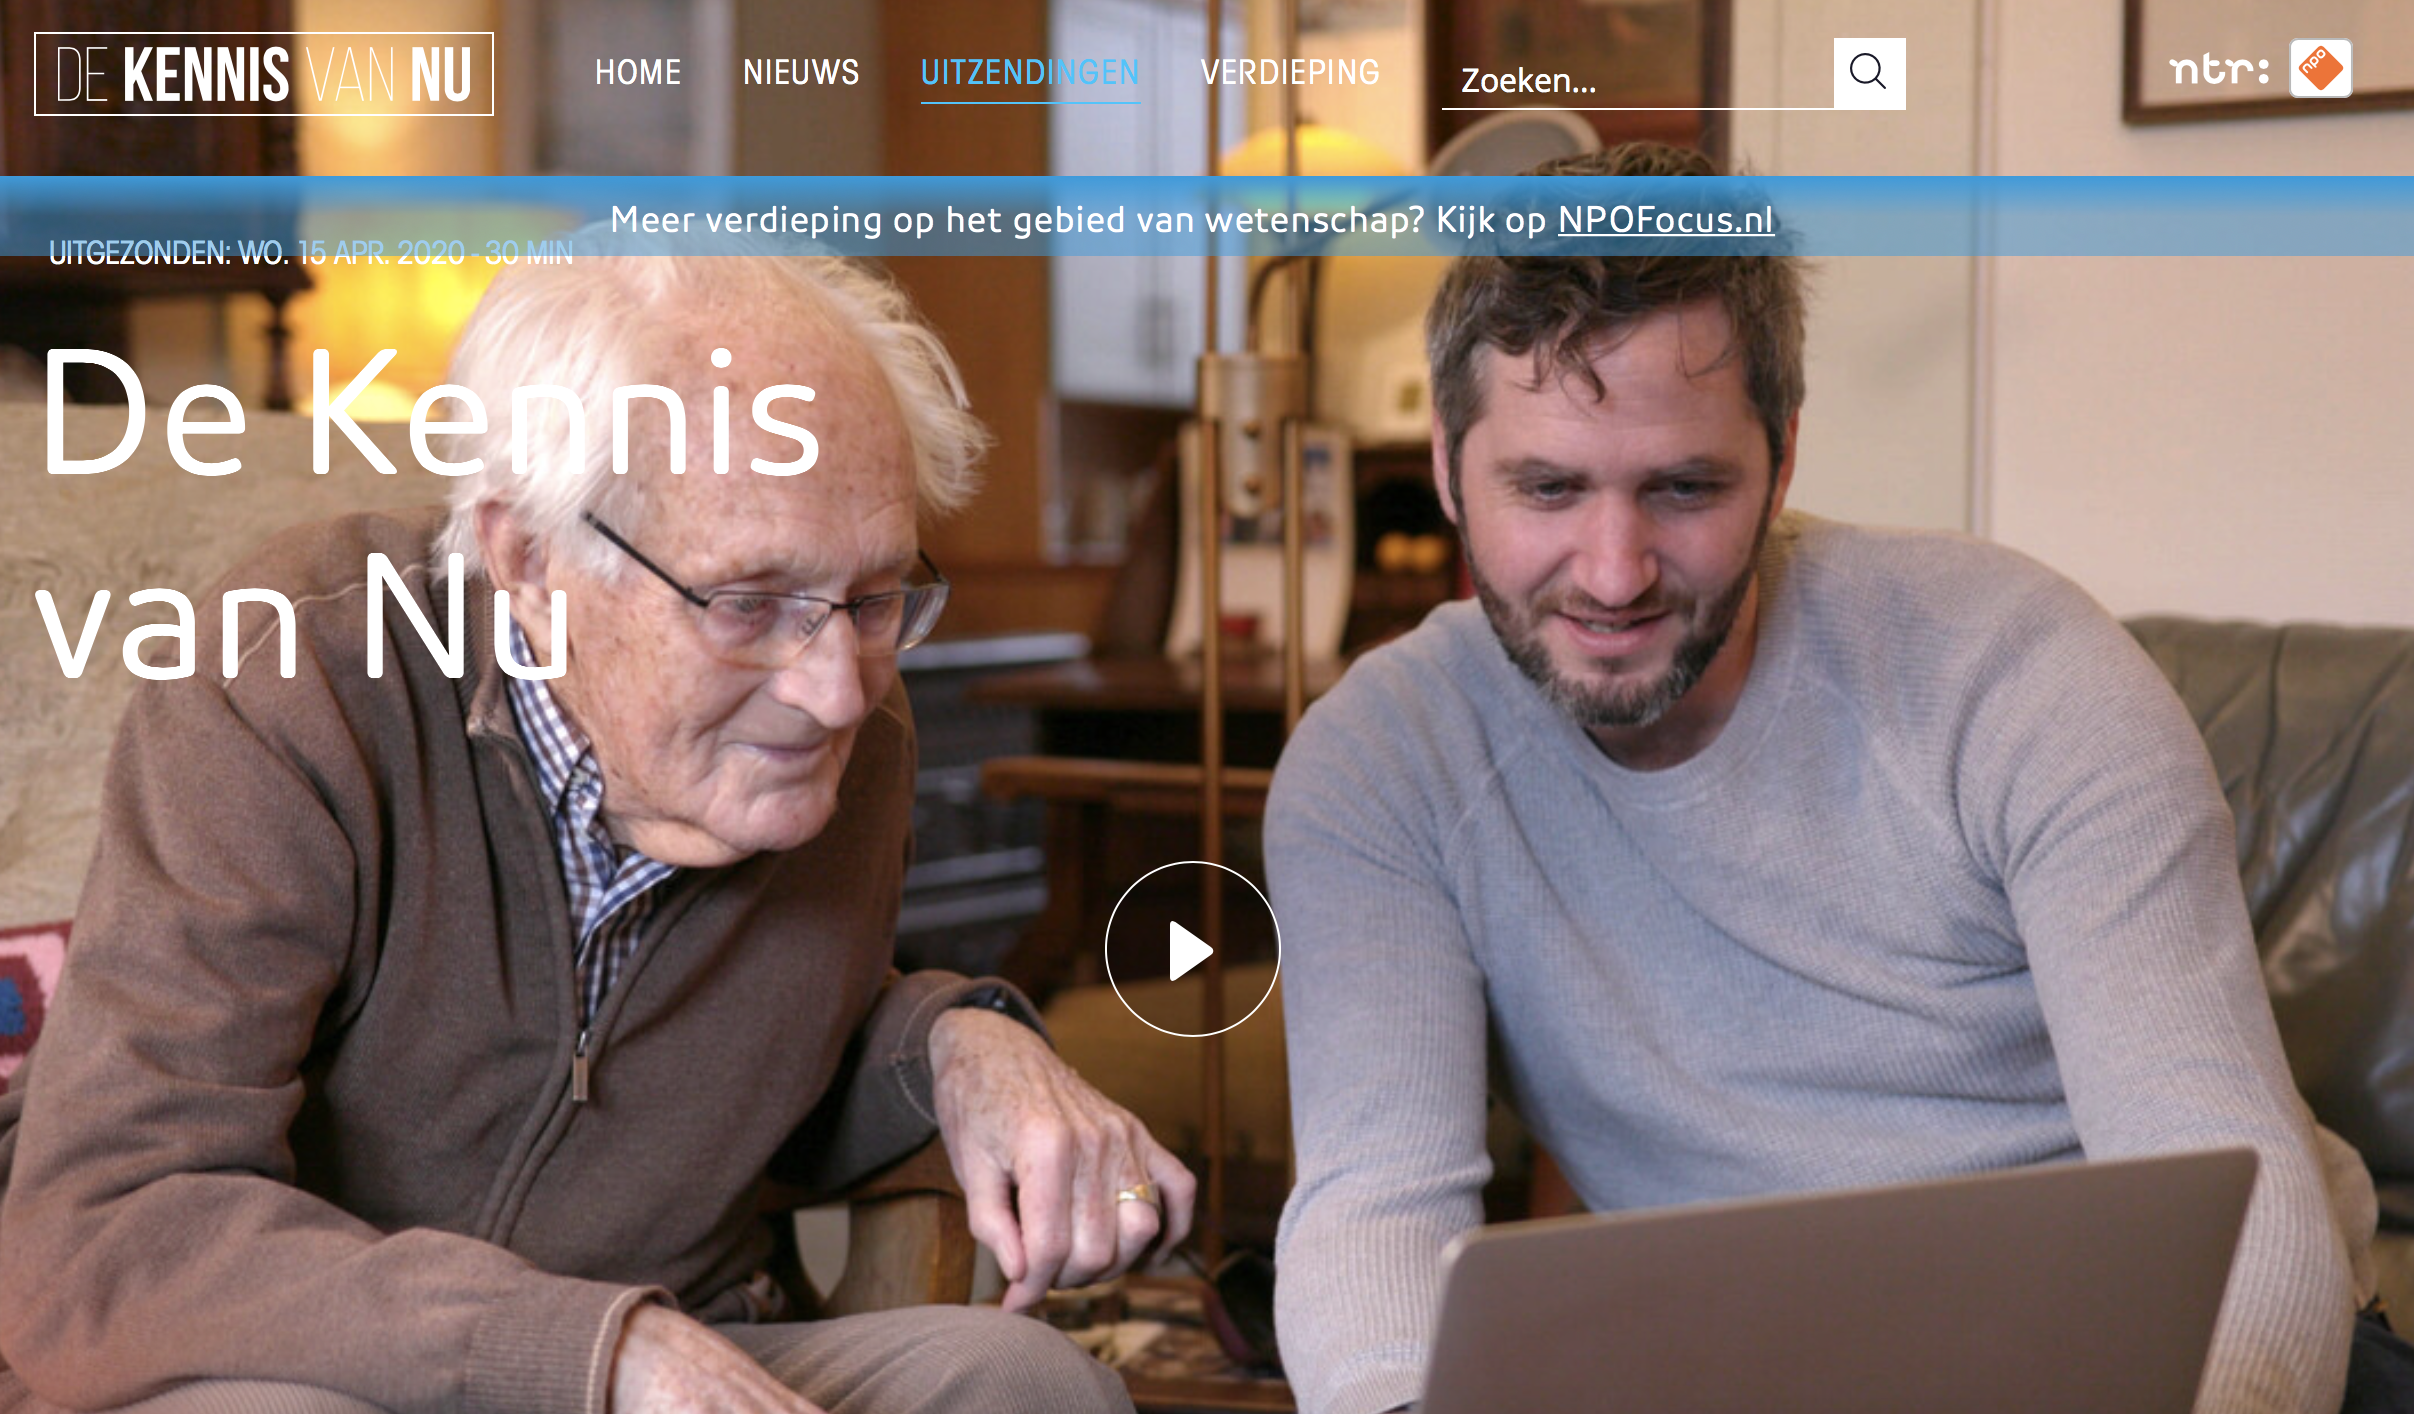
STCE scientists explain - in Dutch, sorry: https://www.dekennisvannu.nl/site/media/De-Kennis-van-Nu/VPWON_1308684
Enjoy!
Review of solar and geomagnetic activity
SOLAR ACTIVITY
Solar activity was low though former region NOAA 2759 did still produce some low B class flares at the start of the week.
No Earth directed Coronal Mass Ejections (CMEs) were observed in the available coronagraphic imagery.
The greater than 10 MeV proton flux was at nominal levels throughout the week
The greater than 2 MeV electron flux was at moderate levels.
GEOMAGNETIC ACTIVITY
Solar wind showed just two moderate enhancements. A first one, related to an isolated equatorial coronal hole, reaching a peak speed of 500 km/s late April 8, and a total magnetic field strength of 12nT in the compression region. A second one, related to an extension of the southern polar coronal hole, reaching only to around 450 km/s on April 12, and with magnetic field not above 8nT. In between, speed dropped to a background 350 km/s.
Geomagnetic conditions reached active levels in response to the first mentioned solar wind enhancement, while only reaching unsettled levels during the second. Otherwise geomagnetic conditions were quiet.
PROBA2 Observations (6 Apr 2020 - 12 Apr 2020)
Solar Activity
Solar flare activity was very low during the week.
In order to view the activity of this week in more detail, we suggest to go to the following website from which all the daily (normal and difference) movies can be accessed: https://proba2.oma.be/ssa
This page also lists the recorded flaring events.
A weekly overview movie can be found here (SWAP week 524): https://proba2.sidc.be/swap/data/mpg/movies/weekly_movies/weekly_movie_2020_04_06.mp4
Details about some of this week's events can be found further below.
If any of the linked movies are unavailable they can be found in the P2SC movie repository here: https://proba2.oma.be/swap/data/mpg/movies/
Friday Apr 10
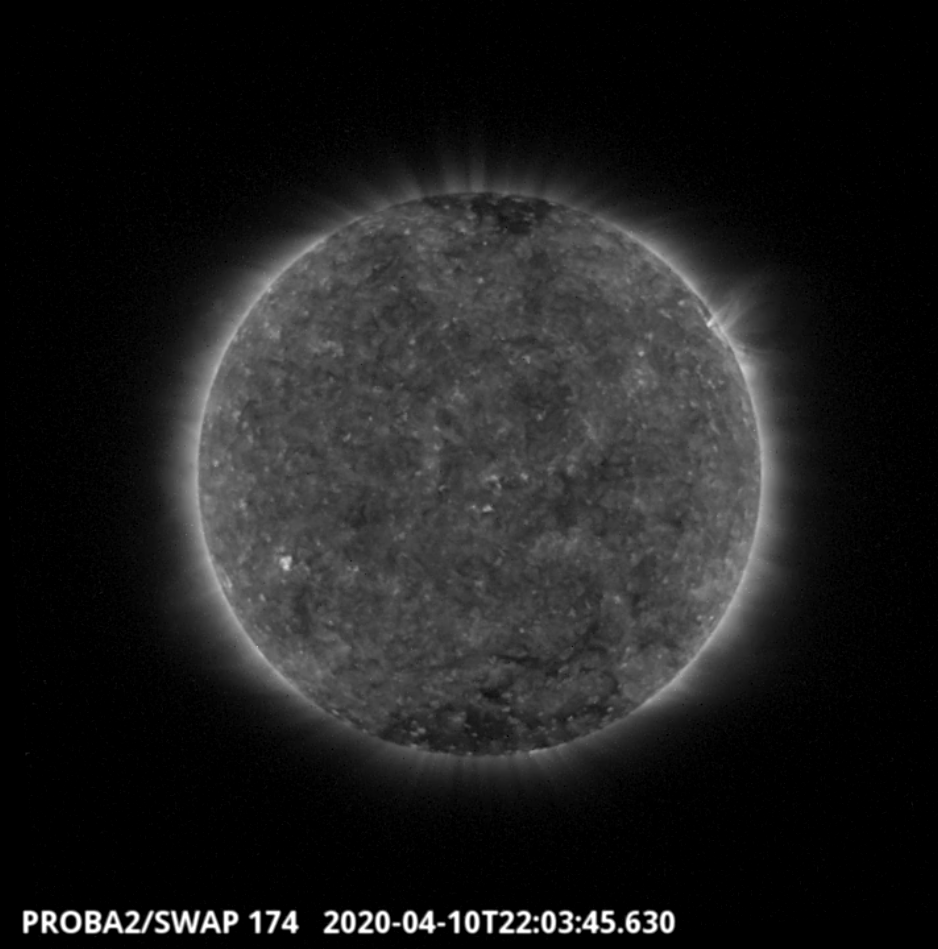
An eruption was observed by SWAP on the north-west limb of the Sun on 2020-Apr-10 as shown in the SWAP image above taken at 22:03 UT.
Find a movie of the event here (SWAP movie): https://proba2.sidc.be/swap/movies/20200410_swap_movie.mp4
The International Sunspot Number by SILSO
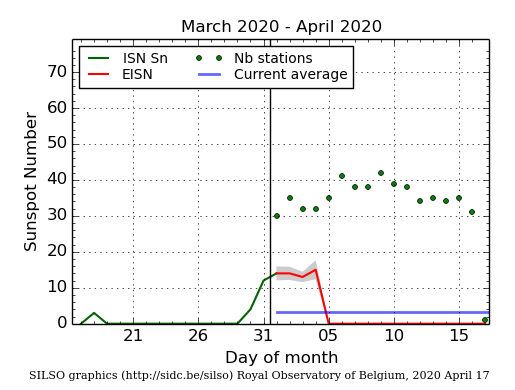
The daily Estimated International Sunspot Number (EISN, red curve with shaded error) derived by a simplified method from real-time data from the worldwide SILSO network. It extends the official Sunspot Number from the full processing of the preceding month (green line). The plot shows the last 30 days (about one solar rotation). The horizontal blue line shows the current monthly average, while the green dots give the number of stations included in the calculation of the EISN for each day.
Geomagnetic Observations at Dourbes (6 Apr 2020 - 12 Apr 2020)

Review of ionospheric activity (6 Apr 2020 - 12 Apr 2020)
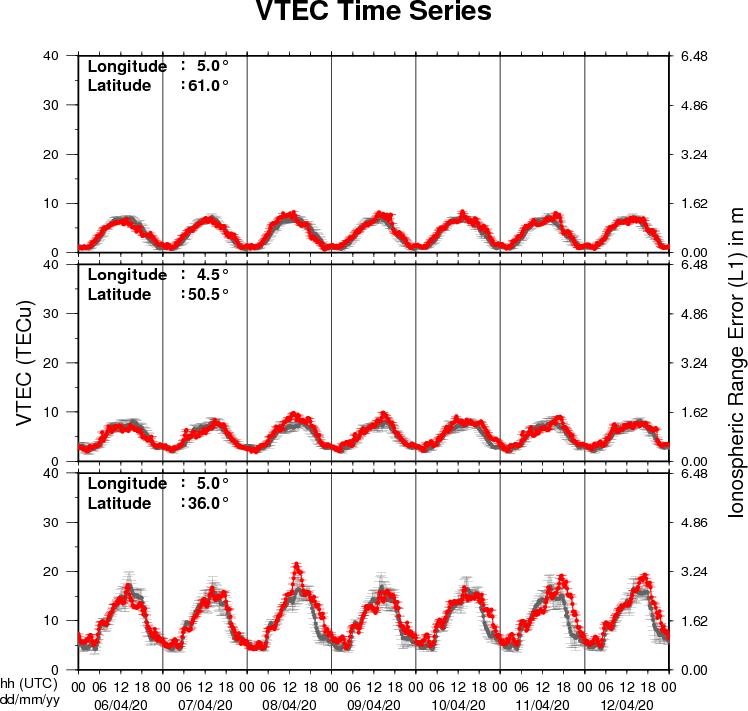
The figure shows the time evolution of the Vertical Total Electron Content (VTEC) (in red) during the last week at three locations:
a) in the northern part of Europe(N61°, 5°E)
b) above Brussels(N50.5°, 4.5°E)
c) in the southern part of Europe(N36°, 5°E)
This figure also shows (in grey) the normal ionospheric behaviour expected based on the median VTEC from the 15 previous days.
The VTEC is expressed in TECu (with TECu=10^16 electrons per square meter) and is directly related to the signal propagation delay due to the ionosphere (in figure: delay on GPS L1 frequency).
The Sun's radiation ionizes the Earth's upper atmosphere, the ionosphere, located from about 60km to 1000km above the Earth's surface.The ionization process in the ionosphere produces ions and free electrons. These electrons perturb the propagation of the GNSS (Global Navigation Satellite System) signals by inducing a so-called ionospheric delay.
See http://stce.be/newsletter/GNSS_final.pdf for some more explanations ; for detailed information, see http://gnss.be/ionosphere_tutorial.php