- Table of Content
- 1.Three pairs
- 2.Review of sola...
- 3.PROBA2 Observa...
- 4.The internatio...
- 5.Geomagnetic Ob...
- 6.The SIDC space...
- 7.Review of iono...
2. Review of solar activity
3. PROBA2 Observations
4. The international Sunspot Number by SILSO - new representation
5. Geomagnetic Observations at Dourbes
6. The SIDC space weather Briefing
7. Review of ionospheric activity
Three pairs
After the Sun being spotless from 5 till 24 April, a small sunspot group started to develop close to the solar equator. NOAA 2760 belonged to the old solar cycle 24, and had a latitude of -7 degrees. NOAA 2760 was the most prominent sunspot region of the week. In the SDO/HMI imagery underneath, it is indicated by a blue ellipse in the white light image (left), the magnetogram is on the right and was taken at the same time as the white light image.
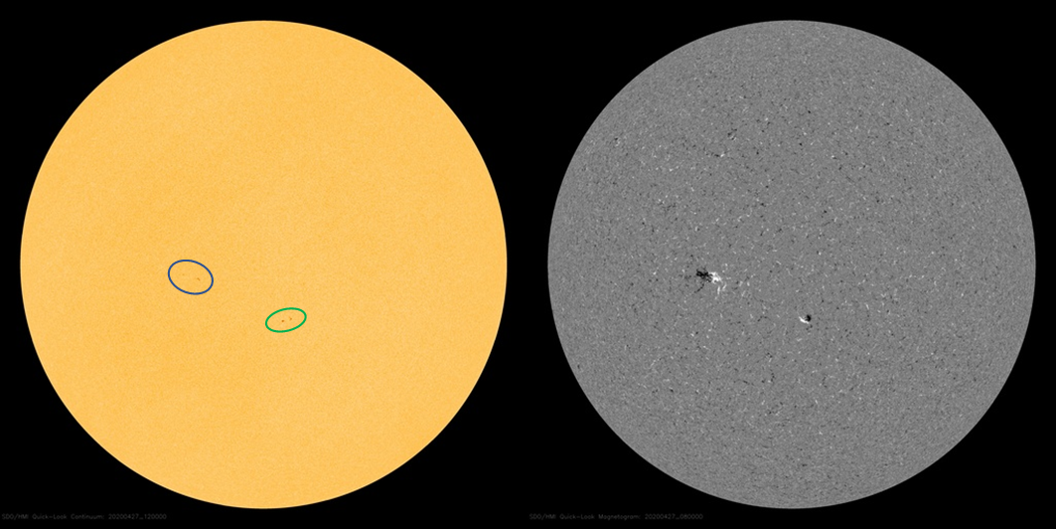
On 27 and 28 April, it got the company of a sunspot group at a more southern latitude (-18 degrees, indicated by the green ellipse). NOAA 2761 was a small bipolar region belonging to the new solar cycle 25. This can be seen in the magnetogram above where it has a magnetic polarity opposite (white and black reversed) to that of the old cycle region NOAA 2760. More on magnetic polarities in sunspot regions can be found in this STCE Newsitem at http://www.stce.be/news/422/welcome.html
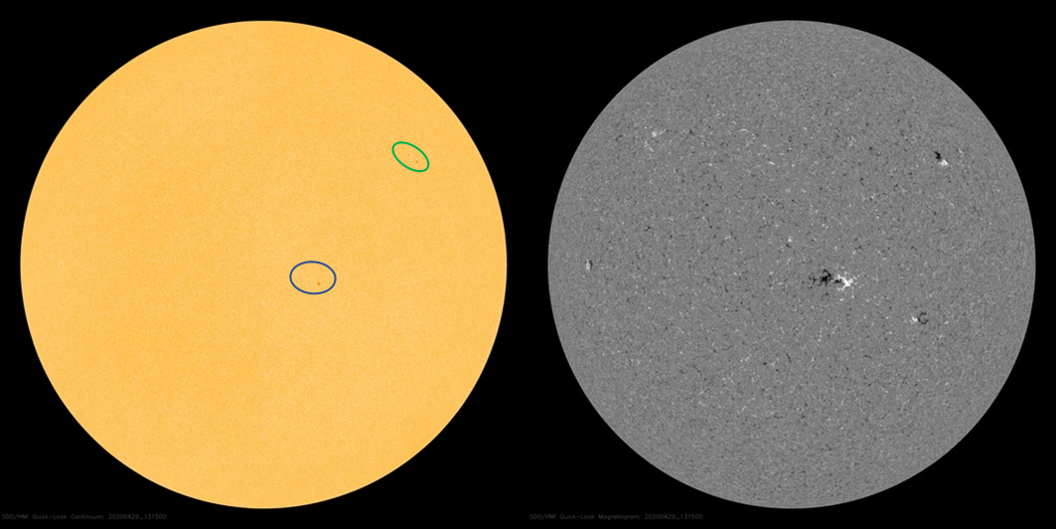
On 29 April, with NOAA 2761 already being spotless, NOAA 2762 developed in the northwest quadrant at a latitude of 23 degrees (image above). This new partner of NOAA 2760 had the same polarity as the visible old cycle group on the southern hemisphere (white leading), hence belonging to the new solar cycle. NOAA 2762 was also the source of 2 minor B-class x-ray flares, despite its short lifetime of less than a day.
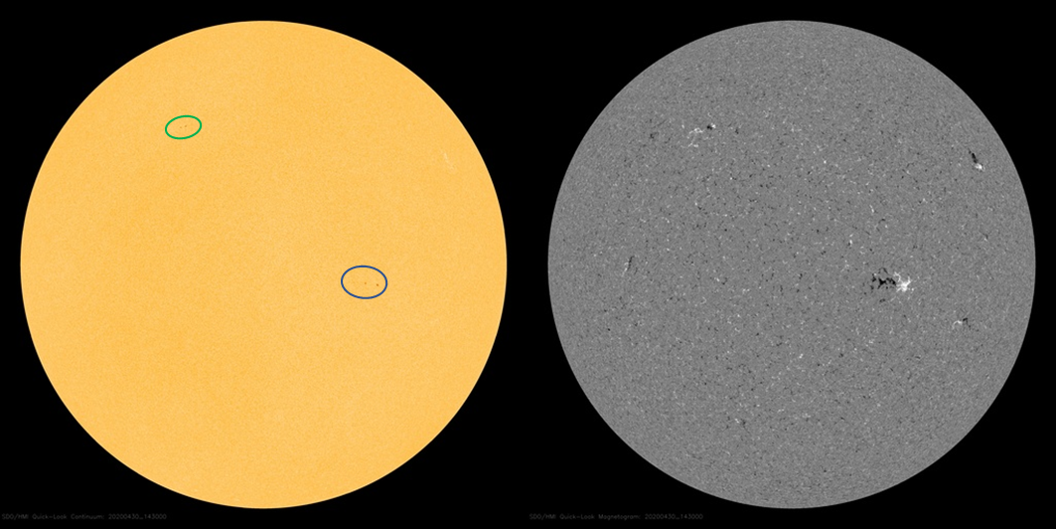
Finally, on 30 April, NOAA 2760 paired up with another SC25 group. This time, a small and very short-lived (hours!) sunspot region was visible in the northeast quadrant at a latitude of 32 degrees (image above). NOAA 2763 had also the same magnetic polarity opposite as NOAA 2760, and thus belonged to the new solar cycle. The appearance of 3 new cycle groups in barely a week time confirms we are gradually leaving solar cycle minimum behind us.
Review of solar activity
SOLAR ACTIVITY
The solar activity was at low levels over the past week with only two B-class flares reported. The B-class flares both originated from NOAA AR 2762. Four sunspot groups were observed on the solar disc over the week, numbered NOAA ARs 2760 to 2763.
A filament eruption on April 27 was considered to have a possible Earth directed component. The greater than 10 MeV proton flux was at nominal values. The greater than 2 MeV electron flux was between background and moderate levels.
Two small patchy equatorial coronal holes were observed on the solar disk this week. The first was a small positive polarity coronal hole that reached the central meridian on April 26. The second was a negative polarity coronal hole that reached the central meridian on May 01.
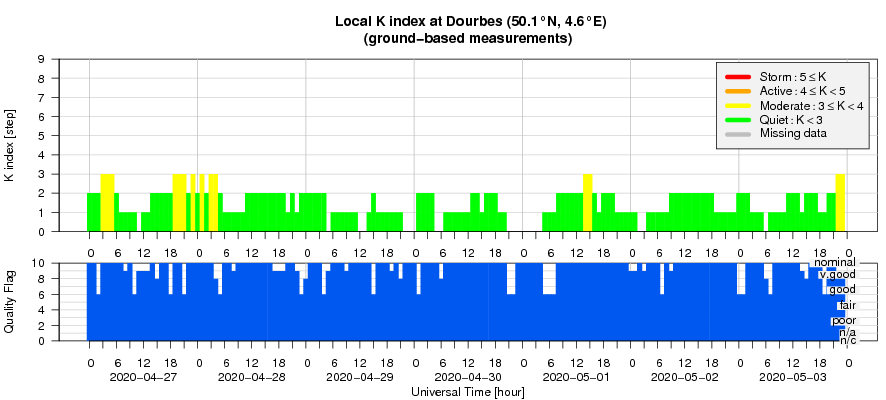
GEOMAGNETIC ACTIVITY
The solar wind parameters were mostly at background levels with some minor enhancements. In the beginning of the week, the solar wind speed was slightly enhanced with values around 450 km/s. The solar wind speed then slowly decreased and reached a minimum value of about 270 km/s on April 30. On May 01 and May 02, the solar wind parameters were mostly at nominal values with minor enchantments observed in the total interplanetary magnetic field (IMF), where the total IMF peaked at 7.8 nT and the Bz component fluctuated between -6 nT and 5 nT.
The geomagnetic conditions were quiet with a few periods of unsettled conditions (local K Dourbes and NOAA Kp recorded values between 0-3).
PROBA2 Observations
Solar Activity
Solar flare activity was very low during the week.
In order to view the activity of this week in more detail, we suggest to go to the following website from which all the daily (normal and difference) movies can be accessed: https://proba2.oma.be/ssa
This page also lists the recorded flaring events.
A weekly overview movie can be found here (SWAP week 527). http://proba2.oma.be/swap/data/mpg/movies/weekly_movies/weekly_movie_2020_04_27.mp4
Details about some of this week's events can be found further below.
If any of the linked movies are unavailable they can be found in the P2SC movie repository here https://proba2.oma.be/swap/data/mpg/movies/
Monday Apr 27
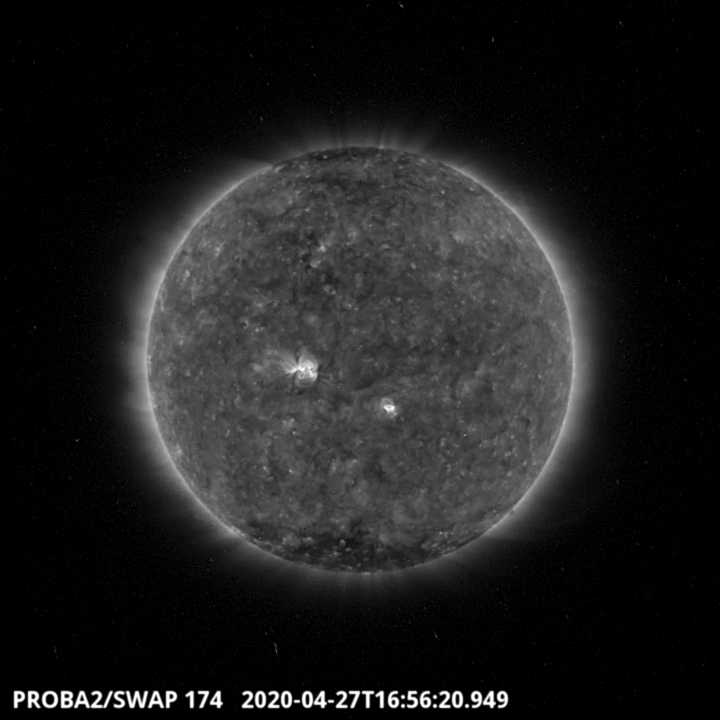
Flows were observed in the North East of the Sun, followed by a filament eruption around 16:56 UT - which can be seen in the SWAP image above. Find a movie of the events here (SWAP movie)
http://proba2.oma.be/swap/data/mpg/movies/20200427_swap_movie.mp4
Friday May 01
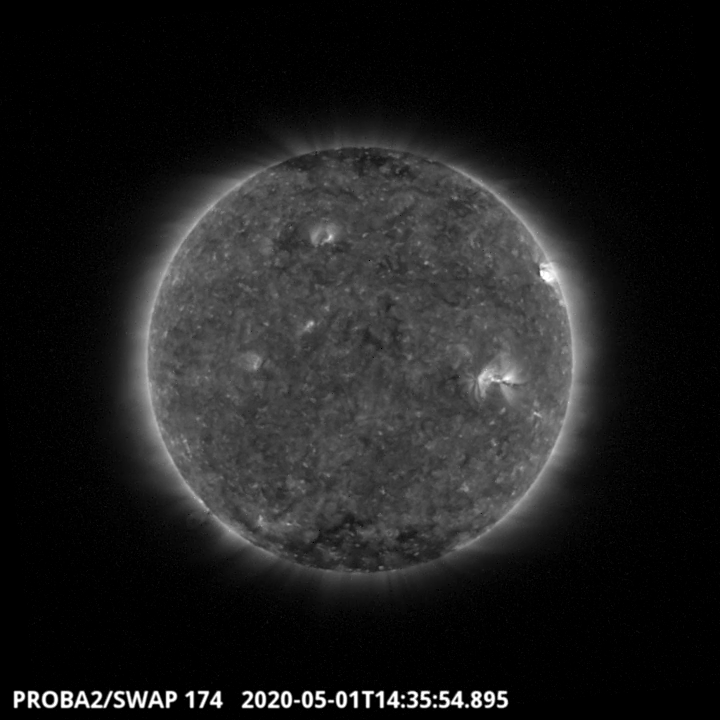
An active region on North-Western Limb, labelled NOAA 2762, gave rise to a B2.6 flare around 14:36 UT, the largest of two B-class flares to occur this week. Find a movie of the events here (SWAP movie) http://proba2.oma.be/swap/data/mpg/movies/20200501_swap_movie.mp4
The international Sunspot Number by SILSO - new representation
The graph has changed!
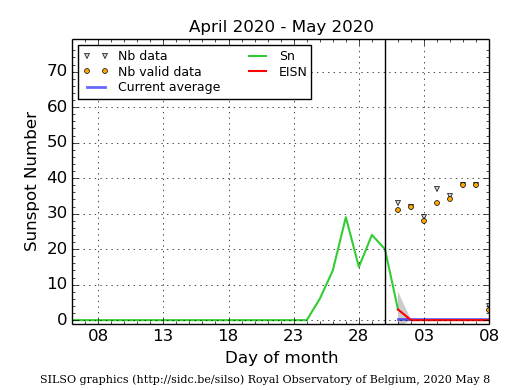
The daily Estimated International Sunspot Number (EISN, red curve with shaded error) derived by a simplified method from real-time data from the worldwide SILSO network. It extends the official Sunspot Number from the full processing of the preceding month (green line). The plot shows the last 30 days (about one solar rotation). The horizontal blue line shows the current monthly average. The yellow dots gives the number of stations that provided valid data. Valid data are used to calculate the EISN. The triangle gives the number of stations providing data. When a triangle and a yellow dot coincide, it means that all the data is used to calculate the EISN of that day.
Geomagnetic Observations at Dourbes
The SIDC space weather Briefing
The Space Weather Briefing presented by the forecaster on duty from April 26 to May 3. It reflects in images and graphs what is written in the Solar and Geomagnetic Activity report.
The pdf-version: http://www.stce.be/briefings/20200504_SWbriefing.pdf
The automatically running presentation: http://www.stce.be/briefings/20200504_SWbriefing.ppsm
Review of ionospheric activity
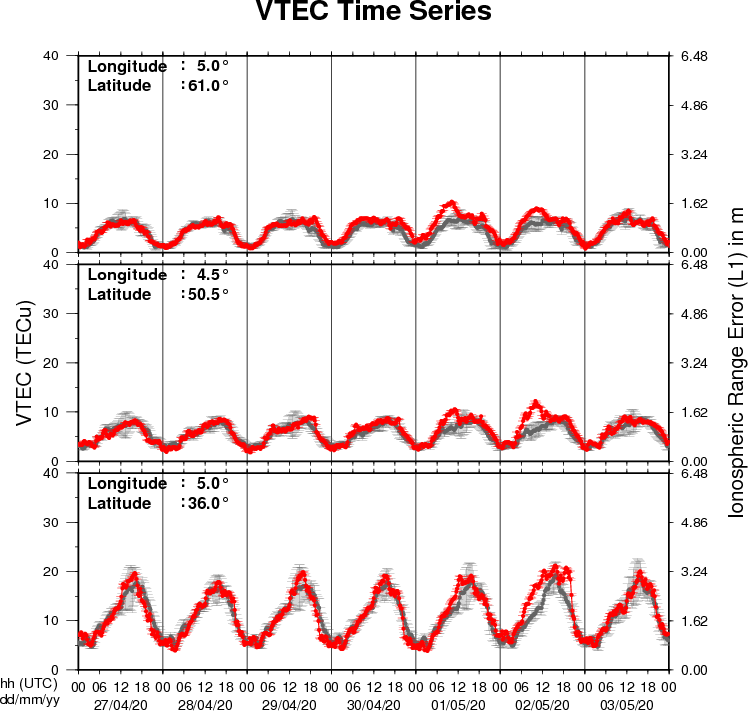
The figure shows the time evolution of the Vertical Total Electron Content (VTEC) (in red) during the last week at three locations:
a) in the northern part of Europe(N61°, 5°E)
b) above Brussels(N50.5°, 4.5°E)
c) in the southern part of Europe(N36°, 5°E)
This figure also shows (in grey) the normal ionospheric behaviour expected based on the median VTEC from the 15 previous days.
The VTEC is expressed in TECu (with TECu=10^16 electrons per square meter) and is directly related to the signal propagation delay due to the ionosphere (in figure: delay on GPS L1 frequency).
The Sun's radiation ionizes the Earth's upper atmosphere, the ionosphere, located from about 60km to 1000km above the Earth's surface.The ionization process in the ionosphere produces ions and free electrons. These electrons perturb the propagation of the GNSS (Global Navigation Satellite System) signals by inducing a so-called ionospheric delay.
See http://stce.be/newsletter/GNSS_final.pdf for some more explanations ; for detailed information, see http://gnss.be/ionosphere_tutorial.php