- Table of Content
- 1.Bright faculae...
- 2.SC24: a geomag...
- 3.Review of sola...
- 4.PROBA2 Observa...
- 5.PROBA2 Observa...
- 6.The Internatio...
- 7.Geomagnetic Ob...
- 8.Geomagnetic Ob...
- 9.The SIDC space...
- 10.Review of iono...
- 11.Review of iono...
2. SC24: a geomagnetic dud
3. Review of solar and geomagnetic activity
4. PROBA2 Observations (11 May 2020 - 17 May 2020)
5. PROBA2 Observations (18 May 2020 - 24 May 2020)
6. The International Sunspot Number by SILSO - new representation
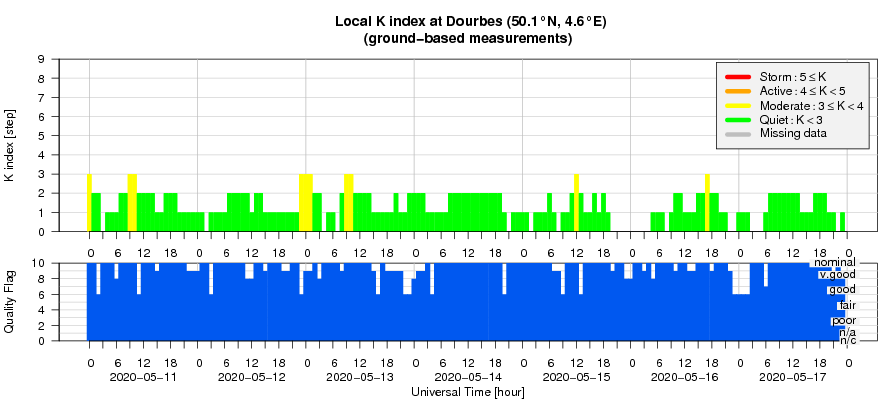
7. Geomagnetic Observations at Dourbes (11 May 2020 - 17 May 2020)
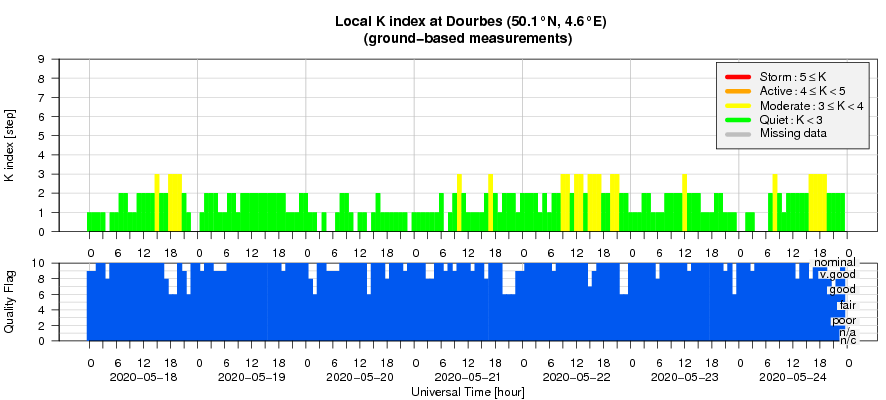
8. Geomagnetic Observations at Dourbes (18 May 2020 - 24 May 2020)
9. The SIDC space weather Briefing
10. Review of ionospheric activity (11 May 2020 - 17 May 2020)
11. Review of ionospheric activity (18 May 2020 - 24 May 2020)
Bright faculae fields
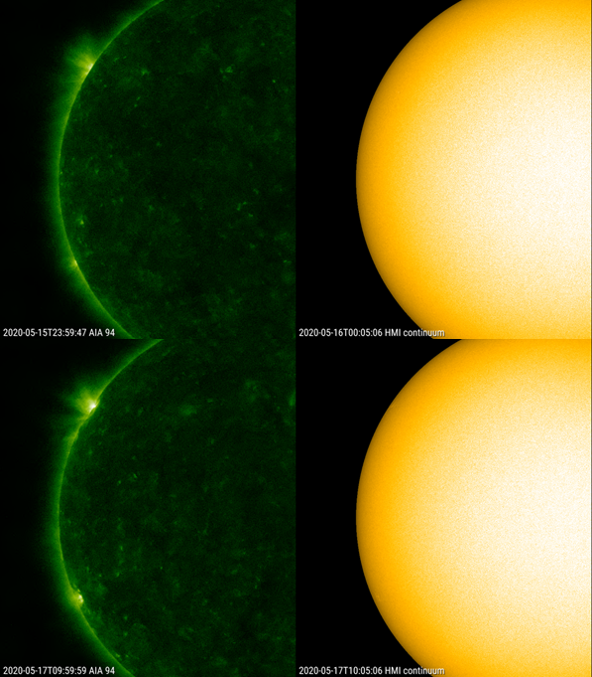
Late on 16 May, two bright faculae regions rounded the solar east limb. These regions manifested themselves already more than a day before, as the bright emission in extreme ultraviolet (EUV) imagery gave away their presence (see SDO imagery underneath). Faculae fields are areas of enhanced magnetic fields on the Sun. They can be the craddle for the development of new sunspots, and exist days to weeks after the sunspots have disappeared. There's a saying among solar observers that every sunspot has its faculae field, but not every faculae field has a sunspot.
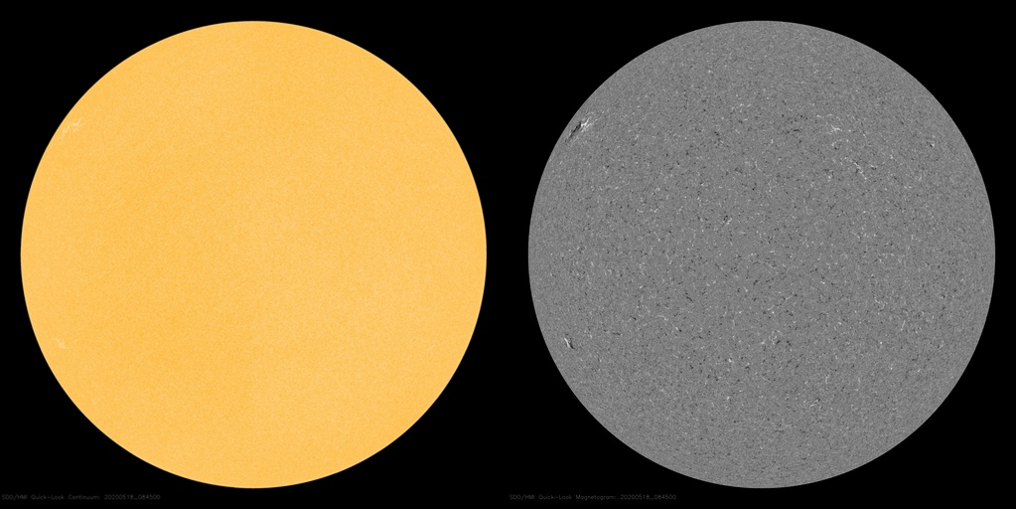
As the active regions rounded the east limb and became better visible, it became clear that these faculae fields were spotless. They did not get a NOAA or Catania number. It's too bad, because their magnetic configuration as well as their high latitude (resp. near +32 degrees and -23 degrees) clearly indicated these regions belonged to the new solar cycle. See this STCE news item at http://www.stce.be/news/422/welcome.html on how to distinguish sunspots from the new and the old solar cycle. The lack of sunspots also resulted in insignificant flaring, and the solar activity remained at very low levels. Nonetheless, solar observers commented on the brightness of the faculae fields and in particular the one near the northeast limb. They considered it the brightest they had seen in a long while - which is no surprize in view of the long and deep minimum leaving the Sun featureless for weeks on end.
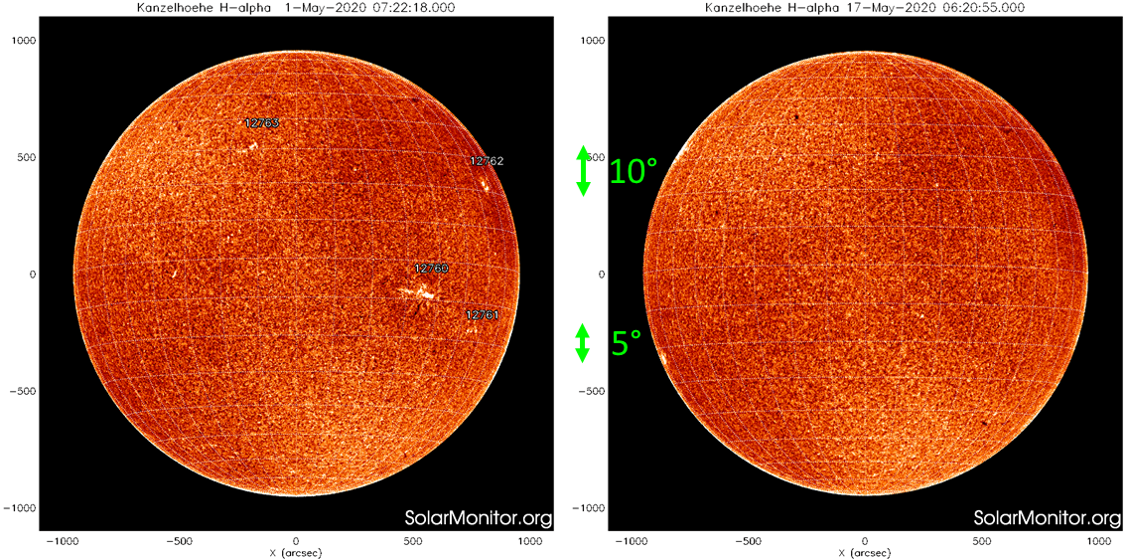
It was tempting to conclude that these regions were the re-appearance of the former sunspot groups NOAA 2762 and 2761, which rounded the west limb just about two weeks earlier. However, they are not and the two faculae fields that became visible are genuinely new active regions. There are two reasons for this. First of all, the two regions are clearly situated more poleward than the former sunspot regions: about 10 degrees for the northeast region, and about 5 degrees for the southeast regions. See the annotated image underneath.
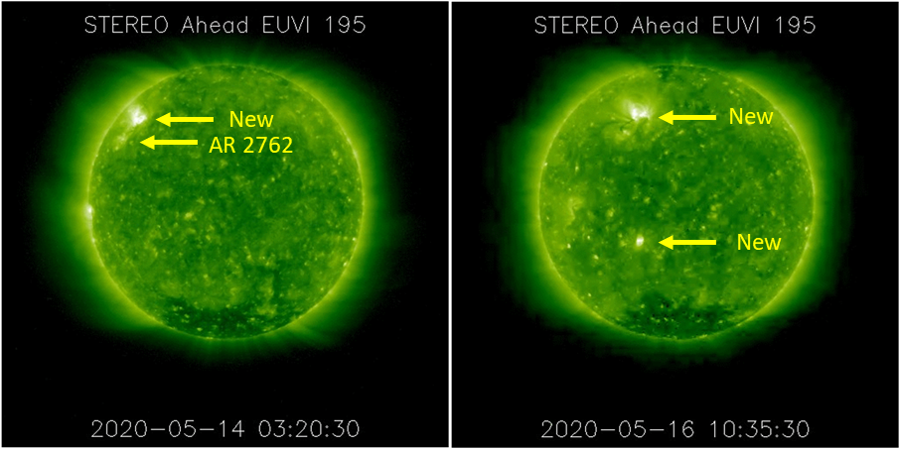
The second reason can be seen in EUV imagery by the STEREO-A satellite, which is now about 73 degrees trailing the Earth. These images clearly show the new (northeast) region about 10 degrees north of the decaying (weakening) region NOAA 2762. NOAA 2761 had already fully disappeared by the time it rotated into view of STEREO's EUV imager, and a new region can clearly be seen developing just days before rounding the east limb as seen from Earth.
SC24: a geomagnetic dud
In previous STCE newsitems (e.g. here http://www.stce.be/news/441/welcome.html and here http://www.stce.be/news/243/welcome.html ), it has been pointed out several times that the solar cycle 24 (SC24) is a real underperformer with respect to geomagnetic activity. No extremely severe geomagnetic storms, no memorable polar light displays at moderate to equatorial latitudes, barely a few days with severe geomagnetic conditions,... : SC24 really is a huge disappointment as far as geomagnetic activity is concerned.
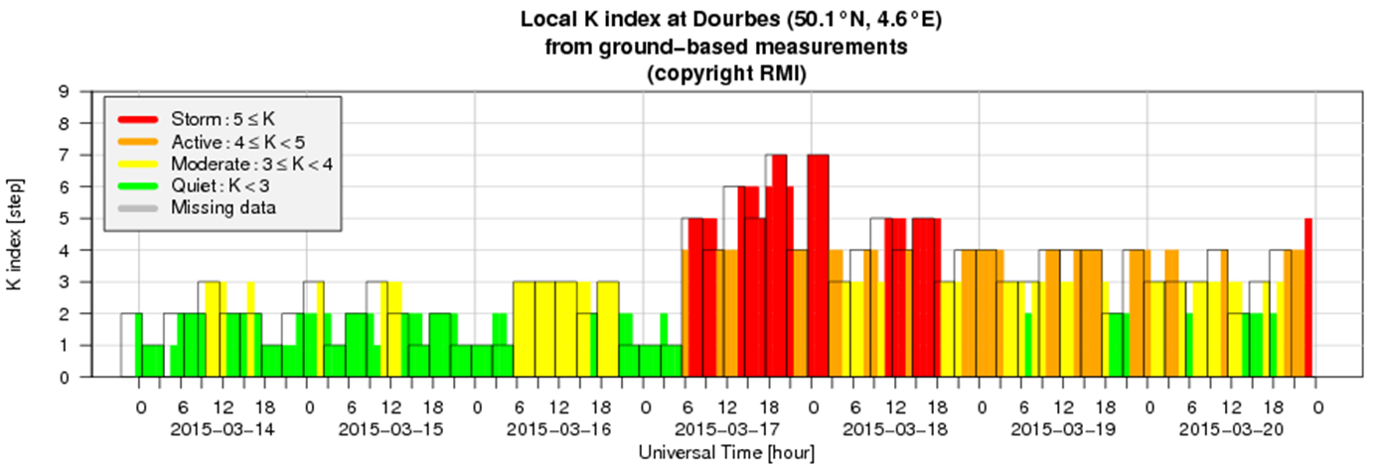
Observations and recordings of the last few years have simply confirmed this conclusion. Covering the period from January 2009 till April 2020, there's now a good view on the full cycle of geomagnetic activity. The most often used parameter is the Kp-index, introduced by Julius Bartels in 1949 and extended back to 1932. This 3-hour range index is derived from magnetic recordings done in 13 subauroral observatories. This unitless index is expressed in thirds, usually written as 0o,0+,1-,1o,1+,2-, ... ,8+,9-,9o. The estimated Kp (as shown on the NOAA/SWPC website - https://www.swpc.noaa.gov/products/planetary-k-index ) and the local K indices are all expressed in full numbers (0,1, ... ,8,9). Low values such as "0" or "1" mean quiet geomagnetic conditions, whereas the highest possible values "8" or "9" mean resp. severe and extremely severe geomagnetic conditions. Note the scale is open-ended, i.e. no matter how large the geomagnetic variation is, Kp will never exceed 9. The example underneath shows the strongest geomagnetic storm of SC24 as recorded by the geomagnetic observatory in Dourbes (Belgium - http://ionosphere.meteo.be/geomagnetism/ground_K_dourbes/ ) on 17-18 March 2015.
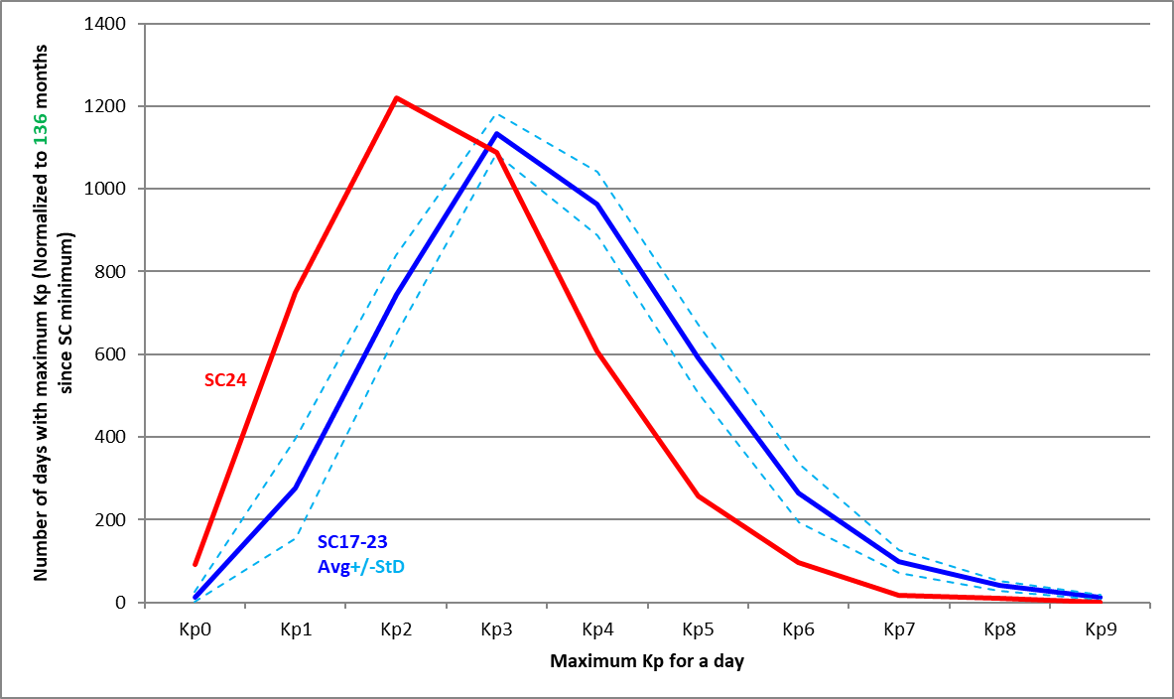
A quick analysis of the final Kp indices as archived at the Kyoto World Data Centre (WDC) for geomagnetism at http://wdc.kugi.kyoto-u.ac.jp/index.html reveals that SC24 is a true underachiever. Not only has there not been a single day day with extreme geomagnetic storming, SC24 has also recorded a lot less storming days (Kp of 5 or greater) and a lot more "quiet" days (Kp of 2 or smaller) compared to the average of the previous 7 solar cycles (SC17-23). This can be seen in the graph underneath, with the blue-dashed lines reflecting the standard deviation. All cycles were brought back to the same time span of 136 months ("normalized").
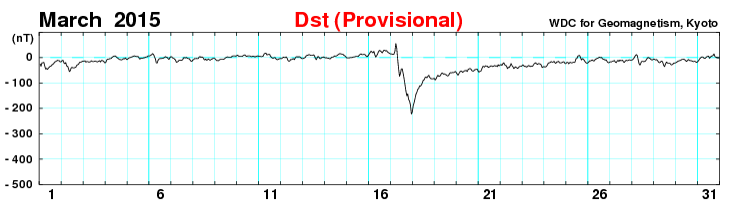
Another parameter that is often used to gauge the intensity of a geomagnetic storm is the Disturbance storm time index (Dst), available since January 1957. It is considered to reflect variations in the intensity of the ring current that circles Earth at altitudes ranging from about 3 to 8 earth radii. It is calculated as an hourly index from the horizontal magnetic field component (H) at four observatories located close enough to the magnetic equator that they are not strongly influenced by auroral current systems, but at the same time, far enough away from the magnetic equator so that they are not significantly influenced by the equatorial electrojet current that flows in the ionosphere. The Dst index is expressed in nT. An enhancement in the ring current results in a weakening of the earth's magnetic field (H-component), and so a strong geomagnetic storm is translated into a significantly negative value of Dst. As an example, during the Halloween storm of 30 October 2003, Dst reached -383 nT. An overview of the strongest geomagnetic storms (ranked according to their Dst) can be found in this STCE newsitem at http://www.stce.be/news/437/welcome.html , and a graph of the hourly Dst for the month of March 2015, reflecting the strongest geomagnetic storm of SC24, can be seen underneath.
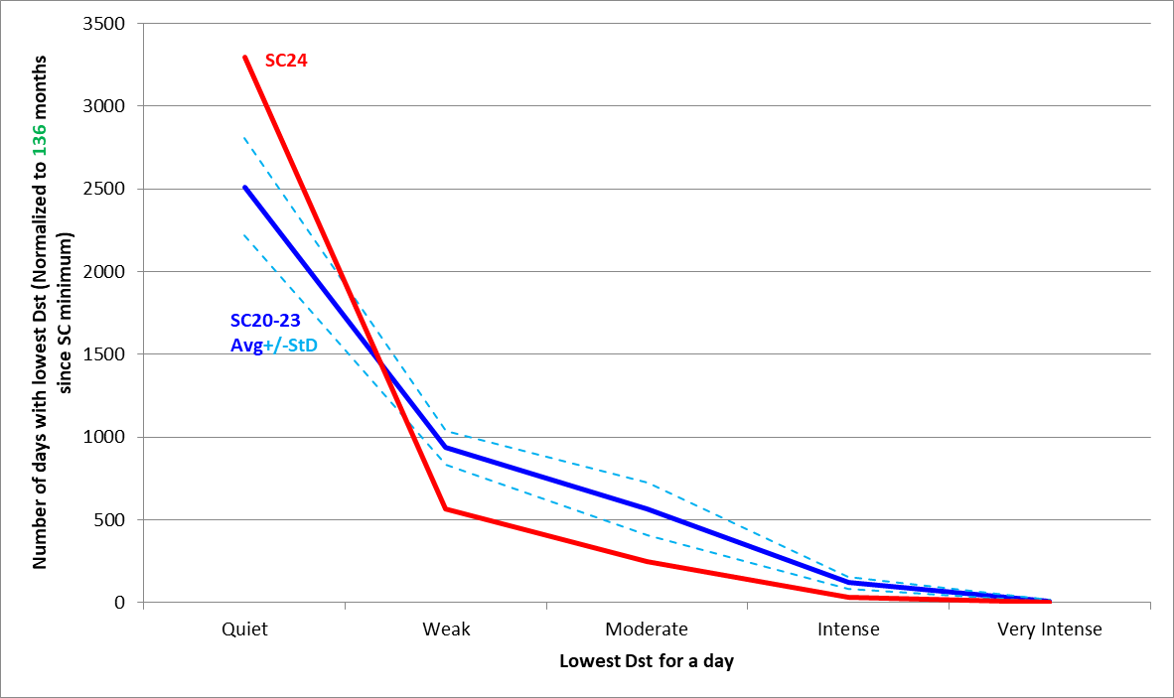
Geomagnetic storms can also be classified according to their minimum Dst values in 5 categories (see Echer et al. (2008): https://doi.org/10.1029/2007GL031755 and Waheed et al. (2019): https://doi.org/10.1007/s12648-019-01379-w ). Quiet days are days when Dst is greater than -30 nT, a storm is labeled weak if Dst is between -50 nT and -30 nT, moderate if Dst between -100 nT and -50 nT, intense if Dst between -250 nT and -100 nT, and very intense if Dst is smaller than -250 nT. A quick analysis of the Dst values as available at the Kyoto WDC for geomagnetism confirms that SC24 is really weak in terms of geomagnetic disturbances. Compared to the average of the previous 4 solar cycles (SC20-23), SC24 is overpopulated with quiet days, whereas it lacks a large number of days in the storm categories, with not a single "very intense" day. This can be seen in the graph underneath, with the blue-dashed lines reflecting the standard deviation. All cycles were brought back to the same time span of 136 months ("normalized"). SC24 really was a geomagnetic dud!
Review of solar and geomagnetic activity
May 11 - 17: SOLAR ACTIVITY
Solar activity was very low. The Sun was spotless. The 10.7cm solar radio flux ranged between 67 and 70 sfu. Two small active regions (ARs) rotated over the east limb on 16-17 May. Based on their latitudes (resp. at N32 and S23) and STEREO-A/EUVI imagery, these are not the return of former ARs NOAA 2762 and 2761 but genuinely new regions. They were the sources of minor A-class flares.
Small positive polarity equatorial coronal holes (CHs) transited the solar disk, as well as two weak extensions of the southern polar CH.
The greater than 10 MeV proton flux was at nominal values. The greater than 2 MeV electron flux was at nominal to low values.
A slow filament eruption took place on 13-14 May. No earth-directed coronal mass ejections (CMEs) were observed.
May 11 - 17: GEOMAGNETIC ACTIVITY
Solar wind speed was at background level and ranged between 280 and 350 km/s, with Bz varying between -5 and +4 nT. The direction of the interplanetary magnetic field changed from 'towards' to 'away' from the Sun (from negative to positive sector) on 14 May.
Geomagnetic activity was at quiet to unsettled.
May 18 - 25: SOLAR ACTIVITY
This bulletin is almost exactly the same as the one of the week before. Look for the difference!
Solar activity was very low. The Sun was spotless. The 10.7cm solar radio flux ranged between 69 and 71 sfu. The northern active region that rotated over the east limb on 17 May, continued crossing the solar disk while the southern decayed. They way still the source of minor A-class flares.
Some small negative polarity equatorial CHs transited the solar disk, as well as two weak extensions of the southern polar CH.
The greater than 10 MeV proton flux was at nominal values. The greater than 2 MeV electron flux was at nominal to low values.
No filament eruptions took place. No earth-directed coronal mass ejections (CMEs) were observed.
May 18 - 25: GEOMAGNETIC ACTIVITY
The solar wind was at the slow regime, with a small enhancement on May 18-21. The solar wind speed ranged between 285 and 420 km/s, with Bz varying between -6 and +6 nT. The direction of the interplanetary magnetic field was variable throughout the week, reflecting a patchy Sun and a helipspheric current sheet close to the equator. Geomagnetic activity was at quiet to unsettled levels.
PROBA2 Observations (11 May 2020 - 17 May 2020)
Solar Activity
Solar flare activity was very low during the week.
In order to view the activity of this week in more detail, we suggest to go to the following website from which all the daily (normal and difference) movies can be accessed: https://proba2.oma.be/ssa
This page also lists the recorded flaring events.
A weekly overview movie can be found here (SWAP week 529). http://proba2.oma.be/swap/data/mpg/movies/weekly_movies/weekly_movie_2020_05_11.mp4
Details about some of this week's events can be found further below.
If any of the linked movies are unavailable they can be found in the P2SC movie repository here
Wednesday May 13
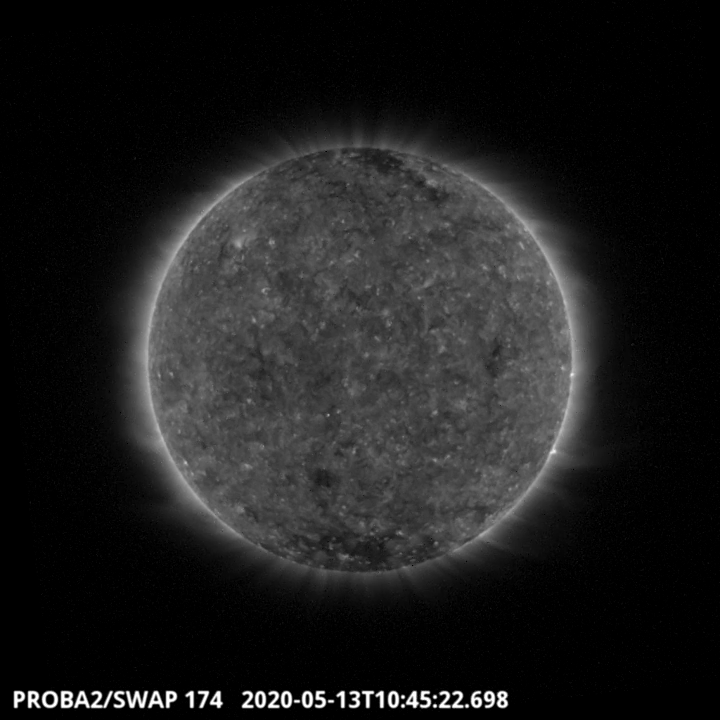
A small extended coronal hole is visible in the Southern hemisphere of the Sun in the SWAP image above, on 2020-May-13 around 10:45 UT. Find a movie of the events here (SWAP movie)
http://proba2.oma.be/swap/data/mpg/movies/20200513_swap_movie.mp4
Friday May 15
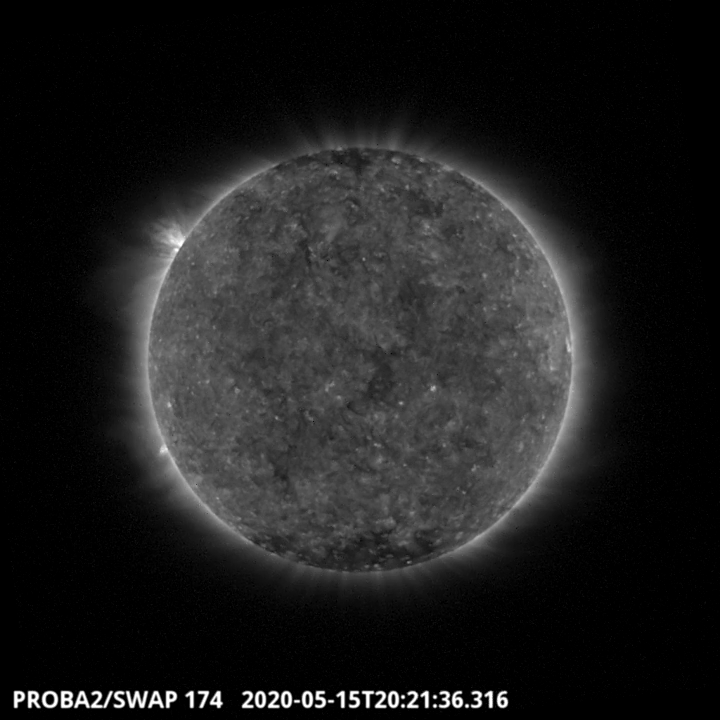
Two active regions are visible on the East limb in the SWAP image above. The southern active region gave rise to an A7.9 flare around 20:21 UT. A central coronal hole is also visible and can be seen near the solar disk centre. Find a movie of the events here (SWAP movie)
http://proba2.oma.be/swap/data/mpg/movies/20200515_swap_movie.mp4
PROBA2 Observations (18 May 2020 - 24 May 2020)
Solar Activity
Solar flare activity was very low during the week.
In order to view the activity of this week in more detail, we suggest to go to the following website from which all the daily (normal and difference) movies can be accessed: https://proba2.oma.be/ssa
This page also lists the recorded flaring events.
A weekly overview movie can be found here (SWAP week 530): https://proba2.sidc.be/swap/data/mpg/movies/weekly_movies/weekly_movie_2020_05_18.mp4
Details about some of this week's events can be found further below.
If any of the linked movies are unavailable they can be found in the P2SC movie repository here: https://proba2.oma.be/swap/data/mpg/movies/
Saturday May 23
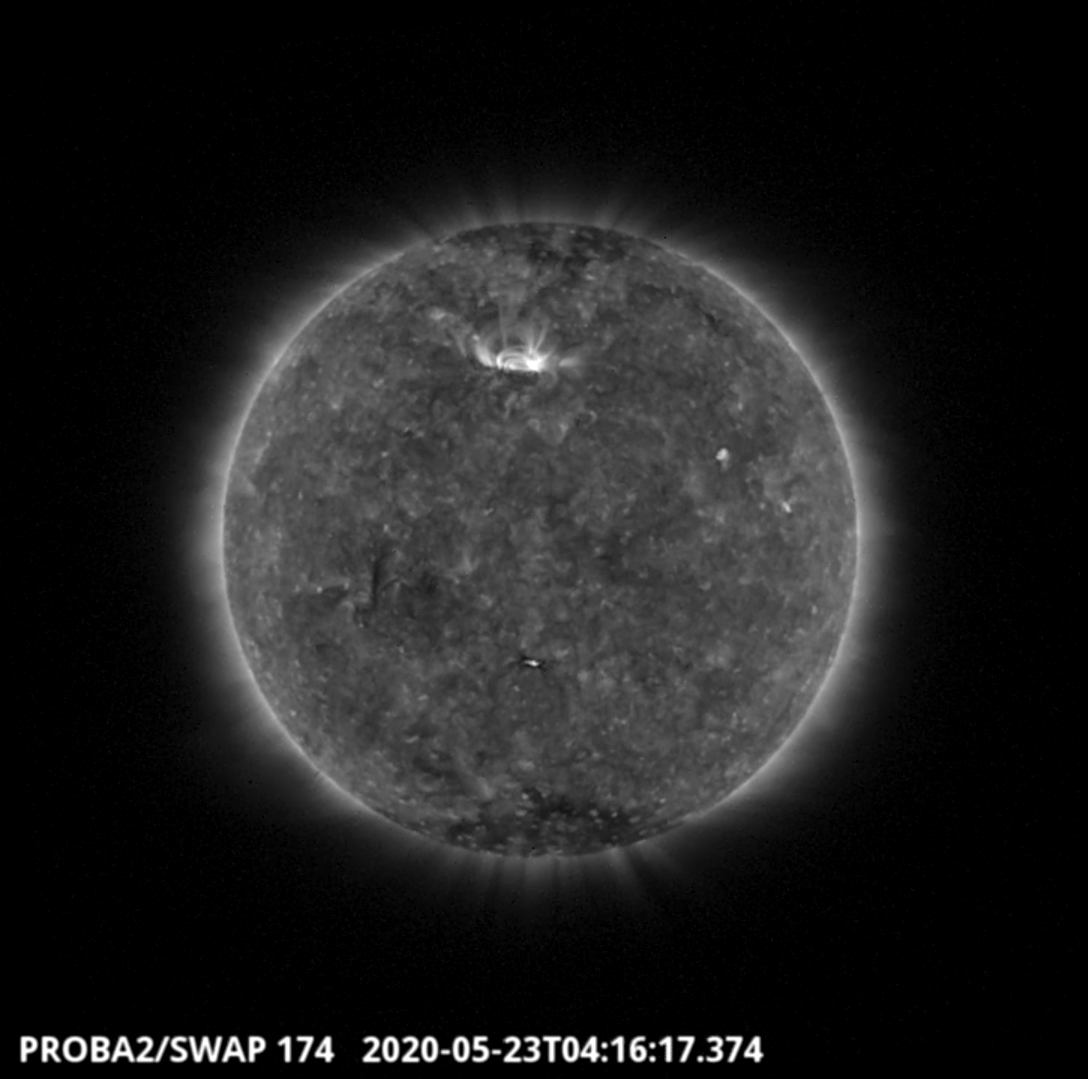
A small dimming and EUV wave were observed by SWAP on 2020-May-23 and are shown in the southern hemisphere at the central meridian in the SWAP image above taken at 04:16 UT.
Find a movie of the event here: https://proba2.oma.be/swap/movies/20200523_swap_movie.mp4 (SWAP movie) and here: https://proba2.sidc.be/swap/movies/20200523_swap_diff.mp4 (SWAP difference movie).
The International Sunspot Number by SILSO - new representation
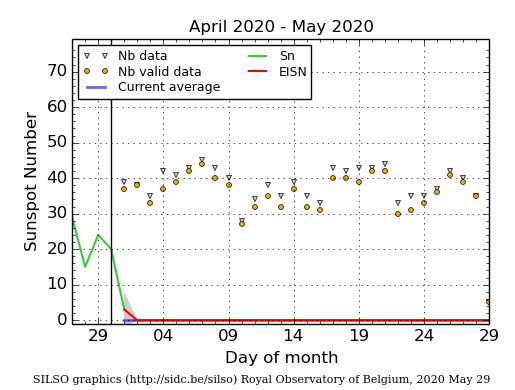
The daily Estimated International Sunspot Number (EISN, red curve with shaded error) derived by a simplified method from real-time data from the worldwide SILSO network. It extends the official Sunspot Number from the full processing of the preceding month (green line). The plot shows the last 30 days (about one solar rotation). The horizontal blue line shows the current monthly average. The yellow dots gives the number of stations that provided valid data. Valid data are used to calculate the EISN. The triangle gives the number of stations providing data. When a triangle and a yellow dot coincide, it means that all the data is used to calculate the EISN of that day.
Geomagnetic Observations at Dourbes (11 May 2020 - 17 May 2020)
Geomagnetic Observations at Dourbes (18 May 2020 - 24 May 2020)
The SIDC space weather Briefing
The Space Weather Briefing presented by the forecaster on duty from May 10 to 24. It reflects in images and graphs what is written in the Solar and Geomagnetic Activity report.
May 10-17
The pdf-version: http://www.stce.be/briefings/20200518_SWbriefing.pdf
The automatically running presentation: http://www.stce.be/briefings/20200518_SWbriefing.ppsm
May 18-24
The pdf-version: http://www.stce.be/briefings/20200525_SWbriefing.pdf
The automatically running presentation: http://www.stce.be/briefings/20200525_SWbriefing.ppsm
Review of ionospheric activity (11 May 2020 - 17 May 2020)
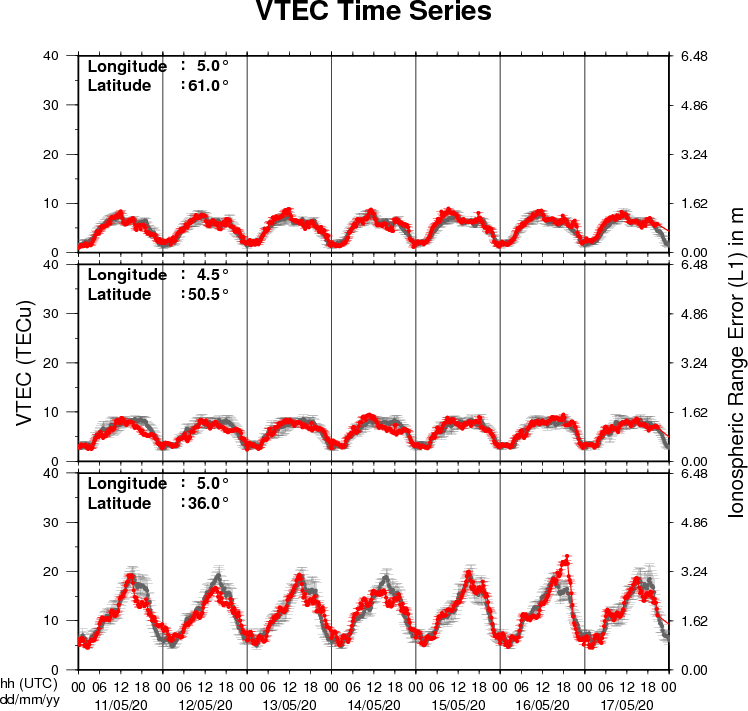
The figure shows the time evolution of the Vertical Total Electron Content (VTEC) (in red) during the last week at three locations:
a) in the northern part of Europe(N61°, 5°E)
b) above Brussels(N50.5°, 4.5°E)
c) in the southern part of Europe(N36°, 5°E)
This figure also shows (in grey) the normal ionospheric behaviour expected based on the median VTEC from the 15 previous days.
The VTEC is expressed in TECu (with TECu=10^16 electrons per square meter) and is directly related to the signal propagation delay due to the ionosphere (in figure: delay on GPS L1 frequency).
The Sun's radiation ionizes the Earth's upper atmosphere, the ionosphere, located from about 60km to 1000km above the Earth's surface.The ionization process in the ionosphere produces ions and free electrons. These electrons perturb the propagation of the GNSS (Global Navigation Satellite System) signals by inducing a so-called ionospheric delay.
See http://stce.be/newsletter/GNSS_final.pdf for some more explanations ; for detailed information, see http://gnss.be/ionosphere_tutorial.php
Review of ionospheric activity (18 May 2020 - 24 May 2020)
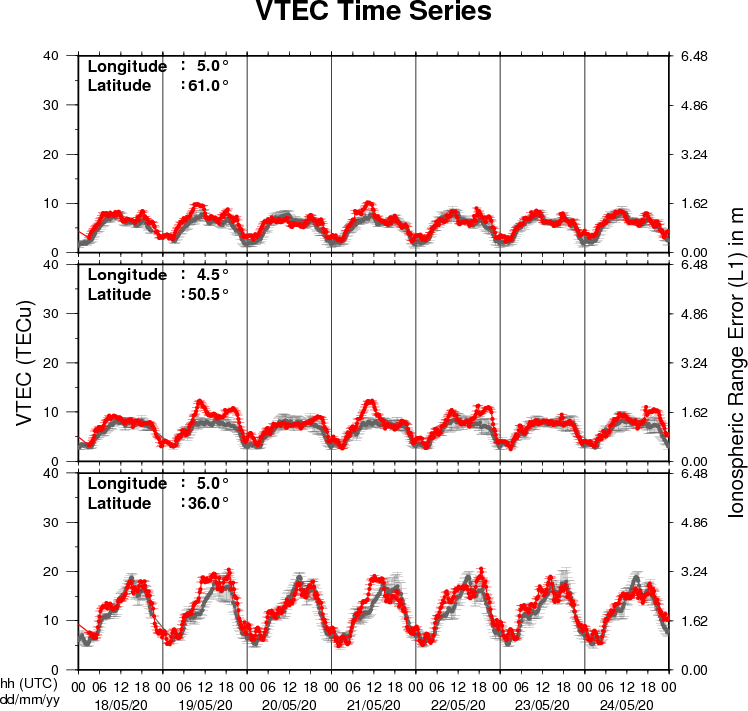
The figure shows the time evolution of the Vertical Total Electron Content (VTEC) (in red) during the last week at three locations:
a) in the northern part of Europe(N61°, 5°E)
b) above Brussels(N50.5°, 4.5°E)
c) in the southern part of Europe(N36°, 5°E)
This figure also shows (in grey) the normal ionospheric behaviour expected based on the median VTEC from the 15 previous days.
The VTEC is expressed in TECu (with TECu=10^16 electrons per square meter) and is directly related to the signal propagation delay due to the ionosphere (in figure: delay on GPS L1 frequency).
The Sun's radiation ionizes the Earth's upper atmosphere, the ionosphere, located from about 60km to 1000km above the Earth's surface.The ionization process in the ionosphere produces ions and free electrons. These electrons perturb the propagation of the GNSS (Global Navigation Satellite System) signals by inducing a so-called ionospheric delay.
See http://stce.be/newsletter/GNSS_final.pdf for some more explanations ; for detailed information, see http://gnss.be/ionosphere_tutorial.php