- Table of Content
- 1.Spotless, not ...
- 2.Review of sola...
- 3.The Internatio...
- 4.PROBA2 Observa...
- 5.Review of geom...
- 6.Geomagnetic Ob...
- 7.The SIDC Space...
- 8.Review of iono...
2. Review of solar activity
3. The International Sunspot Number by Silso
4. PROBA2 Observations (10 Aug 2020 - 16 Aug 2020)
5. Review of geomagnetic activity
6. Geomagnetic Observations at Dourbes (10 Aug 2020 - 16 Aug 2020)
7. The SIDC Space Weather Briefing
8. Review of ionospheric activity (10 Aug 2020 - 16 Aug 2020)
Spotless, not powerless
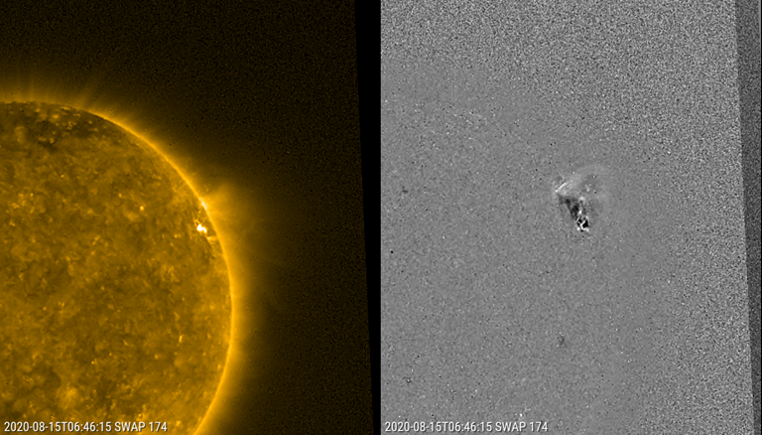
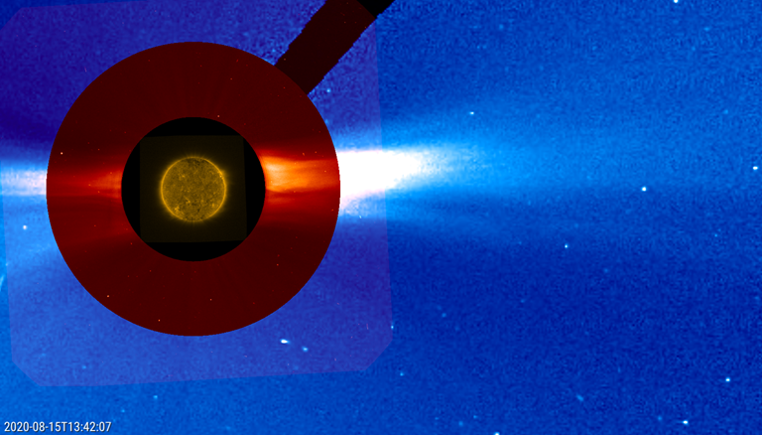
Active region NOAA 2770 turned into a spotless plage on 14 August, while it was already close to the northwest solar limb. The region was responsible for a C1 flare on 8 August (see last week's newsitem), but had been relatively quiet since as it was decaying. Then, early on 15 August, the region produced a C2 flare peaking at 06:47UT (GOES-16). The eruption was associated with a coronal mass ejection (CME) directed to the west and away from the Earth. The SDO spacecraft (https://sdo.gsfc.nasa.gov/ ) was eclipsed by the Earth's shadow, but fortunately the PROBA2 spacecraft was not (https://proba2.sidc.be ). The images underneath show the eruption in extreme ultraviolet (EUV) on the left, and on the right is a difference image (one image subtracted from the previous) to highlight faint changes. The subsequent combo picture consists of two coronagraphic images made by the SOHO spacecraft (https://soho.nascom.nasa.gov/ ) and overlaid onto the PROBA2/SWAP image. It shows the fairly narrow CME heading to the west. Movies can be found at http://www.stce.be/news/492/welcome.html
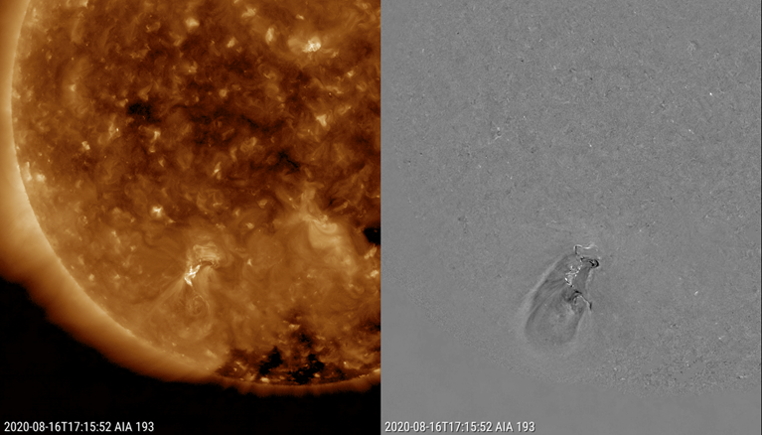
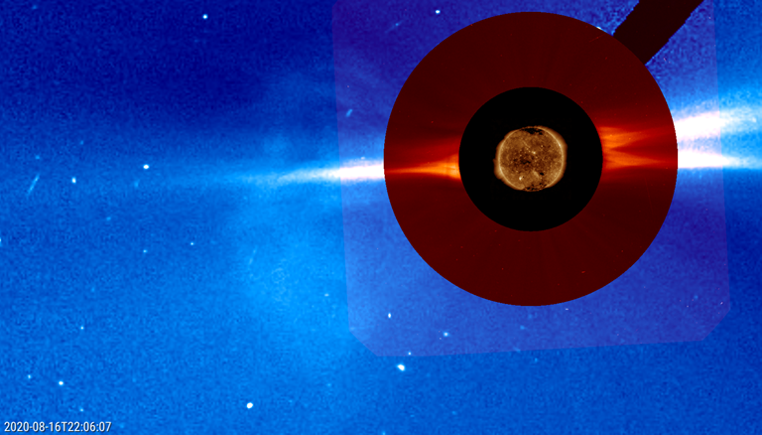
Then on 16 August, a B1 event (17:26UT) took place in a spotless region in the southeast solar quadrant. The region rotated onto the solar disk as a spotless faculae field, and -remaining spotless- did not receive a NOAA number. Though a B-class event is weaker than a C-class event, the EUV images showed some coronal dimming (alias "transient coronal hole") to the northwest (upper right) of the blast site, as well as a series of post-flare coronal loops which may have contributed to the somewhat atypical x-ray and EUV curves. Also a coronal wave (also known as EIT wave) can be seen emanating from "ground zero" as a somewhat whitish hue, which is better visible in the difference images. Both the coronal dimming, the post-flare coronal loops, and the coronal wave are strong indicators that the event was associated with a CME. And that was indeed the case, as confirmed by coronagraphic imagery from SOHO. This CME was significantly wider than the 15 August CME, and though the bulk of the CME is not directed to Earth, a weak earth-directed component cannot be excluded.
Review of solar activity
The Sun was quiet. A few sunspots were observed, but with very low flaring activity. The C2.0-class flare on August 15 at 06:47 UTC originated from the sunspots in NOAA Active Region 2770, which had then turned over the West limb.
No Coronal Mass Ejections (CME) with Earth-components were identified in the available coronagraphic imagery. The C2.0 flare was associated with a west-side CME and a coronal wave observed in PROBA2/SWAP images.
The greater than 10 MeV proton flux was at nominal levels. The greater than 2 MeV electron flux reached high levels at the beginning of the week but decreased at the end of the week fluctuating between nominal to moderate levels.
The International Sunspot Number by Silso
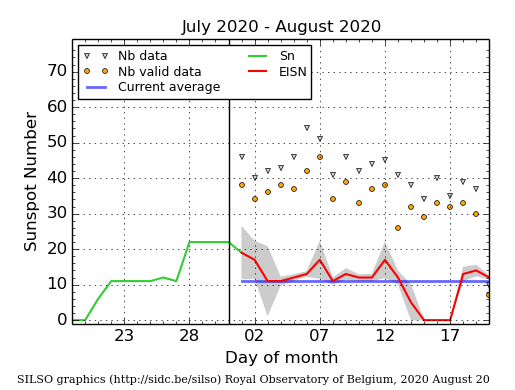
The daily Estimated International Sunspot Number (EISN, red curve with shaded error) derived by a simplified method from real-time data from the worldwide SILSO network. It extends the official Sunspot Number from the full processing of the preceding month (green line). The plot shows the last 30 days (about one solar rotation). The horizontal blue line shows the current monthly average. The yellow dots gives the number of stations that provided valid data. Valid data are used to calculate the EISN. The triangle gives the number of stations providing data. When a triangle and a yellow dot coincide, it means that all the data is used to calculate the EISN of that day.
PROBA2 Observations (10 Aug 2020 - 16 Aug 2020)
Solar Activity
Solar flare activity fluctuated between very low and low during the week.
In order to view the activity of this week in more detail, we suggest to go to the following website from which all the daily (normal and difference) movies can be accessed: https://proba2.oma.be/ssa
This page also lists the recorded flaring events.
A weekly overview movie can be found here (SWAP week 542).
http://proba2.oma.be/swap/data/mpg/movies/weekly_movies/weekly_movie_2020_08_10.mp4
Details about some of this week's events can be found further below.
If any of the linked movies are unavailable they can be found in the P2SC movie repository here https://proba2.oma.be/swap/data/mpg/movies/
Saturday 15 Aug
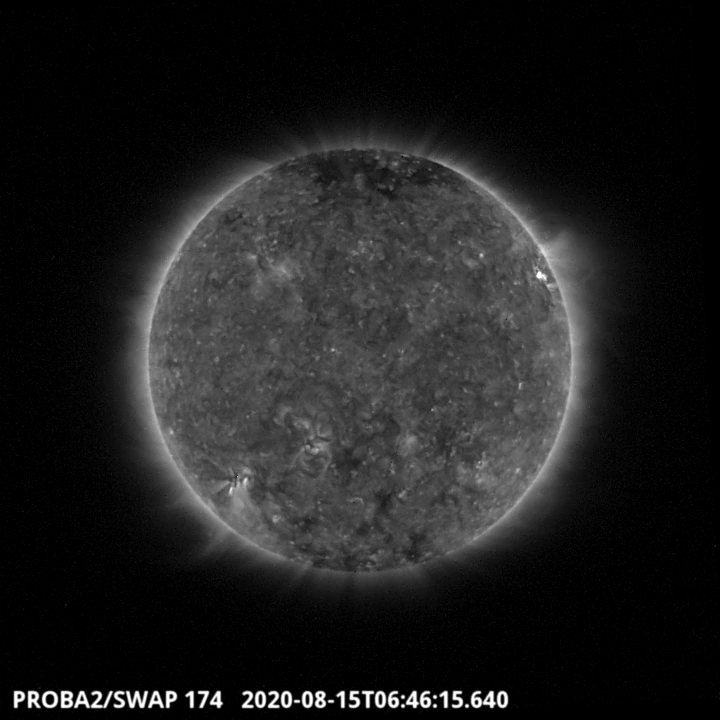
The active region which is visible on the North West limb of the SWAP image above is labelled NOAA2770. It has erupted around 6:46 UT in a C2.0 class flare, this is the largest flare of the week. Find a movie of the events here (SWAP movie) http://proba2.oma.be/swap/data/mpg/movies/20200815_swap_movie.mp4
Sunday 16 Aug
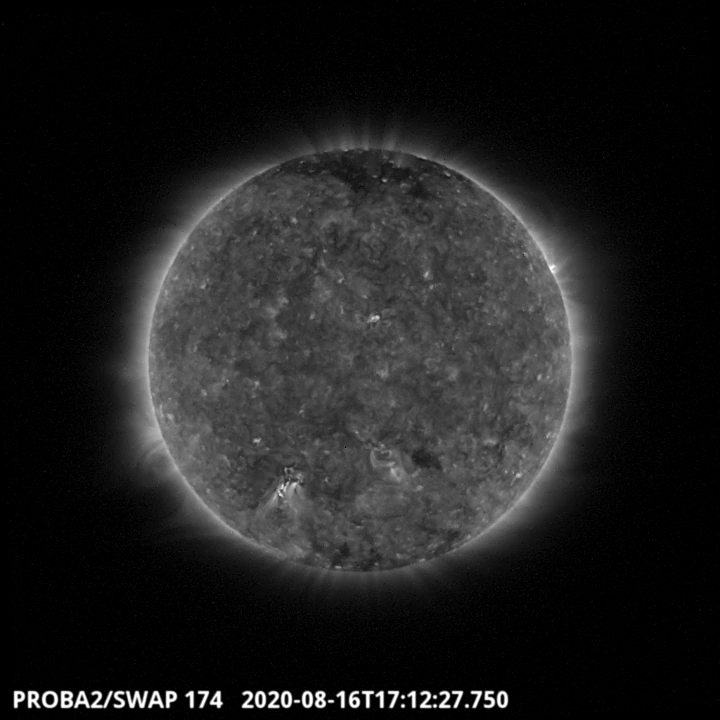
The southern East active region has produced a B1.2 two-ribbon flare
around 17:12 UT, which was associated with a filament
eruption and accompanied by a CME. Find a movie of the events here (SWAP movie) http://proba2.oma.be/swap/data/mpg/movies/20200816_swap_movie.mp4
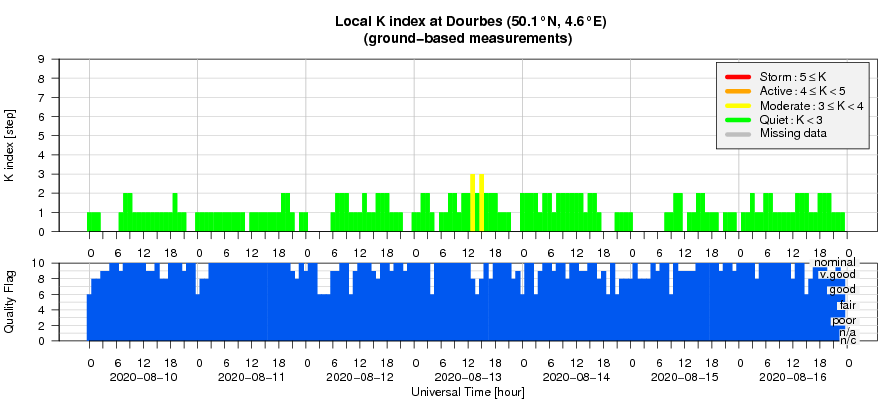
Review of geomagnetic activity
The Earth was under the influence of a slow solar wind with mostly nominal solar wind parameters (measured by DSCVR): speed was below 400 km/s, the total interplanetary magnetic field was slightly enhanced and reached values around 8.7 nT at the end of the week. The small departures from low levels was probably due to wind steams coming from the polar coronal holes. The Bz magnetic field components fluctuated between -6.2 nT and +7.6 nT.
Geomagnetic conditions were quiet.
Geomagnetic Observations at Dourbes (10 Aug 2020 - 16 Aug 2020)
The SIDC Space Weather Briefing
The Space Weather Briefing presented by the forecaster on duty from August 9 to 16. It reflects in images and graphs what is written in the Solar and Geomagnetic Activity report.
The pdf-version: http://www.stce.be/briefings/20200817_SWbriefing.pdf
The automatically running presentation: http://www.stce.be/briefings/20200817_SWbriefing.ppsm
Review of ionospheric activity (10 Aug 2020 - 16 Aug 2020)
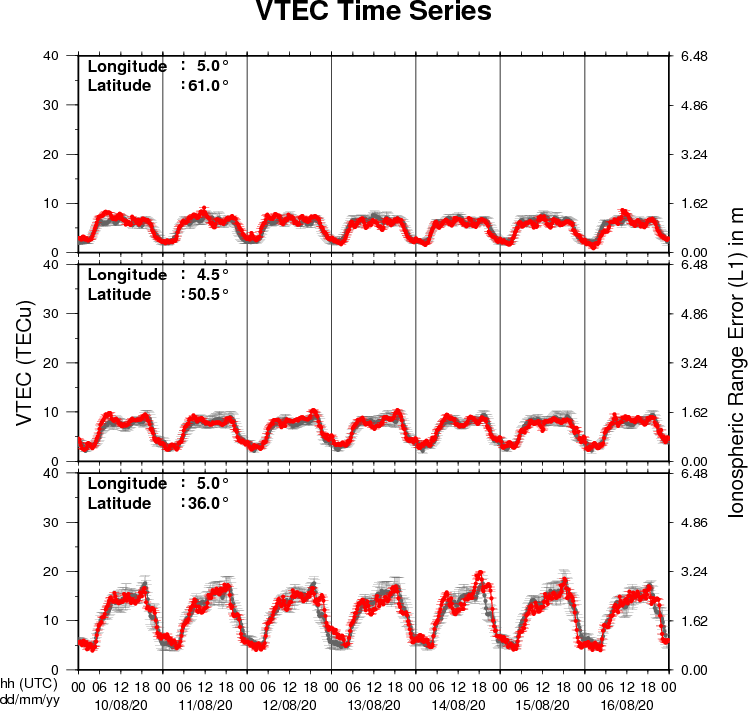
The figure shows the time evolution of the Vertical Total Electron Content (VTEC) (in red) during the last week at three locations:
a) in the northern part of Europe(N61°, 5°E)
b) above Brussels(N50.5°, 4.5°E)
c) in the southern part of Europe(N36°, 5°E)
This figure also shows (in grey) the normal ionospheric behaviour expected based on the median VTEC from the 15 previous days.
The VTEC is expressed in TECu (with TECu=10^16 electrons per square meter) and is directly related to the signal propagation delay due to the ionosphere (in figure: delay on GPS L1 frequency).
The Sun's radiation ionizes the Earth's upper atmosphere, the ionosphere, located from about 60km to 1000km above the Earth's surface.The ionization process in the ionosphere produces ions and free electrons. These electrons perturb the propagation of the GNSS (Global Navigation Satellite System) signals by inducing a so-called ionospheric delay.
See http://stce.be/newsletter/GNSS_final.pdf for some more explanations ; for detailed information, see http://gnss.be/ionosphere_tutorial.php