- Table of Content
- 1.December 2019 ...
- 2.Review of sola...
- 3.PROBA2 Observa...
- 4.The Internatio...
- 5.Review of geom...
- 6.Geomagnetic Ob...
- 7.The SIDC Space...
- 8.Review of iono...
2. Review of solar activity
3. PROBA2 Observations (7 Sep 2020 - 13 Sep 2020)
4. The International Sunspot Number by Silso
5. Review of geomagnetic activity
6. Geomagnetic Observations at Dourbes (7 Sep 2020 - 13 Sep 2020)
7. The SIDC Space Weather Briefing
8. Review of ionospheric activity (7 Sep 2020 - 13 Sep 2020)
December 2019 officially marks the start of the new solar cycle
Sunspot counts done worldwide are collected on a daily basis by SILSO World Data Center since 1981. These observations are used to calculate the international index for solar activity: the sunspot number. These series of numbers form the key data for the International Solar Cycle 25 Prediction Panel, supported by NASA and NOAA and in which SILSO is participating.
Frederic Clette, head of SILSO: “We track the long-term evolution of the sunspots and the extrema of all cycles. This is one of the busiest times, with a burst of requests from all kinds of users: solar physicists, of course, but also geophysicists, space engineers, radio amateurs, and also curious citizens from all over the world. When a cycle reaches the minimum, everybody wants to know exactly when the maximum and minimum of the next solar cycle will occur.”

This is a sunspot drawing made on 29 April, 2020 with the solar telescope at Uccle, Belgium. The sunspot group ‘A3’ belongs to the new solar cycle, while ‘A2’ belongs to the old one.
Frederic Clette: “We keep a detailed record of the few tiny spots that mark the onset and rise of the new cycle. These are the diminutive heralds of future giant solar fireworks. Of course, the Sun has its own pace that we cannot speed up. But, we can try to predict when the Sun is truly waking up again!”
To keep you busy
A very nice movie with Olivier Lemaitre, an STCE solar observer, in it: https://www.youtube.com/watch?v=rx9m6H6GeLs
News item on CNN: https://edition.cnn.com/2020/09/15/world/solar-cycle-25-nasa-noaa-scn-trnd/index.html
On the national news: https://www.vrt.be/vrtnws/nl/2020/09/16/de-zon-is-aan-een-nieuwe-cyclus-begonnen-en-dat-weten-we-dankzi/
More about the role of SILSO and the link to the NASA press release on http://sidc.be/silso/
Review of solar activity
Solar activity was at very low levels.
The Sun was spotless for the entire week. The daily 10.7cm solar radio flux ranged between 68.7 and 70.2 sfu.
No earth-directed coronal mass ejections (CMEs) were observed. CME activity from the Sun's west limb was observed late on 7 and on 8 September, most likely related to activity just behind the west limb (no obvious on-disk source).
A narrow extension from the negative polarity southern polar coronal hole (CH) transited the central meridian on 10 September. A small and diffuse negative polarity equatorial CH was near disk center on 13-14 September.
The greater than 10 MeV proton flux was at nominal values.
PROBA2 Observations (7 Sep 2020 - 13 Sep 2020)
Solar Activity
Solar flare activity was very low during the week.
In order to view the activity of this week in more detail, we suggest to go to the following website from which all the daily (normal and difference) movies can be accessed: https://proba2.oma.be/ssa
This page also lists the recorded flaring events.
A weekly overview movie can be found here (SWAP week 546): https://proba2.sidc.be/swap/data/mpg/movies/weekly_movies/weekly_movie_2020_09_07.mp4
Details about some of this week's events can be found further below.
If any of the linked movies are unavailable they can be found in the P2SC movie repository here: https://proba2.oma.be/swap/data/mpg/movies/
Tuesday Sep 08
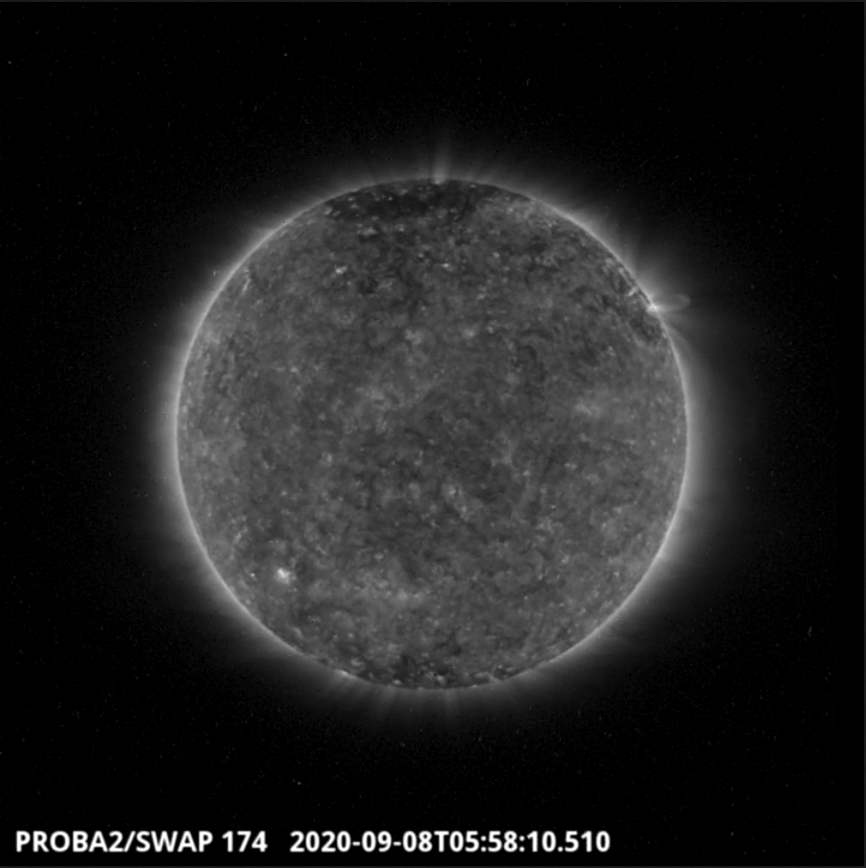
No Active Regions (ARs) were observed for the entire week, although a short-lived bright loop structure was observed on the north-west limb of the Sun on 2020-Sep-08, as shown in the SWAP image above.
Find a movie of the day here (SWAP movie): https://proba2.sidc.be/swap/movies/20200908_swap_movie.mp4
The International Sunspot Number by Silso
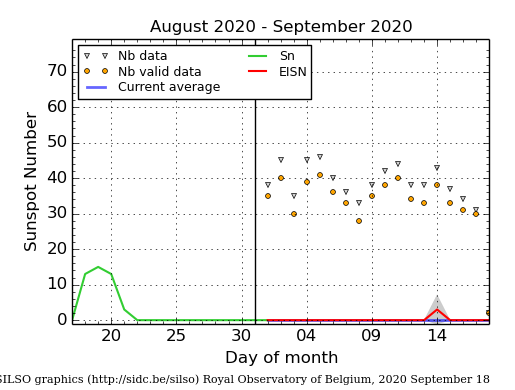
The daily Estimated International Sunspot Number (EISN, red curve with shaded error) derived by a simplified method from real-time data from the worldwide SILSO network. It extends the official Sunspot Number from the full processing of the preceding month (green line). The plot shows the last 30 days (about one solar rotation). The horizontal blue line shows the current monthly average. The yellow dots gives the number of stations that provided valid data. Valid data are used to calculate the EISN. The triangle gives the number of stations providing data. When a triangle and a yellow dot coincide, it means that all the data is used to calculate the EISN of that day.
Review of geomagnetic activity
Solar wind parameters were at nominal levels.
Solar wind speed decreased from values near 400 km/s to a minimum near 270 km/s on 10 September, then varying between mostly 300-350 km/s. Bz varied between -5 and +6 nT.
Two sector boundary crossings were observed, resp. on 8 and on 11 September. The direction of the interplanetary magnetic field was in a predominantly positive sector (away from the Sun) until 8 September, then switched to a negative sector until 11 September, when it switched back to a positive sector.
A small disturbance arrived just before the end of the period, driving Bz to -8 nT, and resulting in mostly unsettled intervals.
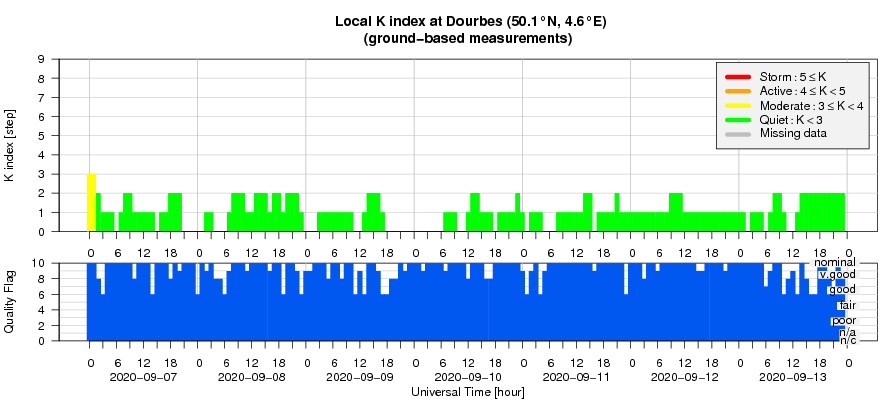
Geomagnetic activity was at mostly quiet levels, with isolated unsettled intervals recorded in both Kp and K Dourbes.
The greater than 2 MeV electron flux ranged from high (10.200 pfu on 7 September) to moderate levels, its daily maximum exceeding the 1000 pfu alert threshold every day of the week.
Geomagnetic Observations at Dourbes (7 Sep 2020 - 13 Sep 2020)
The SIDC Space Weather Briefing
The Space Weather Briefing presented by the forecaster on duty from Sept 6 to 14. It reflects in images and graphs what is written in the Solar and Geomagnetic Activity report.

A pdf-version: http://www.stce.be/briefings/20200914_SWbriefing.pdf
The movie: http://www.stce.be/briefings/20200914_SWbriefing.m4v
Review of ionospheric activity (7 Sep 2020 - 13 Sep 2020)
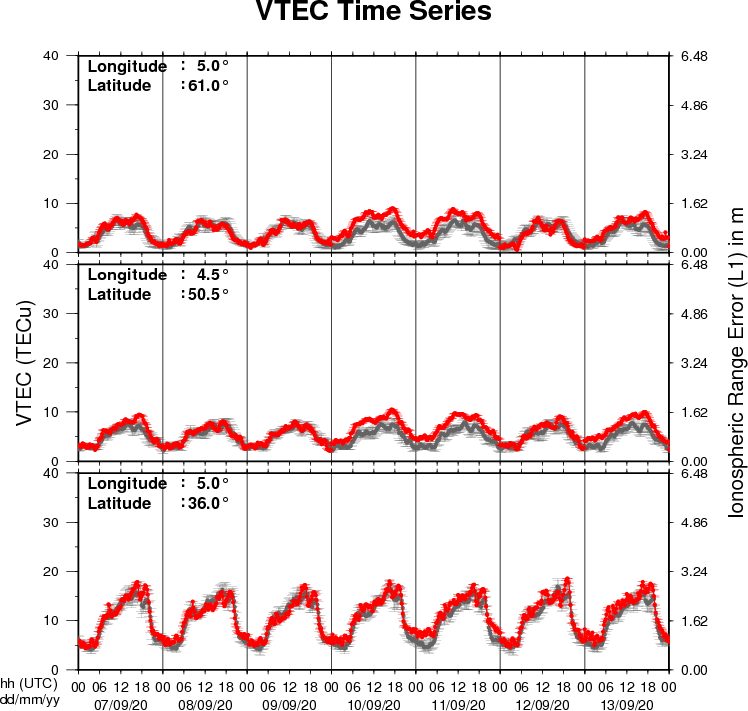
The figure shows the time evolution of the Vertical Total Electron Content (VTEC) (in red) during the last week at three locations:
a) in the northern part of Europe(N61°, 5°E)
b) above Brussels(N50.5°, 4.5°E)
c) in the southern part of Europe(N36°, 5°E)
This figure also shows (in grey) the normal ionospheric behaviour expected based on the median VTEC from the 15 previous days.
The VTEC is expressed in TECu (with TECu=10^16 electrons per square meter) and is directly related to the signal propagation delay due to the ionosphere (in figure: delay on GPS L1 frequency).
The Sun's radiation ionizes the Earth's upper atmosphere, the ionosphere, located from about 60km to 1000km above the Earth's surface.The ionization process in the ionosphere produces ions and free electrons. These electrons perturb the propagation of the GNSS (Global Navigation Satellite System) signals by inducing a so-called ionospheric delay.
See http://stce.be/newsletter/GNSS_final.pdf for some more explanations ; for detailed information, see http://gnss.be/ionosphere_tutorial.php