- Table of Content
- 1.Big brother
- 2.A risky job, t...
- 3.Review of sola...
- 4.The Internatio...
- 5.PROBA2 Observa...
- 6.Review of geom...
- 7.Geomagnetic Ob...
- 8.The SIDC Space...
- 9.Review of iono...
2. A risky job, there out in space - also for LYRA
3. Review of solar activity
4. The International Sunspot Number by Silso
5. PROBA2 Observations (16 Nov 2020 - 22 Nov 2020)
6. Review of geomagnetic activity
7. Geomagnetic Observations at Dourbes (16 Nov 2020 - 22 Nov 2020)
8. The SIDC Space Weather Briefing
9. Review of ionospheric activity (16 Nov 2020 - 22 Nov 2020)
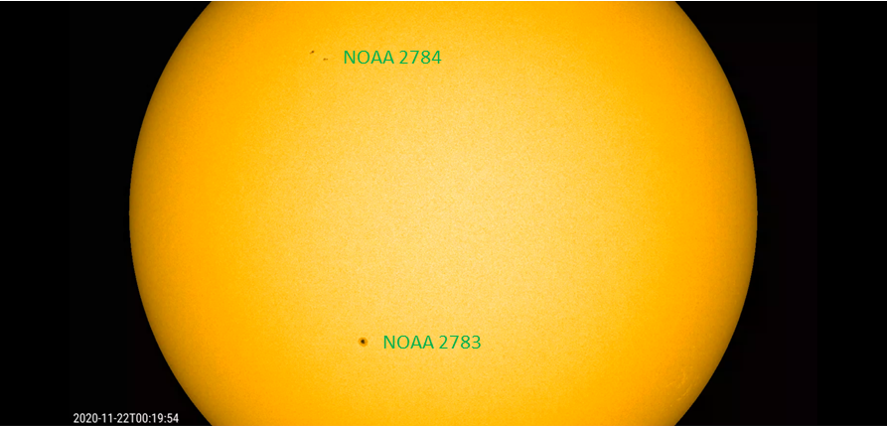
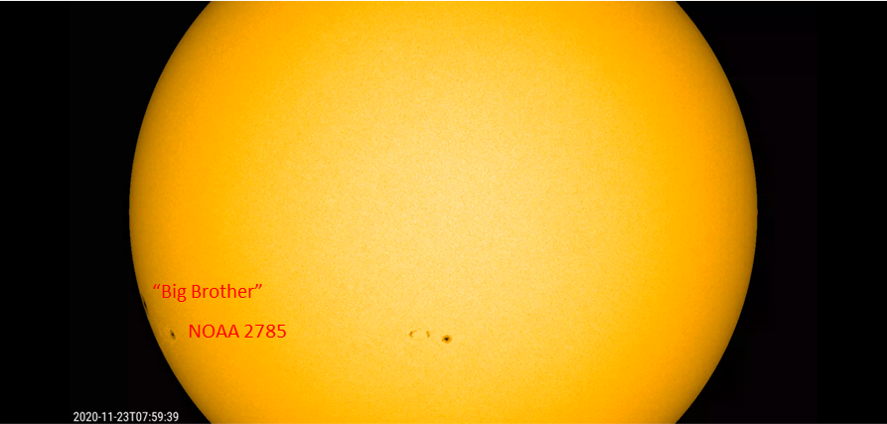
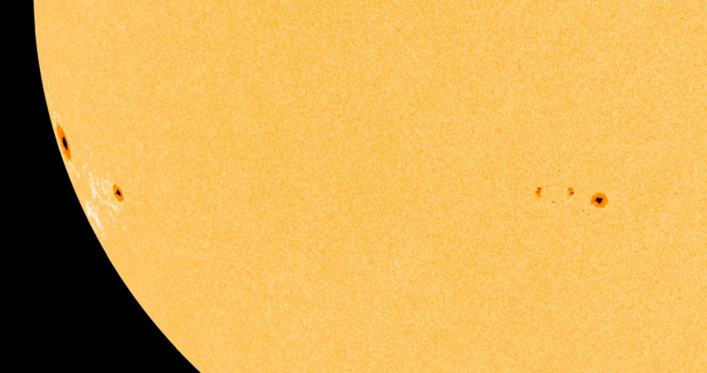
Big brother
The imagery underneath covers the period from 22 November until 23 November at noon and shows the Sun in white light (SDO/HMI - https://sdo.gsfc.nasa.gov/data/aiahmi/ ). It shows a sunspot region (NOAA 2784) decaying in the northern solar hemisphere, another region developing in the trailing portion of NOAA 2783 in the southern hemisphere, and two sunspot regions rotating over the southeast solar limb (lower left). The first one starts appearing early on 22 November and was numbered NOAA 2785, whereas its big brother starts becoming visible early on 23 November and still needs to receive a number. In particular this latter group is impressive, while it still has not fully rotated over the solar limb yet. It currently consists of a big single sunspot which has a diameter of 3 degrees, corresponding to nearly the circumference of the Earth. Movieclips are available at http://www.stce.be/news/504/welcome.html
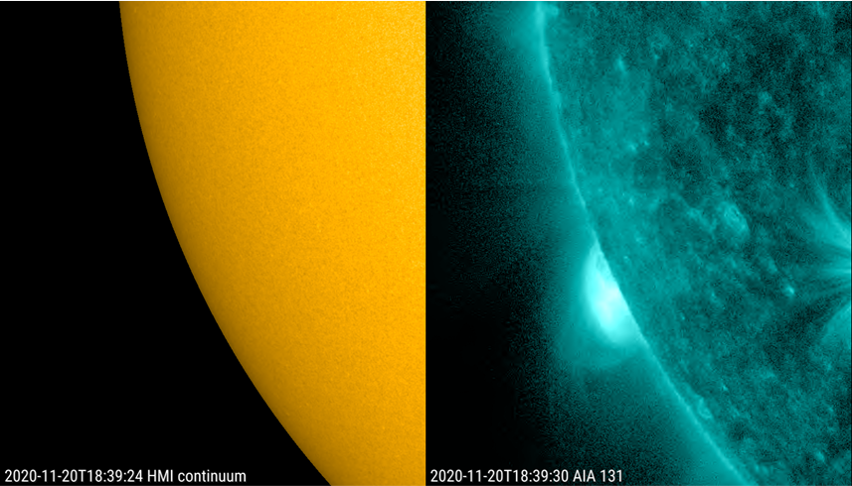
Space weather forecasters were alerted well ahead. Indeed, during the last few days, they saw a substantial increase in the number of coronal mass ejections (CMEs) emanating from behind the southeast limb (see http://sidc.oma.be/cactus/catalog.php ). Moreover, flaring activity was observed from sources beyond the southeast limb as early as 20 November, with the source regions still 1-2 days before rounding the solar limb. See the white light and Extreme Ultraviolet (EUV) images from the Solar Dynamics Observatory underneath.
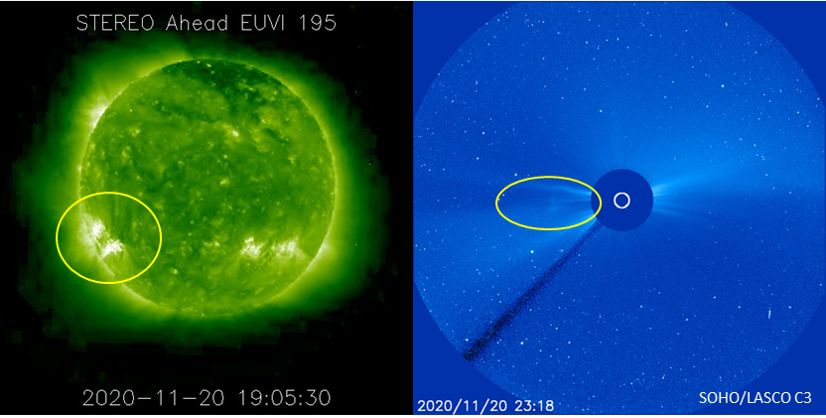
The final clues were given by the STEREO-A spacecraft (https://stereo-ssc.nascom.nasa.gov/ ), which currently trails the Earth by 58 degrees and so had a good view on a part of the solar farside. EUV images clearly showed two bright and flaring active regions in the southern hemisphere. The coronagraphic image on the right (SOHO/LASCO - https://sohowww.nascom.nasa.gov/ ) shows the (weak) CME associated with the 20 November flaring from the two regions.
Both sunspot groups currently seem to have a simple magnetic configuration, and they also seem to be a bit less flare-active compared to the previous days. Nonetheless, with such a big spot flaring activity may pick up relatively fast. As days go by and the sunspot groups approach the central meridian, any associated CME may become earth-directed.
A risky job, there out in space - also for LYRA
Seminar - Degradation of the LYRA telescopes onboard PROBA2
Marie Dominique is the LYRA-keeper at the STCE. She keeps an eye on the telescope and especially how it ages because of the hostile space environment. PROBA2, the satellite with LYRA onboard, orbits Earth at a height of around 750 km. So, it is protected by the Earth magnetic field but still, it has to pass through places with particles bombarding the spacecraft and the telescope. On top of this, part of the solar light imposes extra stress on the telescope.
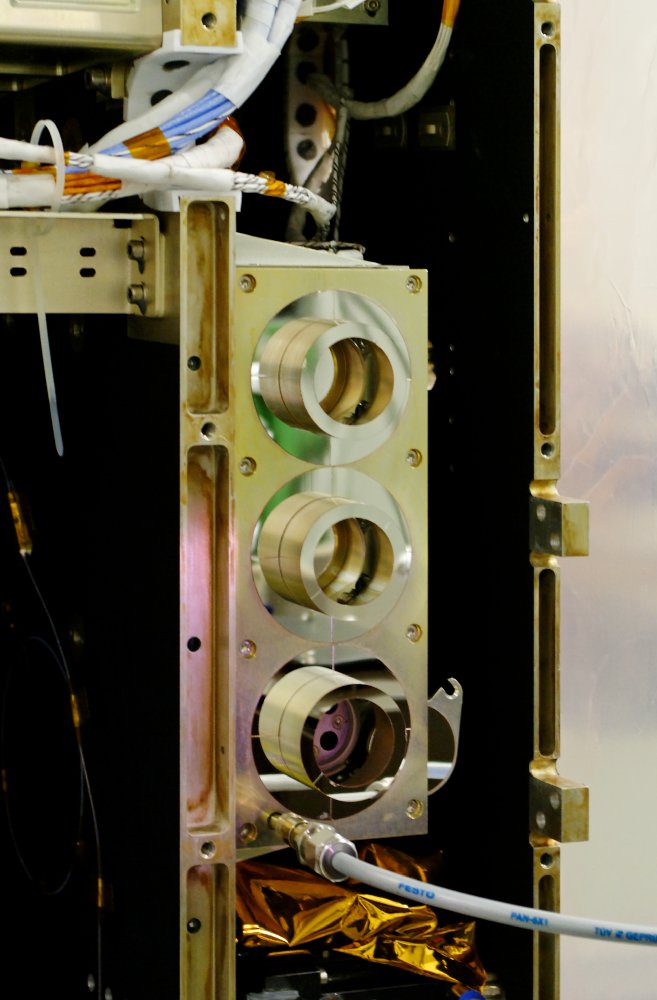
May I present to you, Large Yield Radiometer, LYRA for friends.
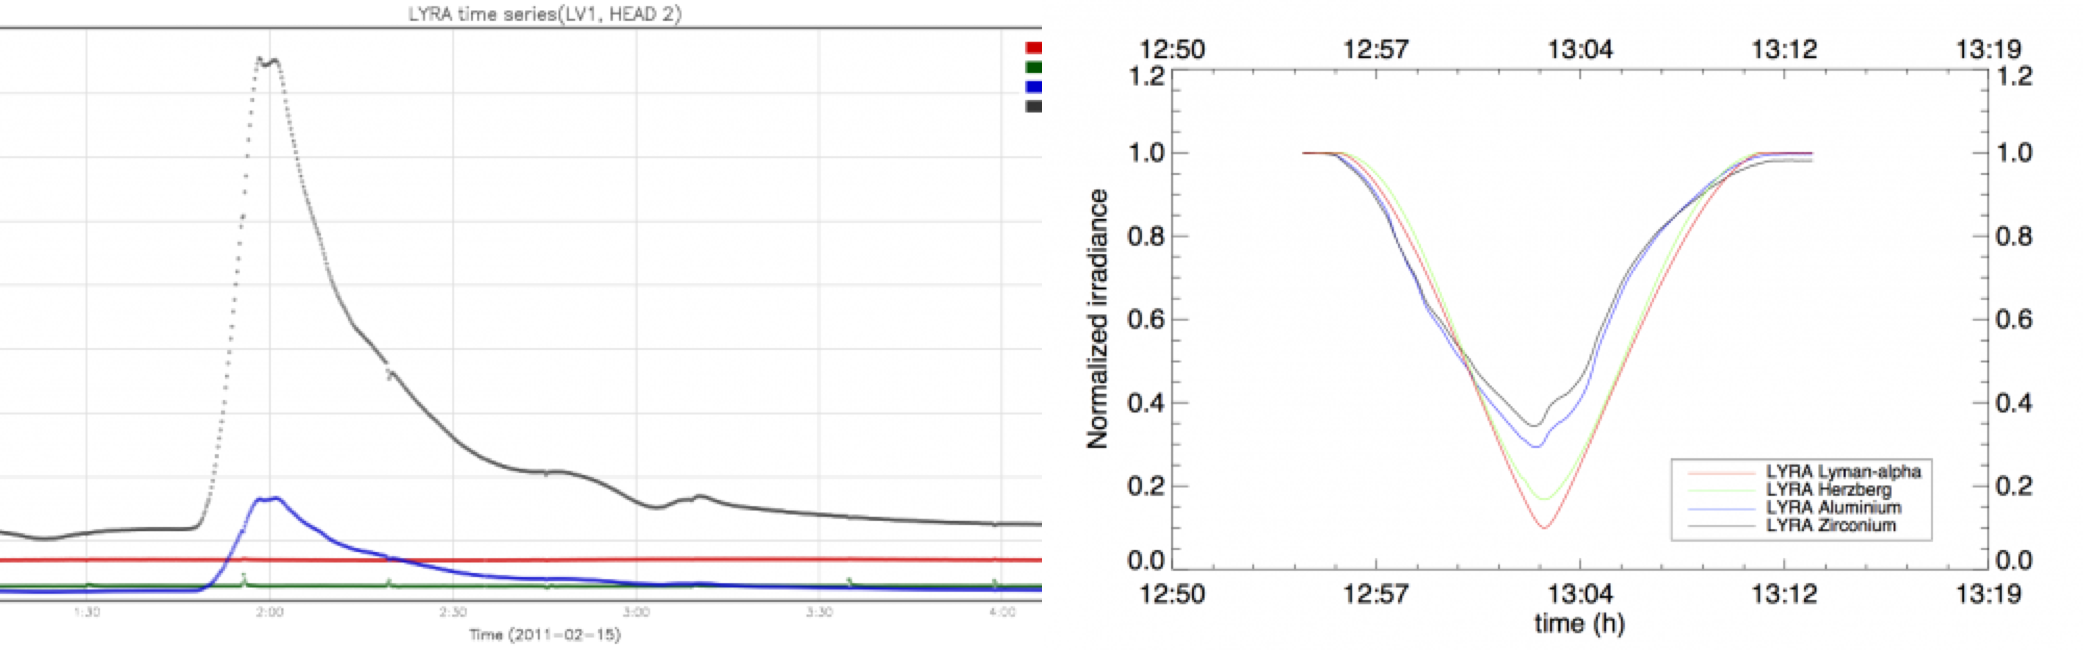
This graph is from the hand of LYRA: observing a solar flare (left), observing a solar eclipse (right). LYRA can do it all.
For the abstract and more: http://www.stce.be/seminar_LYRA
The seminar is planned on Wednesday December 2, 14:30, in our digital-room.
Review of solar activity
Solar activity was at low levels over the past week with 23-B class and 5 C-class flares recorded.
In the beginning of the week the solar disk was spotless with 1 plage region, previously NOAA 2872.
By Nov 17th a new active region (NOAA 2783 alpha) rotated from behind the east limb. It remained quiet and stable throughout Nov 19th. On Nov 20th NOAA 2783 produced a C1.9 class flare (peak at 17:03UTC).
Another C1 class flare was measured at 18:44 UTC. The source was an active region hidden behind the east limb. On Nov 21st a new active region appeared on the solar disk and got the number NOAA 2874. This beta-region remained quiet until the end of the week.
On Nov 22nd the active region NOAA 2875 (alpha), the source of the C1.9 flare and previously hidden behind the east limb, appeared on the solar disk and produced two C1.3 flares (peaks at 09:27 UTC and 14:32 UTC), as well as a C3.3 class flare (peak at 17:31 UTC).
No Earth-directed CMEs were identified in the available coronagraph imagery. Nevertheless multiple CMEs were ejected from the east limb on Nov 18th, Nov 19th, Nov 20th and Nov 21st.
A filament eruption from the north-east part of the solar disk resulted in a fast east-ward CME estimated to have no Earth-directed component. A couple minor CMEs were detected from the west limb.
The greater than 10 MeV proton flux remained at background levels.
The greater than 2 MeV electron flux was below the 1000 pfu alert threshold until the afternoon on Nov 22nd when it increased and reached the 1000 pfu threshold under the influence a the high speed stream solar wind.
The International Sunspot Number by Silso
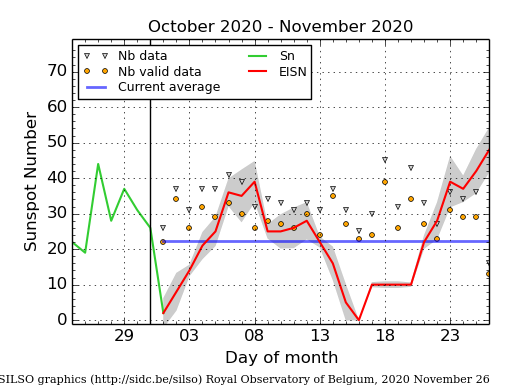
The daily Estimated International Sunspot Number (EISN, red curve with shaded error) derived by a simplified method from real-time data from the worldwide SILSO network. It extends the official Sunspot Number from the full processing of the preceding month (green line). The plot shows the last 30 days (about one solar rotation). The horizontal blue line shows the current monthly average. The yellow dots gives the number of stations that provided valid data. Valid data are used to calculate the EISN. The triangle gives the number of stations providing data. When a triangle and a yellow dot coincide, it means that all the data is used to calculate the EISN of that day.
PROBA2 Observations (16 Nov 2020 - 22 Nov 2020)
Solar Activity
Solar flare activity fluctuated between very low and low during the week.
In order to view the activity of this week in more detail, we suggest to go to the following website from which all the daily (normal and difference) movies can be accessed: https://proba2.oma.be/ssa
This page also lists the recorded flaring events.
A weekly overview movie can be found here (SWAP week 556). http://proba2.oma.be/swap/data/mpg/movies/weekly_movies/weekly_movie_2020_11_16.mp4
Details about some of this week's events can be found further below.
If any of the linked movies are unavailable they can be found in the P2SC movie repository here
https://proba2.oma.be/swap/data/mpg/movies/
Friday Nov 20
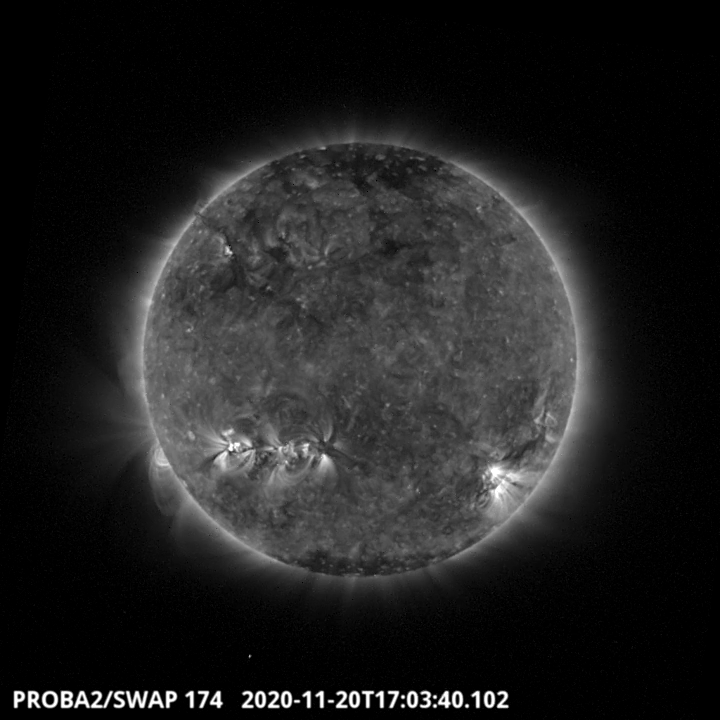
An eruption associated with a C1.9 flare was observed by SWAP on the south east part of the solar disk around 17:03 UT, as shown in the SWAP image above. Find a movie of the event here (SWAP movie) http://proba2.oma.be/swap/data/mpg/movies/20201120_swap_movie.mp4
Sunday Nov 22
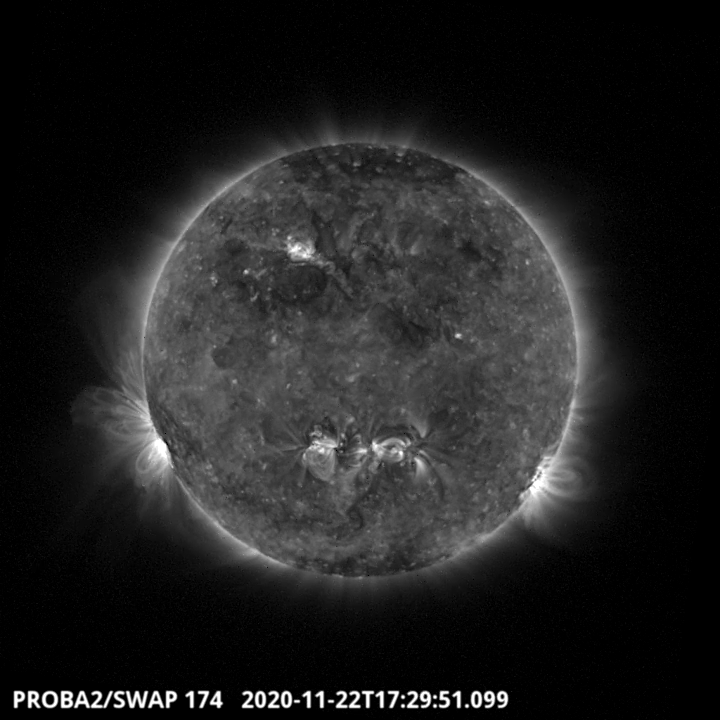
An eruption associated with a C3.3 flare was observed by SWAP on the south-eastern limb of the Sun around 17:30 as shown in the SWAP image above. Find a movie of the event here (SWAP movie) http://proba2.oma.be/swap/data/mpg/movies/20201122_swap_movie.mp4
Review of geomagnetic activity
The solar wind parameters measured by DSCOVR and ACE were at very low levels at the beginning of the week. The solar wind speed was fluctuating around 300 km/s.
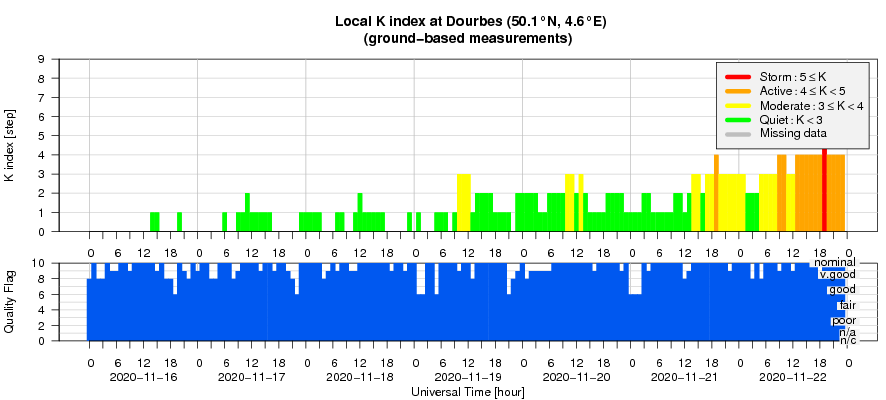
During the first part of Nov 19th, a solar wind disturbance was detected, possibly due to the arrival of a weak CME or the influence of an enhanced solar wind stream originating from a patchy extension of the northern polar coronal hole facing the Earth since Nov 17th. This caused an increase in the solar wind speed to about 400 km/s and short periods of geomagnetically unsettled conditions in the morning of Nov 20th.
The solar conditions then remained quiet until the afternoon of Nov 21st when a high speed stream from another low-latitude extension of the northern polar coronal hole reached the Earth. This caused unsettled to active geomagnetic conditions as the solar wind speed increased towards 500 km/s with prolonged periods of negative Bz reaching down to -10 nT. Active conditions prevailed on Nov 22nd and a minor geomagnetic storm was registered in the afternoon as the solar wind speed reached 650 km/s.
Geomagnetic Observations at Dourbes (16 Nov 2020 - 22 Nov 2020)
The SIDC Space Weather Briefing
The Space Weather Briefing presented by the forecaster on duty from November 15 to 22. It reflects in images and graphs what is written in the Solar and Geomagnetic Activity report.

A pdf-version: http://www.stce.be/briefings/20201123_SWbriefing.pdf
The movie: http://www.stce.be/briefings/20201123_SWbriefing.m4v
Review of ionospheric activity (16 Nov 2020 - 22 Nov 2020)
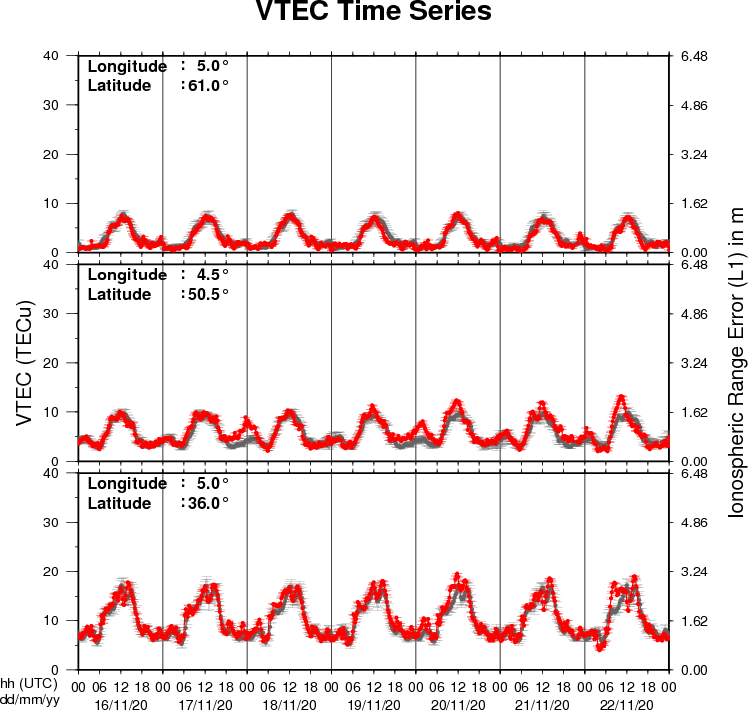
The figure shows the time evolution of the Vertical Total Electron Content (VTEC) (in red) during the last week at three locations:
a) in the northern part of Europe(N61°, 5°E)
b) above Brussels(N50.5°, 4.5°E)
c) in the southern part of Europe(N36°, 5°E)
This figure also shows (in grey) the normal ionospheric behaviour expected based on the median VTEC from the 15 previous days.
The VTEC is expressed in TECu (with TECu=10^16 electrons per square meter) and is directly related to the signal propagation delay due to the ionosphere (in figure: delay on GPS L1 frequency).
The Sun's radiation ionizes the Earth's upper atmosphere, the ionosphere, located from about 60km to 1000km above the Earth's surface.The ionization process in the ionosphere produces ions and free electrons. These electrons perturb the propagation of the GNSS (Global Navigation Satellite System) signals by inducing a so-called ionospheric delay.
See http://stce.be/newsletter/GNSS_final.pdf for some more explanations ; for detailed information, see http://gnss.be/ionosphere_tutorial.php