- Table of Content
- 1.December 14 wa...
- 2.Review of sola...
- 3.Another solar ...
- 4.The SILSO Inte...
- 5.PROBA2 Observa...
- 6.Geomagnetic Ob...
- 7.The SIDC Space...
- 8.Review of iono...
2. Review of solar and geomagnetic activity
3. Another solar radio burst
4. The SILSO International Sunspot Number
5. PROBA2 Observations (14 Dec 2020 - 20 Dec 2020)
6. Geomagnetic Observations at Dourbes (14 Dec 2020 - 20 Dec 2020)
7. The SIDC Space Weather Briefing
8. Review of ionospheric activity (14 Dec 2020 - 20 Dec 2020)
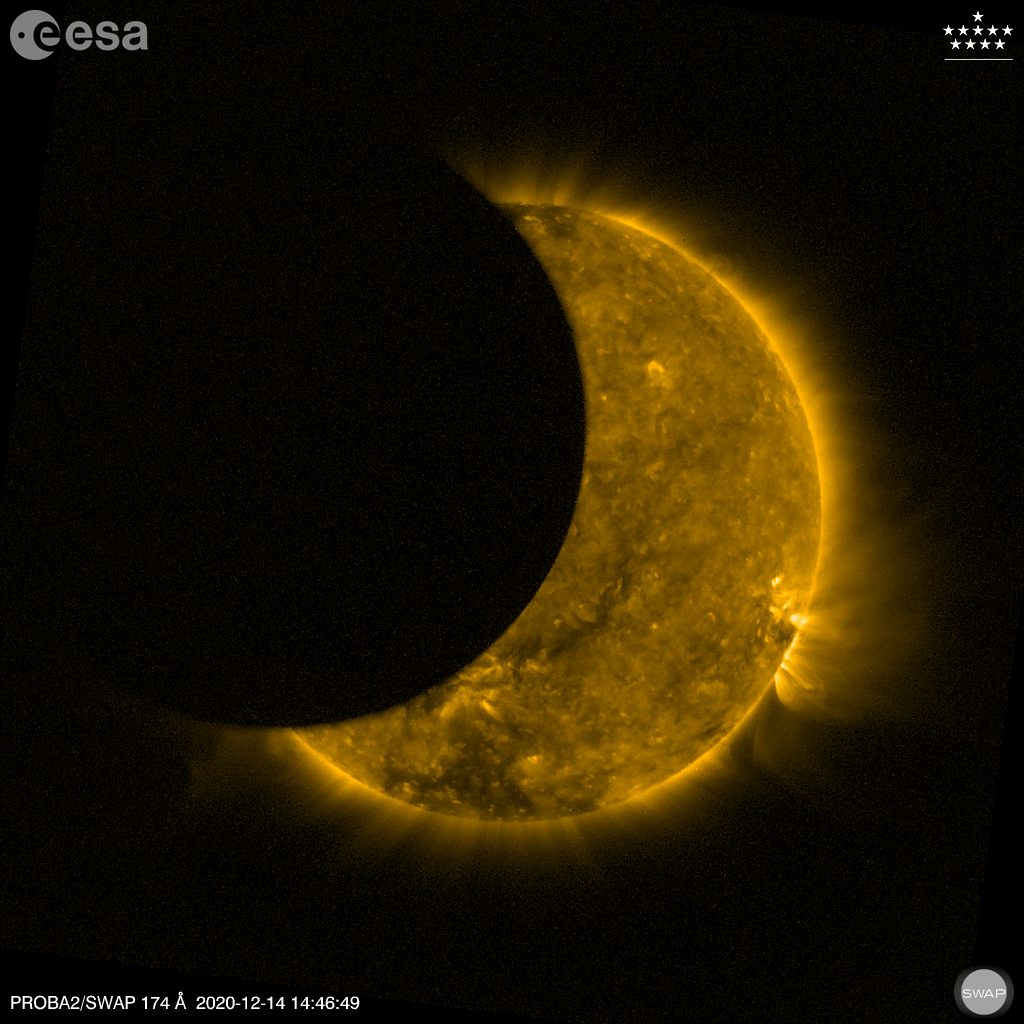
December 14 was eclipse time!
The last eclipse of 2020 took place on December 14. PROBA2 witnessed it since it sits on the first row and has the sun almost always in view.
PROBA2 was launched more then 10 years ago, on November 2 2009. It is a technological and scientific space-lab where news things were tested for the first time in real space conditions.
Our attention goes to 2 scientific instruments: the telescope SWAP that makes pictures of the sun in the extreme ultraviolet light and the radiometer LYRA that measures solar radiation in 4 wavelengths.
Both instruments captures the solar eclipse.
Read more: https://proba2.sidc.be/2020Dec14Eclipse
Review of solar and geomagnetic activity
SOLAR ACTIVITY
There were 2 beta regions (NOAA 2792 and 2793), which decayed to a plage in the second half of the week.
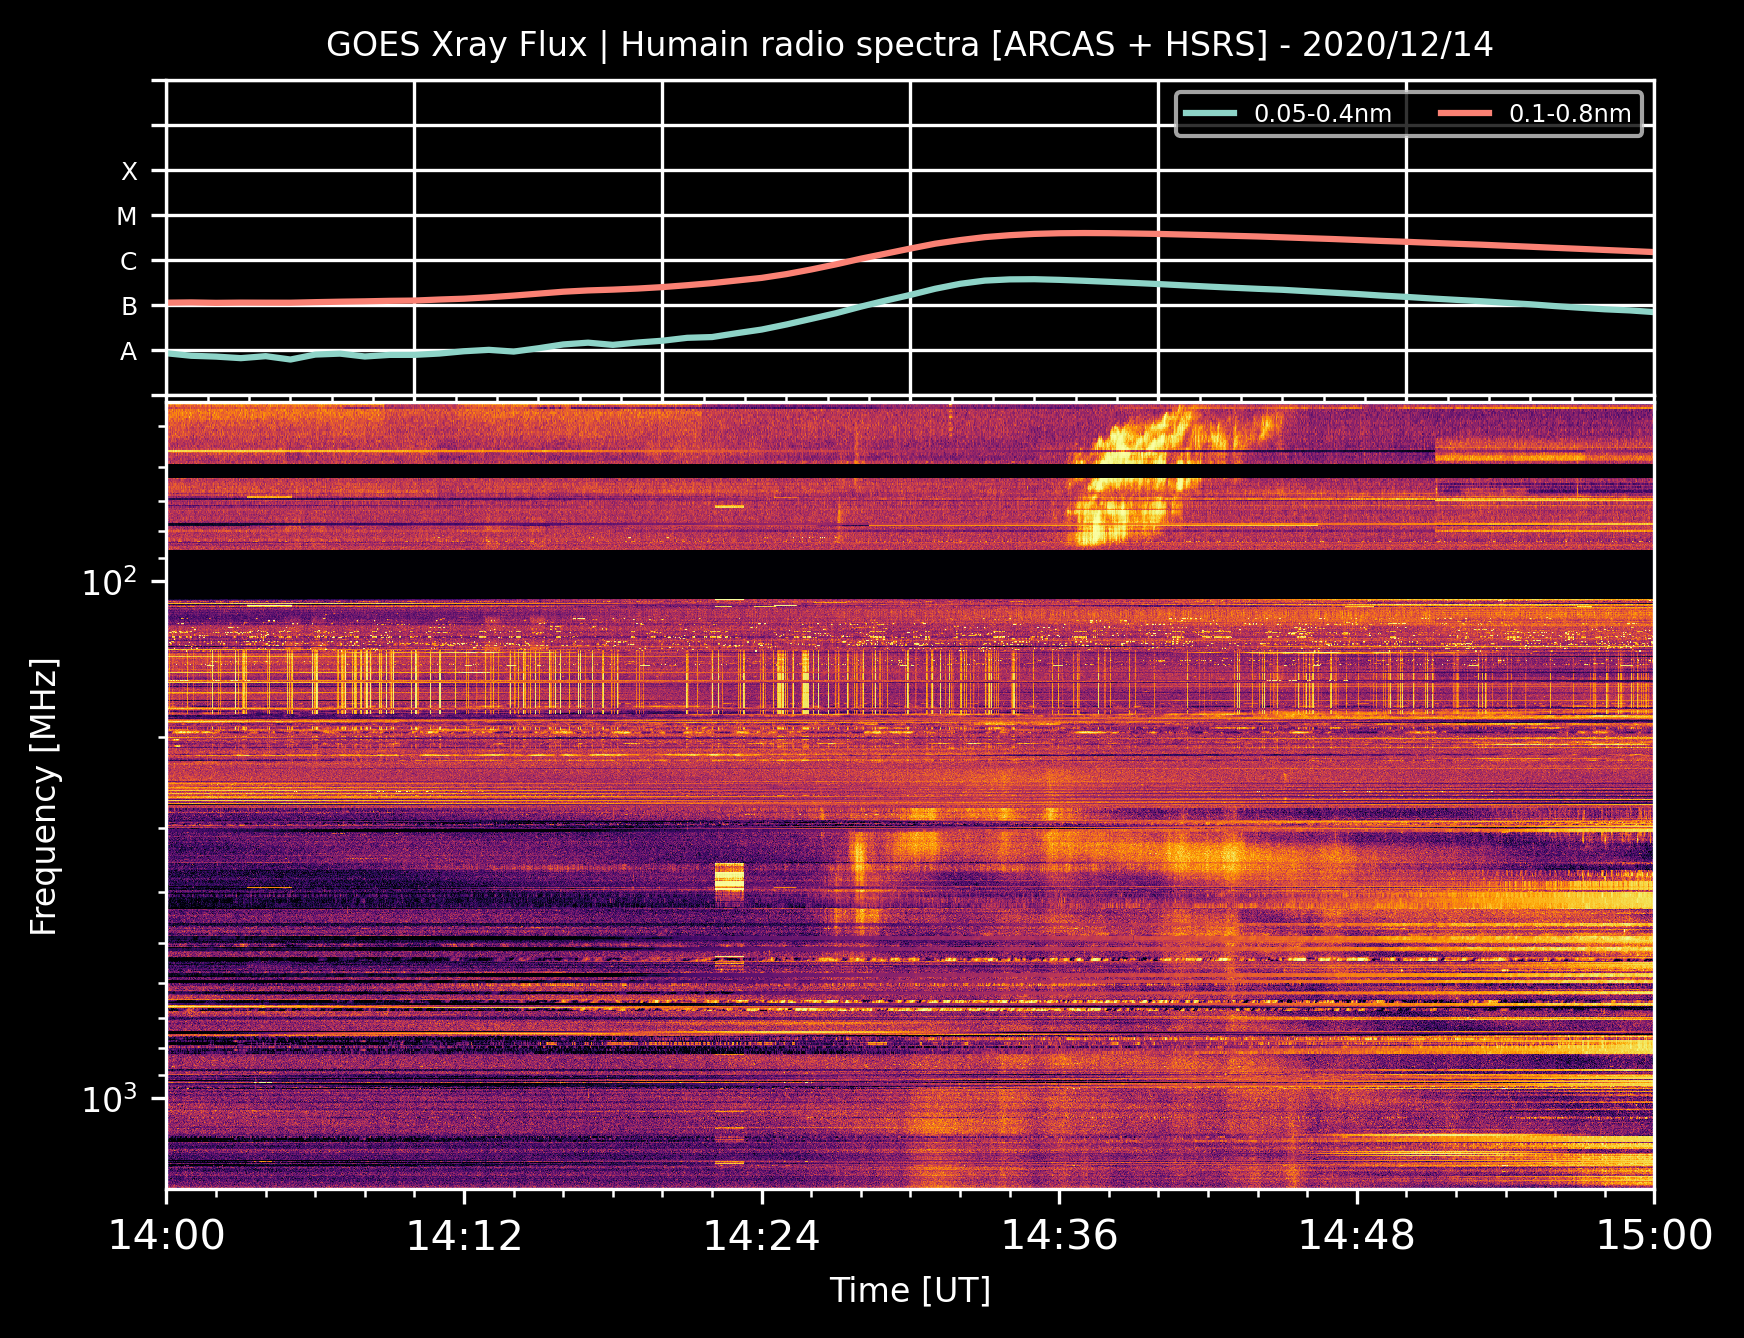
The GOES X-ray flux background was around A3-A9 level. Region 2792 produced one C4.0 flare on December 14.
There were no Earth-directed CMEs and the greater than 10 MeV proton flux, the greater than 2 MeV electron flux and the greater than 2 MeV electron fluence were at nominal levels.
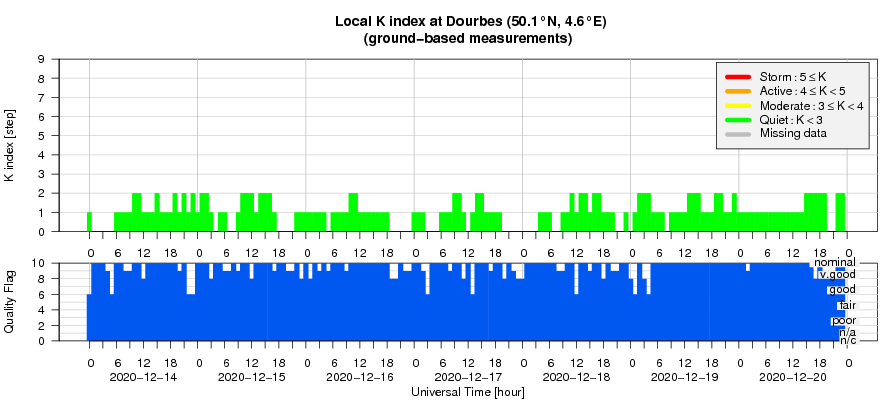
GEOMAGNETIC ACTIVITY
The solar wind registered by DSCOVR was nominal. Solar wind speeds varied between about 265 and 415 km/s. The Interplanetary Magnetic Field was predominantly orientated away from the Sun and its magnitude varied between about 0 and 11 nT. Bz was never below -5 nT for extended intervals.
K Dourbes and NOAA Kp levels did not exceed 2.
Another solar radio burst
Date and hour: 14 December 2020 13:25 - 14:48
Radio event: Metric type II burst with possibly decimetric emission/pulsations
context: C4.0 flare (14:37 UT, peak time) in NOAA AR 2792
quick look:
Check the complete list: http://sidc.be/humain/hsrs_events_cycle_25.php
The SILSO International Sunspot Number
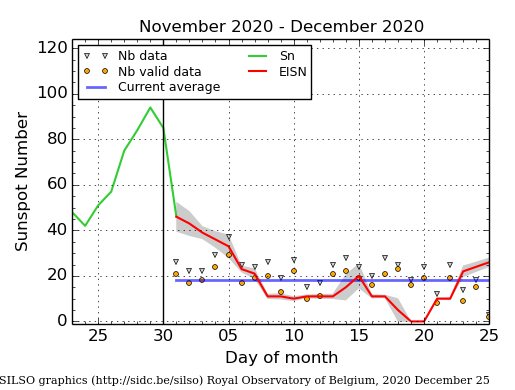
The daily Estimated International Sunspot Number (EISN, red curve with shaded error) derived by a simplified method from real-time data from the worldwide SILSO network. It extends the official Sunspot Number from the full processing of the preceding month (green line). The plot shows the last 30 days (about one solar rotation). The horizontal blue line shows the current monthly average. The yellow dots gives the number of stations that provided valid data. Valid data are used to calculate the EISN. The triangle gives the number of stations providing data. When a triangle and a yellow dot coincide, it means that all the data is used to calculate the EISN of that day.
PROBA2 Observations (14 Dec 2020 - 20 Dec 2020)
Solar Activity
Solar flare activity fluctuated between very low and low during the week.
In order to view the activity of this week in more detail, we suggest to go to the following website from which all the daily (normal and difference) movies can be accessed: https://proba2.oma.be/ssa
This page also lists the recorded flaring events.
A weekly overview movie can be found here (SWAP week 560). http://proba2.oma.be/swap/data/mpg/movies/weekly_movies/weekly_movie_2020_12_14.mp4
Details about some of this week's events can be found further below.
If any of the linked movies are unavailable they can be found in the P2SC movie repository here https://proba2.oma.be/swap/data/mpg/movies/
Monday Dec 14
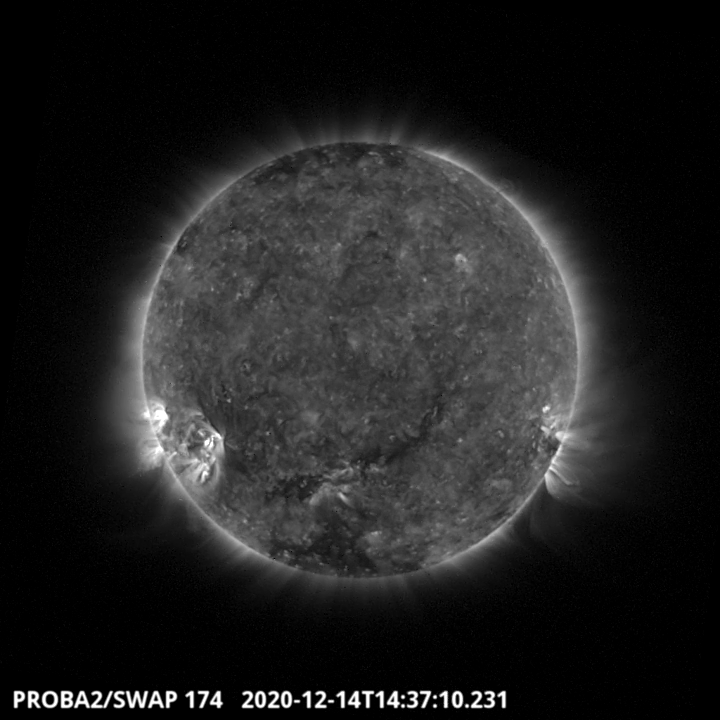
A C4.0 flare was observed by SWAP and LYRA on 2020-Dec-14. The flare occurred in the South-East part of the solar disk, as shown in the SWAP image above taken at 14:37 UT. Find a movie of the event here (SWAP movie). http://proba2.oma.be/swap/data/mpg/movies/20201214_swap_movie.mp4
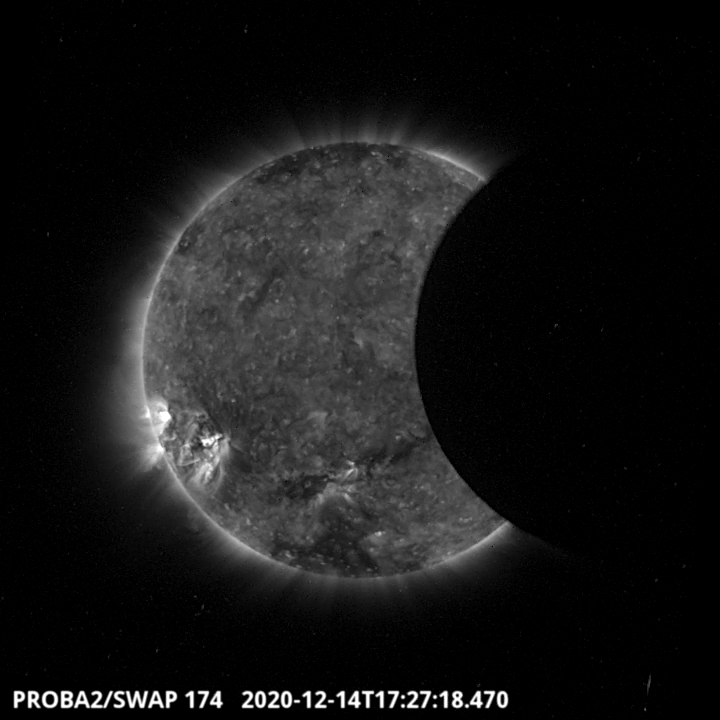
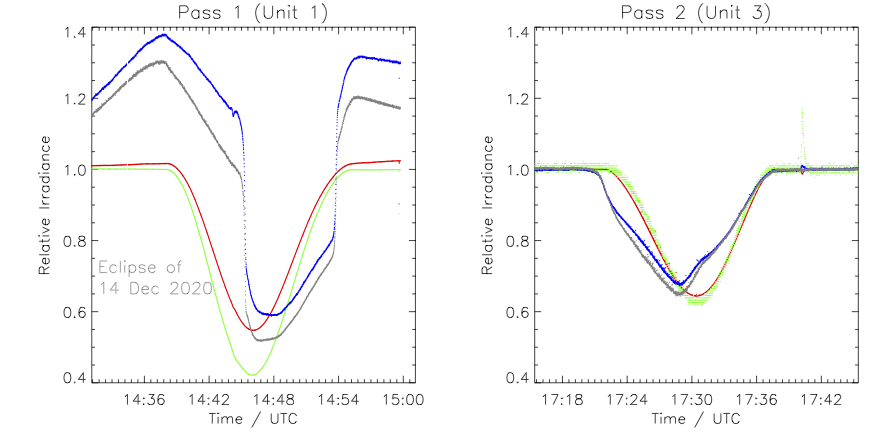
SWAP and LYRA have observed several passages of the Moon in their field-of-view, the image above is the second passage observed by SWAP with high cadence around 17:27UT. Find a movie of the event here (SWAP movie).
https://proba2.sidc.be/Events/2020-Dec-14-SolarEclipse/movies/swap_eclipse_2020_12_14_timestamp_lossless.mp4
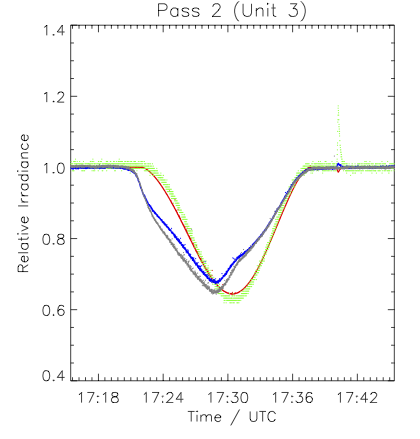
LYRA activated its backup units (unit 1 for the first passage around 14:40 and unit 3 for the second passage around 17:30, represented in the figure), which acquired in parallel with the nominal unit. The instrument monitored the progressive extinction of the solar light in its channels that observe in the ultraviolet and extreme ultraviolet.
Geomagnetic Observations at Dourbes (14 Dec 2020 - 20 Dec 2020)
The SIDC Space Weather Briefing
The Space Weather Briefing presented by the forecaster on duty from December 13 to 20. It reflects in images and graphs what is written in the Solar and Geomagnetic Activity report.

A pdf-version: http://www.stce.be/briefings/20201221_SWbriefing.pdf
The movie: http://www.stce.be/briefings/20201221_SWbriefing.m4v
Review of ionospheric activity (14 Dec 2020 - 20 Dec 2020)
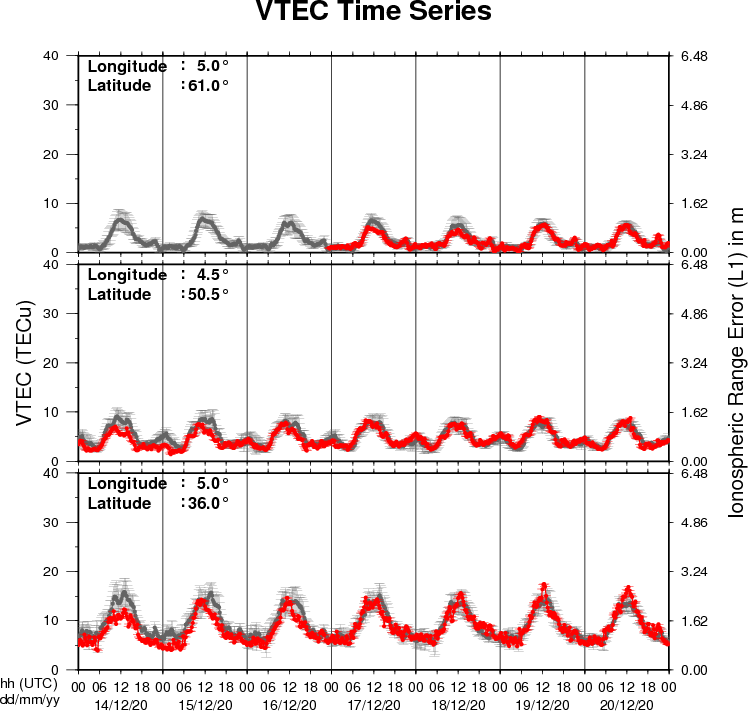
The figure shows the time evolution of the Vertical Total Electron Content (VTEC) (in red) during the last week at three locations:
a) in the northern part of Europe(N61°, 5°E)
b) above Brussels(N50.5°, 4.5°E)
c) in the southern part of Europe(N36°, 5°E)
This figure also shows (in grey) the normal ionospheric behaviour expected based on the median VTEC from the 15 previous days.
The VTEC is expressed in TECu (with TECu=10^16 electrons per square meter) and is directly related to the signal propagation delay due to the ionosphere (in figure: delay on GPS L1 frequency).
The Sun's radiation ionizes the Earth's upper atmosphere, the ionosphere, located from about 60km to 1000km above the Earth's surface.The ionization process in the ionosphere produces ions and free electrons. These electrons perturb the propagation of the GNSS (Global Navigation Satellite System) signals by inducing a so-called ionospheric delay.
See http://stce.be/newsletter/GNSS_final.pdf for some more explanations ; for detailed information, see http://gnss.be/ionosphere_tutorial.php