- Table of Content
- 1.PROBA2's view ...
- 2.Review of sola...
- 3.The Internatio...
- 4.PROBA2 Observa...
- 5.Review of geom...
- 6.Geomagnetic Ob...
- 7.The SIDC Space...
- 8.Review of iono...
2. Review of solar activity
3. The International Sunspot Number by Silso
4. PROBA2 Observations (4 Jan 2021 - 10 Jan 2021)
5. Review of geomagnetic activity
6. Geomagnetic Observations at Dourbes (4 Jan 2021 - 10 Jan 2021)
7. The SIDC Space Weather Briefing
8. Review of ionospheric activity (4 Jan 2021 - 10 Jan 2021)
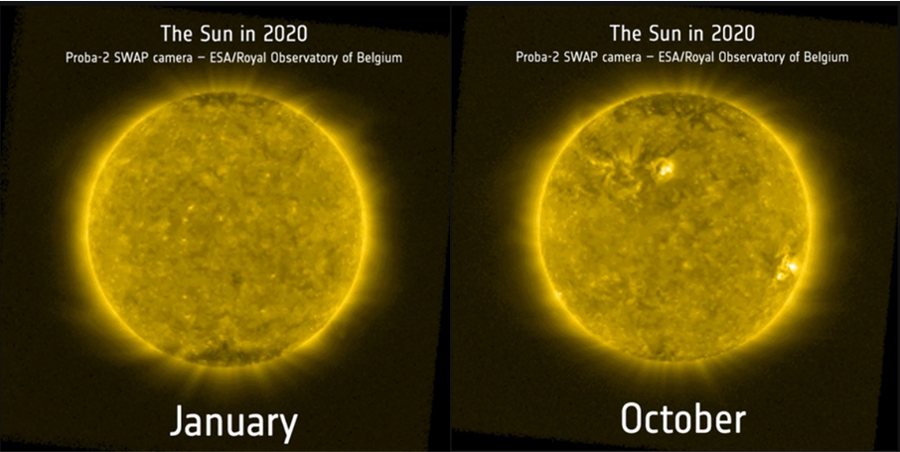
PROBA2's view of the Sun
The PROBA2 team has just released a poster with extreme ultraviolet (EUV) images of the Sun. For every day in 2020, it shows a picture of the Sun's hot outer atmosphere (the corona). These pictures were taken by its EUV camera called SWAP, showing the Sun in temperatures near 1 million degrees.
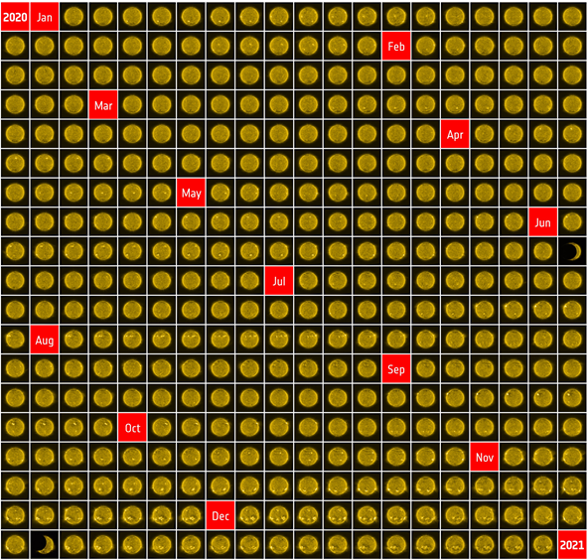
There's a clear evolution in the outlook of the corona. In the beginning of the year, no active regions were present. However near the end of the year, active regions (the bright patches) became visible and were located at relatively high latitudes of 25 degrees away from the solar equator, a clear sign the new solar cycle 25 has started.
Further information can be found on the webpage of the PROBA2 team (https://proba2.sidc.be/TheSunIn2020 ) or on the ESA website (https://www.esa.int/ESA_Multimedia/Images/2021/01/The_Sun_in_2020 ) where there's also a gif animation showing the evolution of the Sun in 2020. SWAP will also participate in a joint solar observation campaign with Solar Orbiter and the Parker Solar Probe from 10 till 20 January. More information on this PROBA2 page at https://proba2.sidc.be/OffpointsJanuary2021
Review of solar activity
With no active regions on the solar disk facing Earth, the solar X-ray flux remained below background (B) level.
On January 6, from 4:24UT, SoHO/LASCO C2 images show a CME with principle angle towards the North-West. Related on-disc signatures could be seen primarily in SDO/AIA 304 in the far North-Western quadrant. The CME has an additional front stretching over the North but the angular width stays well below the 150 degrees (hence not a partial halo). Its speed was around 450km/s and it was believed to be not wide and fast enough to impact Earth.
On January 8, two filaments in the South-Western quadrant erupted. The first was observed in SSO AIA 304 and 193 images from 2UT onwards. The second followed at 13UT.
A corresponding CME - towards the West, angular width around 90 degrees - was visible in LASCO C2 coronagraph images from 5:12UT onwards. The CME was also observed by the coronagraph CO2 onboard of STEREO A. The CME had a speed of maximum 300 km/s.
The greater than 10 MeV proton flux was at nominal levels over the week.
The greater than 2 MeV electron flux just briefly touched the 1000 pfu event threshold January 5 but otherwise remained below that threshold. The 24h electron fluence was at nominal levels with a general decreasing trend hroughout the week.
The International Sunspot Number by Silso
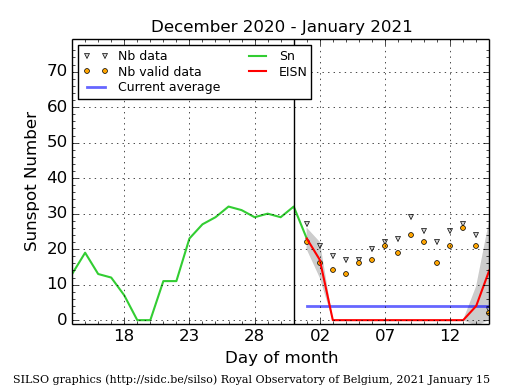
The daily Estimated International Sunspot Number (EISN, red curve with shaded error) derived by a simplified method from real-time data from the worldwide SILSO network. It extends the official Sunspot Number from the full processing of the preceding month (green line), a few days more than one solar rotation. The horizontal blue line shows the current monthly average. The yellow dots gives the number of stations that provided valid data. Valid data are used to calculate the EISN. The triangle gives the number of stations providing data. When a triangle and a yellow dot coincide, it means that all the data is used to calculate the EISN of that day.
PROBA2 Observations (4 Jan 2021 - 10 Jan 2021)
Solar Activity
Solar flare activity was very low during the week.
In order to view the activity of this week in more detail, we suggest to go to the following website from which all the daily (normal and difference) movies can be accessed: https://proba2.oma.be/ssa
This page also lists the recorded flaring events.
A weekly overview movie can be found here (SWAP week 563). http://proba2.oma.be/swap/data/mpg/movies/weekly_movies/weekly_movie_2021_01_04.mp4
Details about some of this week's events can be found further below.
If any of the linked movies are unavailable they can be found in the P2SC movie repository here https://proba2.oma.be/swap/data/mpg/movies/
Saturday Jan 09
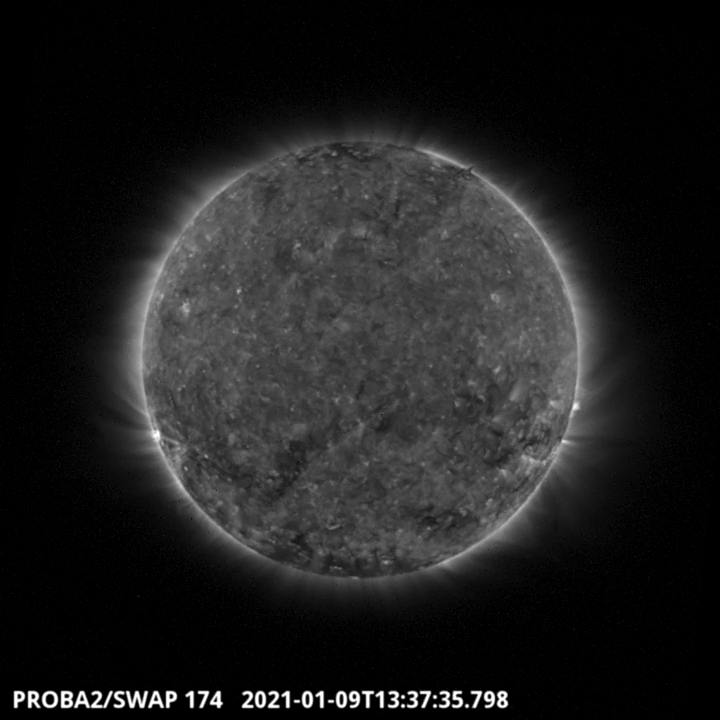
A filament can be observed on the SWAP image above in the Solar South-Eastern quadrant.
Find a movie of the events here (SWAP movie) http://proba2.oma.be/swap/data/mpg/movies/20210109_swap_movie.mp4
Review of geomagnetic activity
The solar wind decayed over the first days of the week.
By noon January 5 we saw the first signatures of an expected high speed stream in DSCVR data, situated in the L1 point. The magnetic field in the compression region preceding the high speed stream was 18nT. The interplanetary magnetic field carried by the high speed stream pointed towards the Sun. A second compression region passed L1 on January 6. The solar wind speed increased over 600km/s. The solar wind decreased slowly its speed after reaching this maximum.
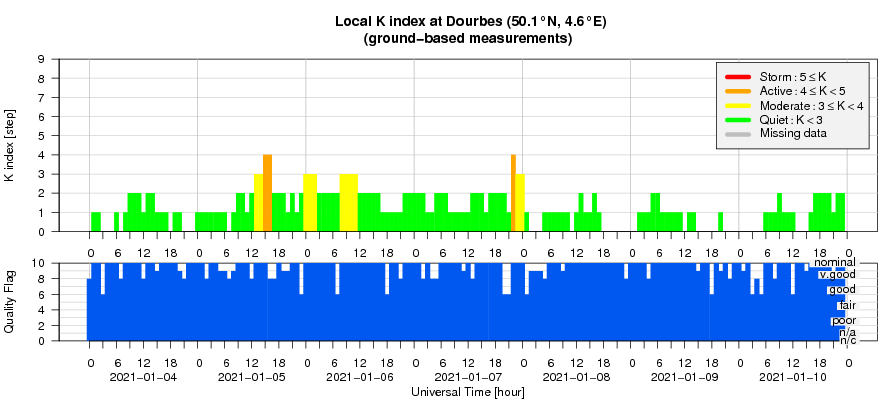
The geomagnetic field reached active conditions related to the high speed stream compression regions but was otherwise mostly quiet.
Geomagnetic Observations at Dourbes (4 Jan 2021 - 10 Jan 2021)
The SIDC Space Weather Briefing
The Space Weather Briefing presented by the forecaster on duty from Jan 3 to 10. It reflects in images and graphs what is written in the Solar and Geomagnetic Activity report.

A pdf-version: http://www.stce.be/briefings/20210111_SWbriefing.pdf
The movie: http://www.stce.be/briefings/20210111_SWbriefing.m4v
Review of ionospheric activity (4 Jan 2021 - 10 Jan 2021)
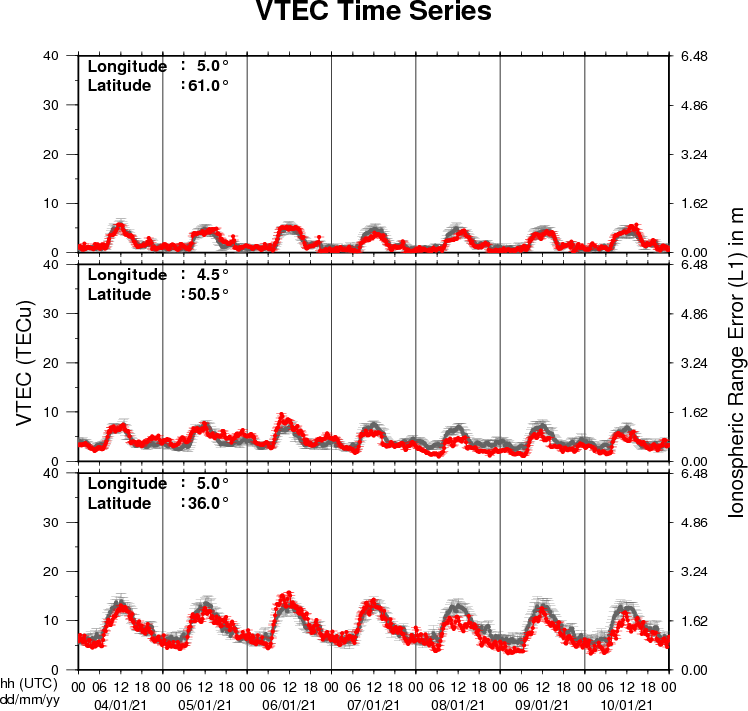
The figure shows the time evolution of the Vertical Total Electron Content (VTEC) (in red) during the last week at three locations:
a) in the northern part of Europe(N61°, 5°E)
b) above Brussels(N50.5°, 4.5°E)
c) in the southern part of Europe(N36°, 5°E)
This figure also shows (in grey) the normal ionospheric behaviour expected based on the median VTEC from the 15 previous days.
The VTEC is expressed in TECu (with TECu=10^16 electrons per square meter) and is directly related to the signal propagation delay due to the ionosphere (in figure: delay on GPS L1 frequency).
The Sun's radiation ionizes the Earth's upper atmosphere, the ionosphere, located from about 60km to 1000km above the Earth's surface.The ionization process in the ionosphere produces ions and free electrons. These electrons perturb the propagation of the GNSS (Global Navigation Satellite System) signals by inducing a so-called ionospheric delay.
See http://stce.be/newsletter/GNSS_final.pdf for some more explanations ; for detailed information, see http://gnss.be/ionosphere_tutorial.php