- Table of Content
- 1.NOAA 2786: Tak...
- 2.Review of sola...
- 3.PROBA2 Observa...
- 4.The Internatio...
- 5.Review of geom...
- 6.Geomagnetic Ob...
- 7.The SIDC Space...
- 8.Review of iono...
2. Review of solar activity
3. PROBA2 Observations (11 Jan 2021 - 17 Jan 2021)
4. The International Sunspot Number by Silso
5. Review of geomagnetic activity
6. Geomagnetic Observations at Dourbes (11 Jan 2021 - 17 Jan 2021)
7. The SIDC Space Weather Briefing
8. Review of ionospheric activity (11 Jan 2021 - 17 Jan 2021)
NOAA 2786: Take 3!
Early on 17 January, a sunspot rounded the southeast limb and was numbered by NOAA/SWPC as NOAA 2797. This is the same group as the big sunspot region that appeared late November (then numbered NOAA 2786), and that was responsible for a sequel late December when it was known as NOAA 2794. Calculation of its heliographic position revealed that the sunspot remained at a solar latitude of about -16 to -17 degrees, while its solar longitude gradually decreased from about 347 degrees in November over 345 degrees during its December transit to its current 340 degrees. This is due to the effects of differential rotation, i.e. the Sun rotates slightly slower around its axis with increasing solar latitude. At 17 degrees, this difference is not much but it becomes more clear after subsequent solar rotations.
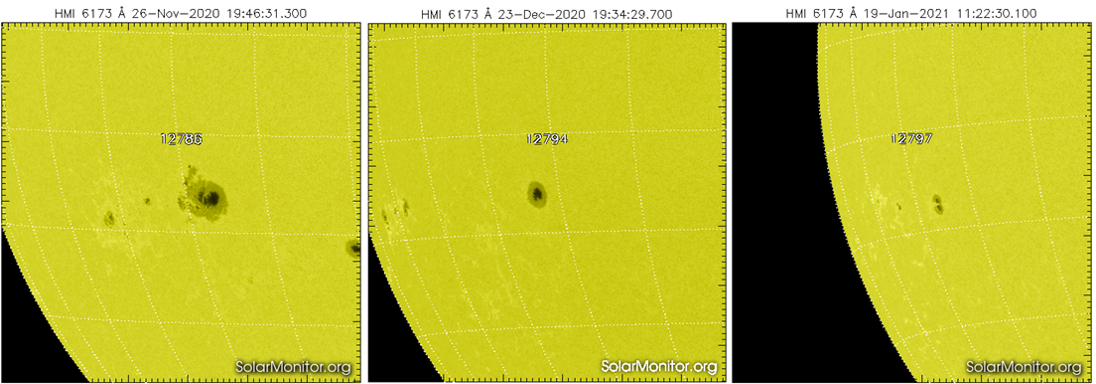
The images also reveal that the sunspot continues its decline. In November, the sunspot area of the group was about 6 times the surface are of the Earth, but now, the Earth's surface area is about double that of NOAA 2797. In November it produced 15 C-class flares, and had a quite complex appearance. In December, it did not produce any C-class flare and was just a simple symmetric sunspot. The first images of its current transit indicate that this main spot is further falling apart, as it is cut in two by a photospheric lightbridge. Such features usually herald the decaying phase of the spot, so chances are that the sunspot will vanish within the next few weeks.
Review of solar activity
The solar activity was very low.
The visible solar disk was spotless until Jan 15th when a new faint sunspot group emerged, which was later numbered and classified as NOAA AR 2796 (beta). This active region remained quiet. Only a few isolated B-class flares occurred at the end of the week. The X-ray flux remained below C-class level.
A slow back-sided CME was ejected from the east limb around 22 UTC on Jan 16th. It was probably related to low-level flaring activity from NOAA AR 2795. No Earth-directed Coronal Mass Ejections (CMEs) were observed in the available chronograph imagery for the entire week.
The greater than 10 MeV proton flux remained at background levels.
The greater than 2 MeV electron flux was under the 1000 pfu threshold. the electron fluence was at nominal levels.
PROBA2 Observations (11 Jan 2021 - 17 Jan 2021)
Solar Activity
Solar flare activity was very low during the week.
In order to view the activity of this week in more detail, we suggest to go to the following website from which all the daily (normal and difference) movies can be accessed: https://proba2.oma.be/ssa
This page also lists the recorded flaring events.
A weekly overview movie can be found here (SWAP week 564): https://proba2.sidc.be/swap/data/mpg/movies/weekly_movies/weekly_movie_2021_01_11.mp4
Details about some of this week's events can be found further below.
If any of the linked movies are unavailable they can be found in the P2SC movie repository here: https://proba2.oma.be/swap/data/mpg/movies/
Sunday Jan 17
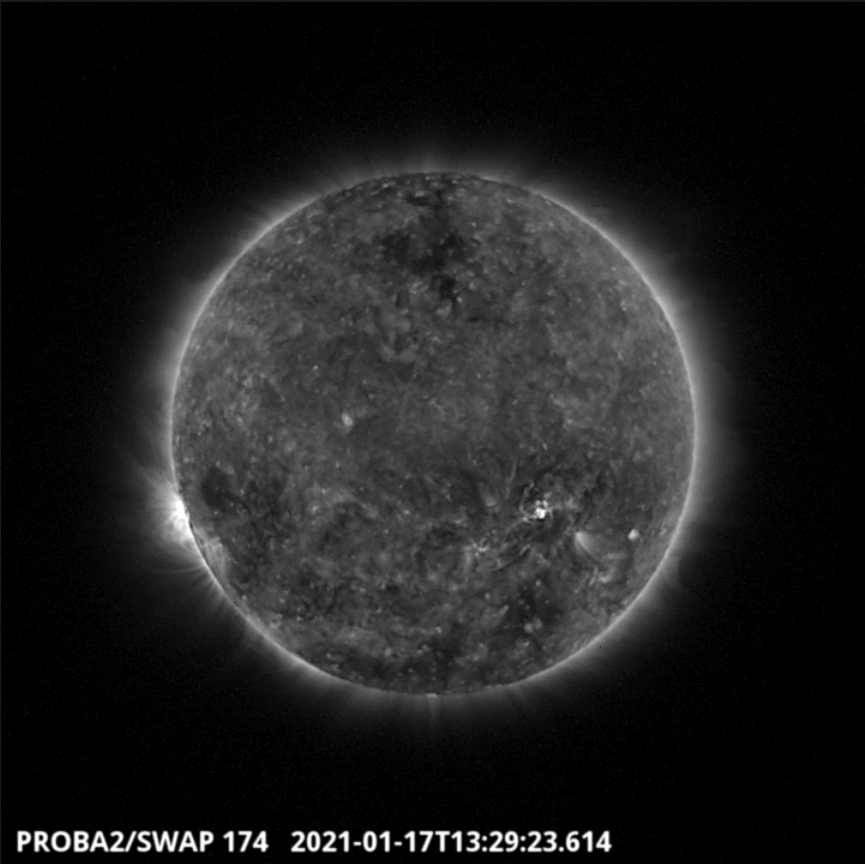
The largest flare of the week was a B2.8 flare, which was observed by SWAP and LYRA on 2021-Jan-17 and was associated with the newly emerged NOAA AR2796. The flare occurred in the south-western quadrant of the solar disk, as shown in the SWAP image above taken at 13:29 UT.
Find a movie of the event here: https://proba2.sidc.be/swap/movies/20210117_swap_movie.mp4 (SWAP movie).
The International Sunspot Number by Silso
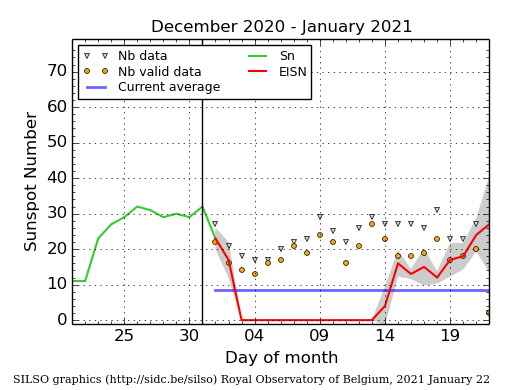
The daily Estimated International Sunspot Number (EISN, red curve with shaded error) derived by a simplified method from real-time data from the worldwide SILSO network. It extends the official Sunspot Number from the full processing of the preceding month (green line), a few days more than one solar rotation. The horizontal blue line shows the current monthly average. The yellow dots gives the number of stations that provided valid data. Valid data are used to calculate the EISN. The triangle gives the number of stations providing data. When a triangle and a yellow dot coincide, it means that all the data is used to calculate the EISN of that day.
Review of geomagnetic activity
The solar wind parameters (based on DSCOVR and ACE data) were elevated at the beginning of the week due to the combined influence of an ICME, related to the south-west CME ejected by the Sun on Jan 8th, and a CIR followed by a high speed stream (HSS) emanating from a positive polarity coronal hole. The interplanetary magnetic field reached 20.2 nT on Jan 11th with the north-south Bz component reaching -18.3 nT. The HSS related to the geo-effective positive polarity coronal hole was characterised with moderate speeds below 500km/s on Jan 11th and Jan 12th. From Jan 13th, the solar wind slowed down and returned to nominal conditions.
The geomagnetic conditions were mostly quiet over the week. The arrival of the ICME and the CIR/HSS pushed the geomagnetic conditions to active on Jan 11th and Jan 12th. Locally, in Dourbes, two periods with minor geomagnetic storms (from 16 to 18 UTC on Jan 11th and from 02 - 03 UTC on Jan 12th) occurred. On Jan 13th the geomagnetic conditions returned back to quiet for the rest of the week.
Geomagnetic Observations at Dourbes (11 Jan 2021 - 17 Jan 2021)

The SIDC Space Weather Briefing
The Space Weather Briefing presented by the forecaster on duty from Jan 10 to 17. It reflects in images and graphs what is written in the Solar and Geomagnetic Activity report.
A pdf-version: http://www.stce.be/briefings/20210118_SWbriefing.pdf
The movie: http://www.stce.be/briefings/20210118_SWbriefing.m4v
Review of ionospheric activity (11 Jan 2021 - 17 Jan 2021)
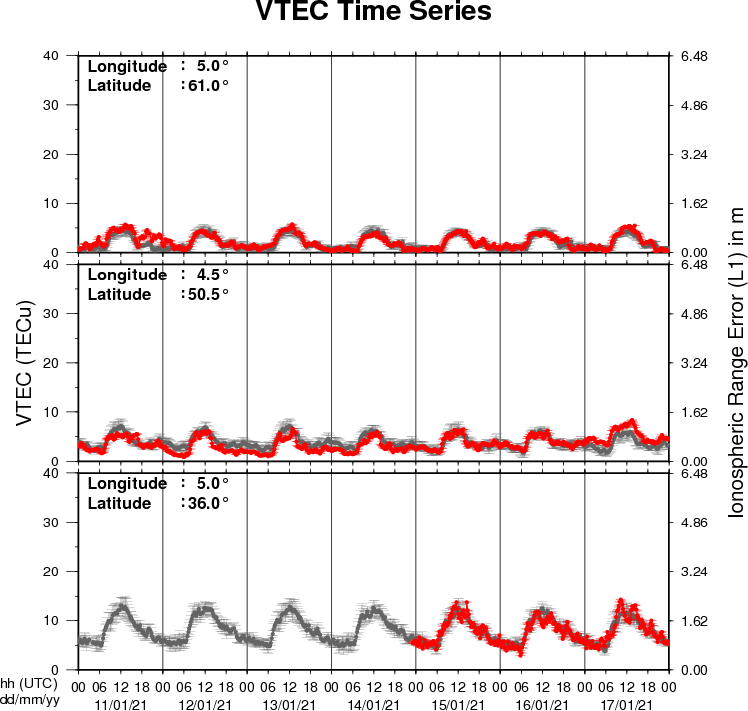
The figure shows the time evolution of the Vertical Total Electron Content (VTEC) (in red) during the last week at three locations:
a) in the northern part of Europe(N61°, 5°E)
b) above Brussels(N50.5°, 4.5°E)
c) in the southern part of Europe(N36°, 5°E)
This figure also shows (in grey) the normal ionospheric behaviour expected based on the median VTEC from the 15 previous days.
The VTEC is expressed in TECu (with TECu=10^16 electrons per square meter) and is directly related to the signal propagation delay due to the ionosphere (in figure: delay on GPS L1 frequency).
The Sun's radiation ionizes the Earth's upper atmosphere, the ionosphere, located from about 60km to 1000km above the Earth's surface.The ionization process in the ionosphere produces ions and free electrons. These electrons perturb the propagation of the GNSS (Global Navigation Satellite System) signals by inducing a so-called ionospheric delay.
See http://stce.be/newsletter/GNSS_final.pdf for some more explanations ; for detailed information, see http://gnss.be/ionosphere_tutorial.php