- Table of Content
- 1.A sunspot acti...
- 2.Review of sola...
- 3.PROBA2 Observa...
- 4.The Internatio...
- 5.Review of geom...
- 6.Geomagnetic Ob...
- 7.The SIDC Space...
- 8.Review of iono...
2. Review of solar activity
3. PROBA2 Observations (1 Mar 2021 - 7 Mar 2021)
4. The International Sunspot Number by Silso
5. Review of geomagnetic activity
6. Geomagnetic Observations at Dourbes (1 Mar 2021 - 7 Mar 2021)
7. The SIDC Space Weather Briefing
8. Review of ionospheric activity (1 Mar 2021 - 7 Mar 2021)
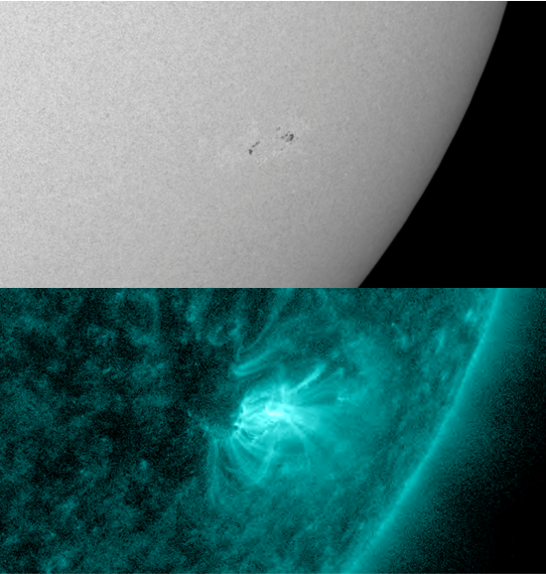
A sunspot activity nest
NOAA 2806 emerged on 28 February as a small compact sunspot region. It was decaying fairly quickly when, on 2 March, there was a renewed injection of magnetic flux adding some small spots to the group. Nonetheless, the region had decayed into a spotless plage by 5 March, and that seemed the end of it. Then surprizingly, there was a third injection of magnetic flux within the same active region, resulting in a relatively large sunspot area for this group during its transit over the solar disk. The sunspot region was about to rotate over the southwest solar limb by 9 March. The evolution can be seen in the SDO-imagery (https://sdo.gsfc.nasa.gov/data/aiahmi/ - created with the SWHelioviewer - http://swhv.oma.be/user_manual/ ), with on the left white light images and on the right the magnetograms (the white and black patches denote areas of opposite magnetic polarity). The 3 magnetic flux emergences on 28 February, 2 March and 6 March are indicated by respectively green, red and blue ellipses. The dashed ellipses outline the "old" active regions. NOAA 2806 originally emerged in the quiet photosphere, so there's no dashed ellipse for the 28 February image. A movie is available in the online version of this article at https://www.stce.be/news/518/welcome.html

It is certainly not uncommon that new magnetic flux emerges in or near the same active region, even if that region is already spotless. In fact, this clustering tendency of magnetic activity, i.e., active regions emerging in the immediate vicinity or within the boundaries of an existing active region, was already noted by Cassini in 1729 (see van Driel-Gesztelyi and Green (2015) for more details - https://link.springer.com/article/10.1007/lrsp-2015-1). Further research in the 1980s and 1990s showed that there is a 10 to 22-fold higher emergence rate within existing active regions than in the quiet sun. Repeated episodes of major flux emergence within an evolving active region may lead to increased magnetic complexity, and thus flaring activity, in particular when the new flux emerges right in front of just behind an active region. Spots of opposite magnetic polarity are then pushed towards each other, which may result in magnetic reconnection and thus strong solar flares. Such was the case e.g. on 9 August, when new magnetic flux emerged near the trailing portion of NOAA 1263 which resulted in an X6.9 flare, the 3rd strongest of the previous solar cycle (SC24 - (see the STCE newsitem at https://www.stce.be/news/353/welcome.html ). For NOAA 2806 however, the emergence of the new flux was too weak, too short-lived, and pretty much of the same magnetic configuration as that present in the existing active region, resulting only in some low-level B-class flaring on 7 and 8 March (see underneath).
Review of solar activity
Beta regions NOAA 2806 and 2807 emerged during the first part of the week, and decayed to plages afterwards. However, magnetic flux again emerged from region 2806. The place became again a beta region.
GOES measured an A-level background X-ray flux. Region 2807 produced one C1.2 flare on March 3.
There were no Earth-directed CMEs.
The greater than 10 MeV proton flux was at nominal levels throughout the week.
The greater than 2 MeV electron flux and the greater than 2 MeV electron fluence reached moderate levels on several days.
PROBA2 Observations (1 Mar 2021 - 7 Mar 2021)
Solar Activity
Solar flare activity fluctuated between very low and low during the week.
In order to view the activity of this week in more detail, we suggest to go to the following website from which all the daily (normal and difference) movies can be accessed: https://proba2.oma.be/ssa
This page also lists the recorded flaring events.
A weekly overview movie can be found here (SWAP week 571). http://proba2.oma.be/swap/data/mpg/movies/weekly_movies/weekly_movie_2021_03_01.mp4
Details about some of this week's events can be found further below.
If any of the linked movies are unavailable they can be found in the P2SC movie repository here https://proba2.oma.be/swap/data/mpg/movies/
Wednesday Mar 03
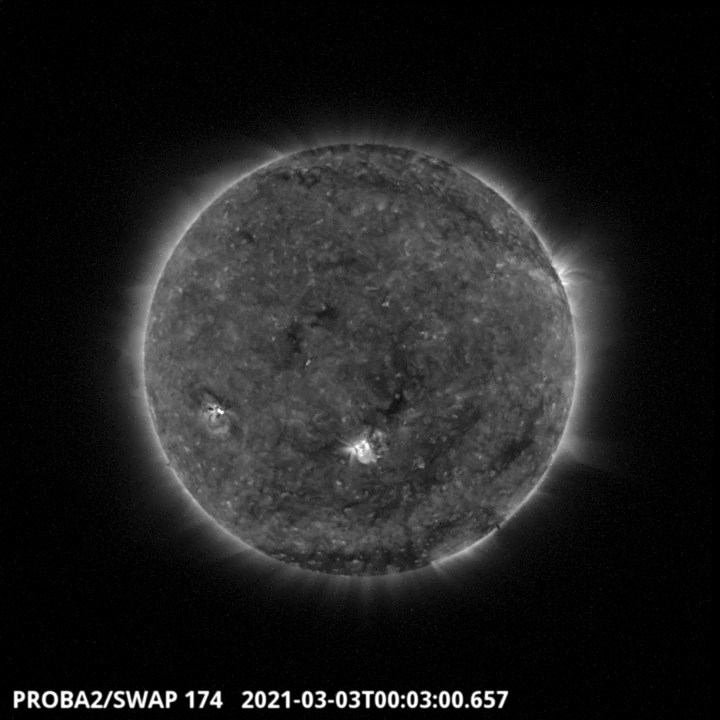
An active region in the South-East part of the solar disk erupted around 00:03UT. This eruption originating from the NOAA active region 2807 has been classified as a C1.2 flare. Find a movie of the events here (SWAP movie) http://proba2.oma.be/swap/data/mpg/movies/20210303_swap_movie.mp4
Thursday Mar 04

A coronal hole is visible on the SWAP image above. It is localized on the South-West part of the solar disk just above the 2806 active region. Find a movie of the event here (SWAP movie) http://proba2.oma.be/swap/data/mpg/movies/20210304_swap_movie.mp4
The International Sunspot Number by Silso
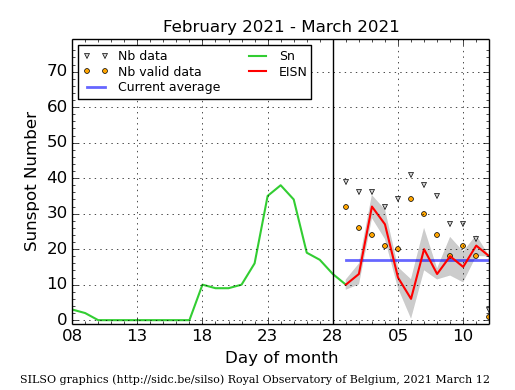
The daily Estimated International Sunspot Number (EISN, red curve with shaded error) derived by a simplified method from real-time data from the worldwide SILSO network. It extends the official Sunspot Number from the full processing of the preceding month (green line), a few days more than one solar rotation. The horizontal blue line shows the current monthly average. The yellow dots gives the number of stations that provided valid data. Valid data are used to calculate the EISN. The triangle gives the number of stations providing data. When a triangle and a yellow dot coincide, it means that all the data is used to calculate the EISN of that day.
Review of geomagnetic activity
DSCOVR observations of the solar wind were indicative of solar wind enhancements on March 2 (arrival of the high speed stream of the negative polarity south polar crown coronal hole) and on March 6 (arrival of the high speed stream of a positive polarity equatorial coronal hole).
Solar wind speeds up to 691 km/s were registered, with a maximal Interplanetary Magnetic Field magnitude of 14 nT. There were some intervals with Bz below -5 nT, resulting in one NOAA Kp=6 interval and one NOAA Kp=5 interval on March 1 and several NOAA Kp=5 and K Dourbes=5 intervals on March 3.
Geomagnetic Observations at Dourbes (1 Mar 2021 - 7 Mar 2021)

The SIDC Space Weather Briefing
The Space Weather Briefing presented by the forecaster on duty from Feb 28 to March 7. It reflects in images and graphs what is written in the Solar and Geomagnetic Activity report.
A pdf-version: https://www.stce.be/briefings/20210308_SWbriefing.pdf
The movie: https://www.stce.be/briefings/20210308_SWbriefing.m4v
Review of ionospheric activity (1 Mar 2021 - 7 Mar 2021)

The figure shows the time evolution of the Vertical Total Electron Content (VTEC) (in red) during the last week at three locations:
a) in the northern part of Europe(N61°, 5°E)
b) above Brussels(N50.5°, 4.5°E)
c) in the southern part of Europe(N36°, 5°E)
This figure also shows (in grey) the normal ionospheric behaviour expected based on the median VTEC from the 15 previous days.
The VTEC is expressed in TECu (with TECu=10^16 electrons per square meter) and is directly related to the signal propagation delay due to the ionosphere (in figure: delay on GPS L1 frequency).
The Sun's radiation ionizes the Earth's upper atmosphere, the ionosphere, located from about 60km to 1000km above the Earth's surface.The ionization process in the ionosphere produces ions and free electrons. These electrons perturb the propagation of the GNSS (Global Navigation Satellite System) signals by inducing a so-called ionospheric delay.
See http://stce.be/newsletter/GNSS_final.pdf for some more explanations ; for detailed information, see http://gnss.be/ionosphere_tutorial.php