- Table of Content
- 1.Space Weather ...
- 2.Seminars to fo...
- 3.Review of sola...
- 4.PROBA2 Observa...
- 5.The Internatio...
- 6.Review of geom...
- 7.Geomagnetic Ob...
- 8.The SIDC Space...
- 9.Review of iono...
2. Seminars to follow
3. Review of solar activity
4. PROBA2 Observations (15 Mar 2021 - 21 Mar 2021)
5. The International Sunspot Number by Silso
6. Review of geomagnetic activity
7. Geomagnetic Observations at Dourbes (15 Mar 2021 - 21 Mar 2021)
8. The SIDC Space Weather Briefing
9. Review of ionospheric activity (15 Mar 2021 - 21 Mar 2021)
Space Weather Introductory Course
At the moment of writing, 8 participants are answering 40 online questions about space weather drivers, solar storms, space weather bulletins, space weather impacts, etc. As soon as everybody finished the quiz and the certificates are distributed, the March 2021 Space Weather Introductory Course reaches its end.

If you are interested in a Space Weather Course, check our Space Weather Education Center (https://www.stce.be/SWEC)
Seminars to follow
If you have time and feel like, there are two online seminars on March 26, 2021.
On Massive Stellar Clusters in the Large Magellanic Cloud, 10:30: https://www.stce.be/node/905
On the MAJIS/JUICE project, 14:00: https://www.stce.be/node/906
Review of solar activity
Solar activity was very low. Over the week there were in total four active regions (ARs) on the solar disk, NOAA AR 2808 to AR 2811. The active regions did not produce any significant flares. NOAA AR2808 was most active at the start of the week, producing a B3.2 flare on Mar 16. NOAA AR 2811 also produced multiple low-level B-class flares on Mar 20 and 21.
A Coronal Mass Ejection (CME) was seen in SOHO/LASCO-C2 and STEREO-COR2 coronagraph imagery from 01:45 UT and attributed to a filament eruption in the south east quadrant.
The greater than 10 MeV proton flux was at nominal values.
The greater than 2 MeV electron flux first exceeded the 1000 pfu alert threshold on Mar 14 and it continued to be at high levels for the most of the week remaining above or at this alert threshold every day except on Mar 20.
The greater than 2 MeV electron fluence reached moderate levels between Mar 15 and Mar 19, before reducing to nominal levels on Mar 20 and 21.
PROBA2 Observations (15 Mar 2021 - 21 Mar 2021)
Solar Activity
Solar flare activity was very low during the week.
In order to view the activity of this week in more detail, we suggest to go to the following website from which all the daily (normal and difference) movies can be accessed: https://proba2.oma.be/ssa
This page also lists the recorded flaring events.
A weekly overview movie can be found here (SWAP week 573) http://proba2.oma.be/swap/data/mpg/movies/weekly_movies/weekly_movie_2021_03_15.mp4.
Details about some of this week's events can be found further below.
If any of the linked movies are unavailable they can be found in the P2SC movie repository here https://proba2.oma.be/swap/data/mpg/movies/
Tuesday Mar 16

A flow on the North West part of the solar disk is visible on the SWAP image above. It has been labeled as a B3.2 flare coming from the NOAA active region 2808. Find a movie of the events here (SWAP movie) http://proba2.oma.be/swap/data/mpg/movies/20210316_swap_movie.mp4
The International Sunspot Number by Silso
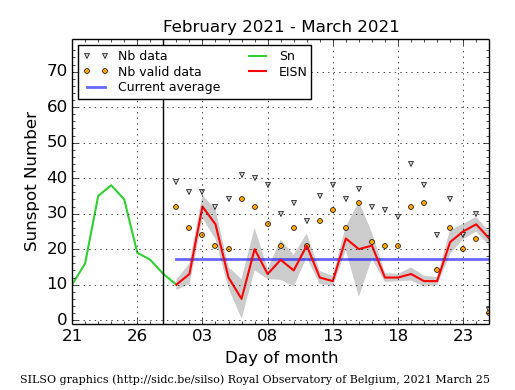
The daily Estimated International Sunspot Number (EISN, red curve with shaded error) derived by a simplified method from real-time data from the worldwide SILSO network. It extends the official Sunspot Number from the full processing of the preceding month (green line), a few days more than one solar rotation. The horizontal blue line shows the current monthly average. The yellow dots gives the number of stations that provided valid data. Valid data are used to calculate the EISN. The triangle gives the number of stations providing data. When a triangle and a yellow dot coincide, it means that all the data is used to calculate the EISN of that day.
Review of geomagnetic activity
Solar wind parameters were at elevated levels at the start of the week, with a maximum speed of 600 km/s on Mar 14, as the Earth was under the influence of the high-speed stream associated with the negative polarity coronal hole (CH) that began to traverse the central meridian on Mar 11. The solar wind speed gradually decreased and stabilized around 300 km/s on March 17.
On Mar 20, the solar wind conditions started to become enhanced again, due to the arrival of the high-speed stream associated with the extension to the southern polar CH, which crossed the central meridian on Mar 17. The solar wind speed reached values of 680 km/s and Bz had a minimum value of -19 nT.
The interplanetary magnetic field was predominantly directed towards the Sun (phi angle in the negative sector) for most of the week, except on Mar 17, when it switched into the positive sector.
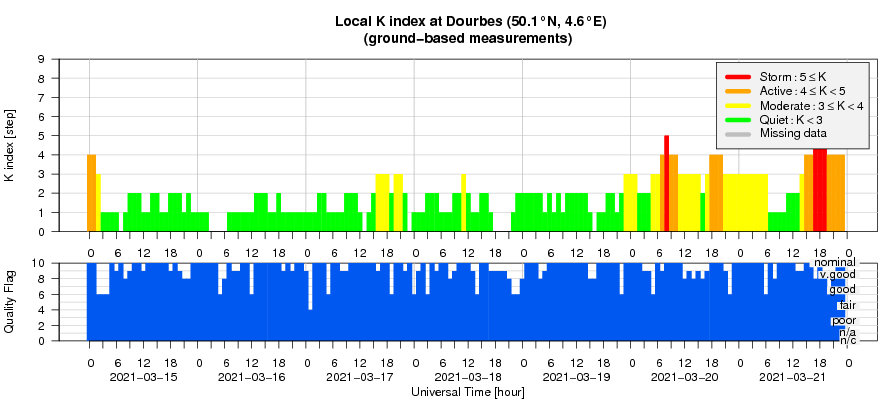
Geomagnetic activity was at active to minor storm levels on Mar 14. From Mar 15 to Mar 19, the geomagnetic conditions were quiet to unsettled before increasing to minor to moderate storm levels on Mar 20 and 21, due to the arrival of the expected high-speed stream.
Geomagnetic Observations at Dourbes (15 Mar 2021 - 21 Mar 2021)
The SIDC Space Weather Briefing
The Space Weather Briefing presented by the forecaster on duty from March 14 to 21. It reflects in images and graphs what is written in the Solar and Geomagnetic Activity report.

A pdf-version: https://www.stce.be/briefings/20210322_SWbriefing.pdf
The movie: https://www.stce.be/briefings/20210322_SWbriefing.m4v
Review of ionospheric activity (15 Mar 2021 - 21 Mar 2021)
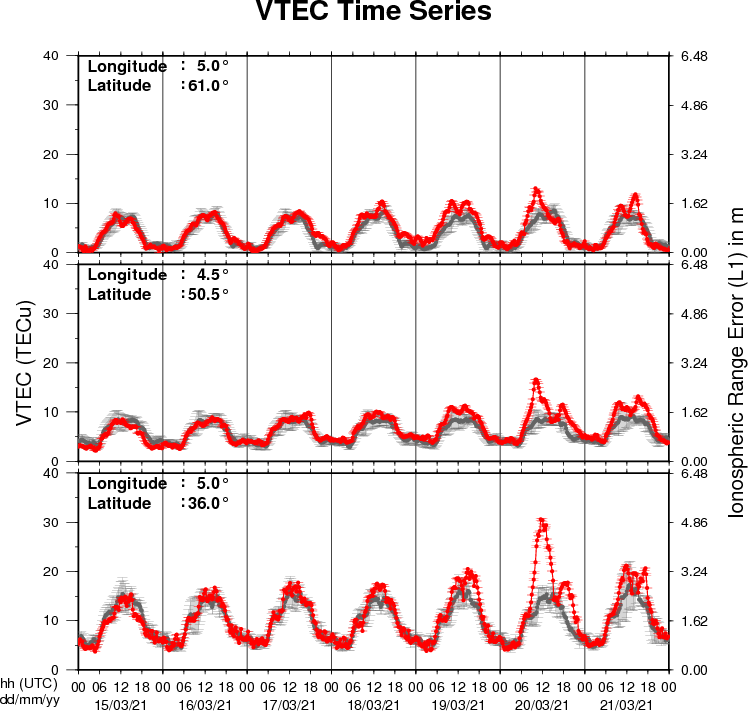
The figure shows the time evolution of the Vertical Total Electron Content (VTEC) (in red) during the last week at three locations:
a) in the northern part of Europe(N61°, 5°E)
b) above Brussels(N50.5°, 4.5°E)
c) in the southern part of Europe(N36°, 5°E)
This figure also shows (in grey) the normal ionospheric behaviour expected based on the median VTEC from the 15 previous days.
The VTEC is expressed in TECu (with TECu=10^16 electrons per square meter) and is directly related to the signal propagation delay due to the ionosphere (in figure: delay on GPS L1 frequency).
The Sun's radiation ionizes the Earth's upper atmosphere, the ionosphere, located from about 60km to 1000km above the Earth's surface.The ionization process in the ionosphere produces ions and free electrons. These electrons perturb the propagation of the GNSS (Global Navigation Satellite System) signals by inducing a so-called ionospheric delay.
See http://stce.be/newsletter/GNSS_final.pdf for some more explanations ; for detailed information, see http://gnss.be/ionosphere_tutorial.php