- Table of Content
- 1.EUI - First Li...
- 2.Strong flares ...
- 3.PSP steals ano...
- 4.Review of sola...
- 5.PROBA2 Observa...
- 6.The Internatio...
- 7.Noticeable Sol...
- 8.Review of geom...
- 9.Geomagnetic Ob...
- 10.The SIDC Space...
- 11.Review of iono...
2. Strong flares during SC25
3. PSP steals another kiss from the Sun
4. Review of solar activity
5. PROBA2 Observations (3 May 2021 - 9 May 2021)
6. The International Sunspot Number by Silso
7. Noticeable Solar Events (3 May 2021 - 9 May 2021)
8. Review of geomagnetic activity
9. Geomagnetic Observations at Dourbes (3 May 2021 - 9 May 2021)
10. The SIDC Space Weather Briefing
11. Review of ionospheric activity (3 May 2021 - 9 May 2021)
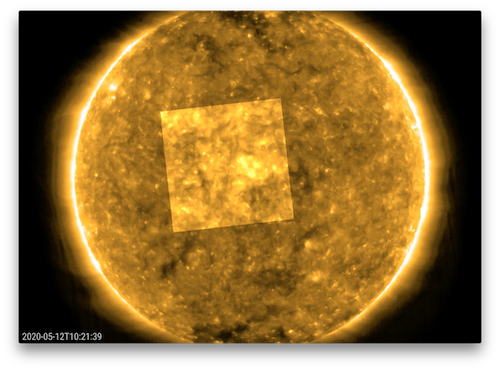
EUI - First Light 1 year
The 3 telescopes of the Extreme Ultraviolet Imager (EUI) onboard Solar Orbiter opened their doors on May 12, 2020 to photograph the Sun. This is exactly 1 year ago. This ‘First Light’ was a crucial step to get the EUI telescopes up and running and pave the path to research.

Test - Test - Test
During the past year, our space telescope experts had to figure out what the best way was to operate the telescopes remotely while they cruise through deep space. Answers to critical questions needed to be found: which exposure time produces the best image, how many pictures can we take per minute, do we have to finetune the data compression by the onboard computer, where are the bad bad pixels in the sensors, do the telescopes understand the uploaded computer commands, etc.
The EUI support team worked relentlessly to build a firm basis such that the EUI telescopes can take pictures in the best possible conditions, with the most performant software and smoothly running techniques.
Research - research - research
Researchers everywhere are eager to analyse such high quality and high resolution pictures. The first light of May 12 2020 was already an excellent foretaste leading to an immediate success by revealing ‘campfires’ on the Sun. Researchers started debating right away this discovery. It might give an answer to the long standing mystery of why the solar atmosphere is much hotter than the solar surface.
One year after launch, the EUI telescopes are ready for their scientific mission that will officially start on December 27 2021. Scientists worldwide are preparing to use the EUI instrument, together with other instruments on Solar Orbiter, on different space missions and on the ground.
It's clear, EUI paves the way for more, better and in-depth science. Expectations are high.
EUI on its voyage to the Sun
The movie: https://www.stce.be/movies/JHV_FSI_EUI_12May2020.mp4
To make the highest possible resolution images of the solar atmosphere, Solar Orbiter was designed to bring EUI closer to the Sun than any other solar disk telescope before. The JHelioviewer movie starts with a view by the EUI “Full Sun” telescope and fades over to an image of one of the EUI high resolution telescopes. The images shown are the first light images taken on 2020 May 12. As we approach the Sun, the resolution in the images will further increase. In the last year, several close approaches (‘perihelion’) were already made, bringing EUI half way between the Earth and the Sun. The heat shield of Solar Orbiter resisted the 4x increased heat. In March 2022, a next perihelion will bring us down to a third of the Earth- Sun distance.
Worldwide teleworking
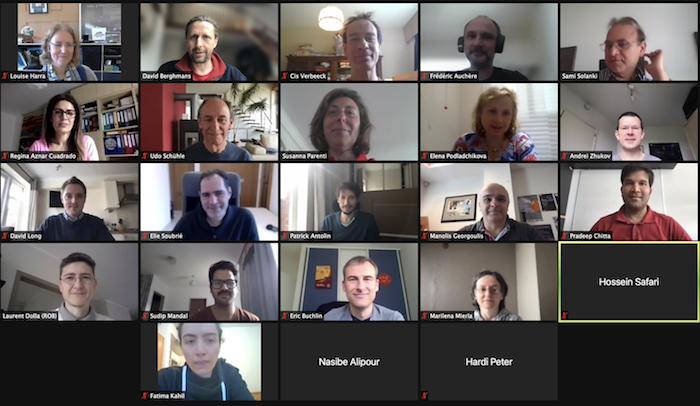
For the EUI online scientific conference on May 10 2021, 340 participants from all over the world joined.
The world has changed during the past year since EUI took its first images. With the ongoing pandemic, scientists cannot meet anymore in scientific conferences or workshops to coordinate their research or give training in summer schools for future scientists. The Solar Orbiter scientists are therefore massively embracing new ways of interacting, learning to set-up online communities, chat-room channels, and ‘conference’ presentations streaming over the internet. Often scientists are learning the tricks from their teenage children. As the end of the pandemic hopefully comes in sight, scientists are faced with the question of whether they want to go back to continuous worldwide travelling or whether the growing climate-awareness will make the new ‘worldwide teleworking’ trend stay.
Strong flares during SC25
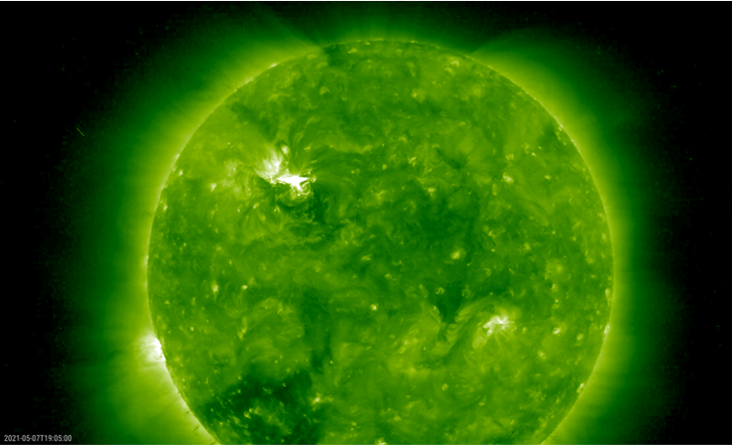
NOAA 2822 was a compact heap of sunspots that had just rounded the Sun's east limb when it produced a M3.9 flare on 7 May. EUV (extreme ultraviolet) imagery showed that the flare was accompanied by coronal dimming (a temporary darkening in the solar corona, also known as "transient coronal hole") and an obvious coronal wave (see this STCE Newsitem at https://www.stce.be/news/241/welcome.html for more info). Together with the observed radio bursts, these were all signs that a coronal mass ejection (CME) was associated with the flaring event. Further analysis indicated that this CME had no earth-dirtected component. Satellites such as PROBA2 (https://proba2.sidc.be/ssa ) had a sideview of the eruption, but STEREO-A (https://stereo-ssc.nascom.nasa.gov/beacon/beacon_secchi.shtml ), which is currently trailing the Earth by about 52 degrees, almost had a heads-on view and was able to image the flare-related features in a much clearer way. Images by PROBA2/SWAP and STEREO-A/EUVI 195 can be found underneath, with movie clips available in the online version of this article at https://www.stce.be/news/527/welcome.html
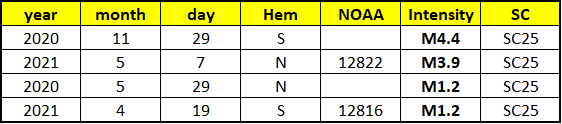
The M3.9 flare is the 4th M-class flare of the ongoing solar cycle (SC25). The strongest so far took place on 29 November 2020 (M4.4 beyond the northeast limb) - see the table underneath (Hem: solar hemisphere ; NOAA: group number). The online version contains links to the top 10 of solar flares of the previous SC21, SC22, SC23 and SC24. The GOES scaling factor was not taken into account while compiling these tables (see https://www.swpc.noaa.gov/news/goes-14-15-are-now-storage-mode ), i.e. the data are presented as they are available at the relevant NOAA/SWPC websites. As SC25 further unfolds, stronger solar flares will be produced and so the table will gradually be populated by X-class flares, the strongest of which may happen even far into the solar cycle (September 2017 for SC24!). So please make sure to visit this webpage from time to time!
PSP steals another kiss from the Sun
On its continuing quest to unravel the mysteries of the solar wind, the Parker Solar Probe (PSP) had its 8th perihelion (closest distance to the Sun) on 29 April. A description of the goals and technologies of this spacecraft is in this STCE newsitem (https://www.stce.be/news/435/welcome.html ) and of course on the dedicated NASA website at https://www.nasa.gov/content/goddard/parker-solar-probe
The folks here at STCE have superposed part of the orbit of PSP as seen from Earth on coronagraphic images obtained by the SOHO/LASCO instrument (https://sohowww.nascom.nasa.gov/ ) and solar EUV images by SDO/AIA (https://sdo.gsfc.nasa.gov/data/aiahmi/ ). It covers the trajectory of PSP from 24 April till 02 May 2021, with perihelion on 29 April at a distance of only 11.1 million km or 16 solar radii. As seen from Earth, the spacecraft starts from behind the Sun, has its intimate rendez-vous to the east of the Sun ("left"), then turning and passing in front of the Sun. The clips, available in the online version of this newsitem at https://www.stce.be/news/528/welcome.html , show the trajectory from within the ecliptic as seen from Earth (left) and from above the ecliptic (right; PSP trajectory only, the blue dot on the right represents Earth). The ecliptic is the plane created by the yearly orbit of the Earth around the Sun. Over the next few years, PSP will get even closer to the Sun!
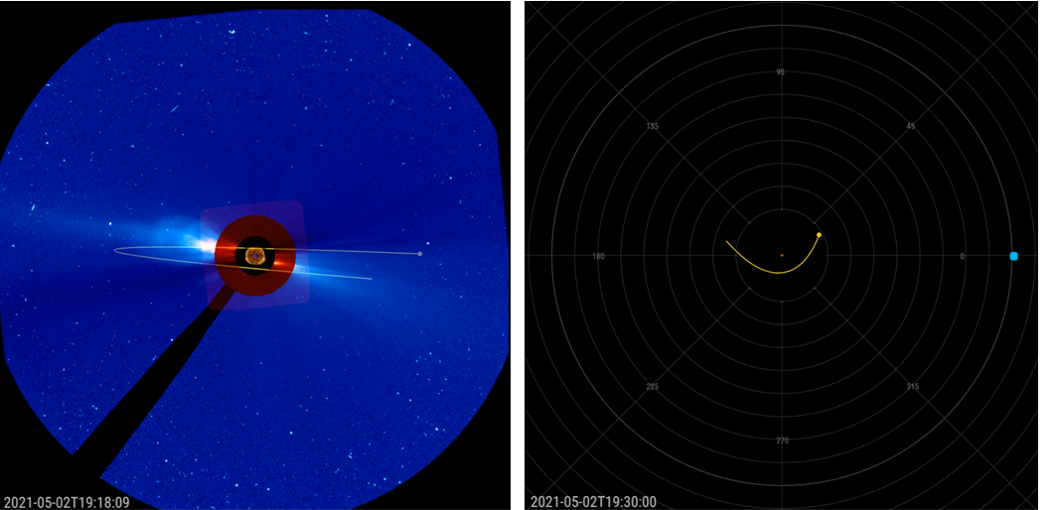
The movie combining PSP's trajectory with SOHO's coronagraphic and SDO's EUV imagery is great for a few reasons. First of all, it illustrates the concept of heliophysics quite completely: it shows the Sun, its corona, the solar wind with its transients (coronal mass ejections aka "CMEs"), then (solar) cosmic rays which are visible as mostly short stripes in SOHO's imagery, and even two planets on the left: Venus and (the faster moving) Mercury, all affected by the variable output of the Sun. Second, the combo movie illustrates the two techniques used for observations: remote-sensing (EUV imager - SDO/AIA, coronagraphs - SOHO/LASCO) and in situ measurements (PSP). And finally, the PSP perihelion was very close to the LASCO plane of the sky, so the movie gives the right idea.
Review of solar activity
Solar activity was moderate. Over the week, one active region (AR) was present on the solar disk: NOAA AR 2822 (Catania sunspot group 93). The AR rotated onto the solar disk on May 07 and produced an M3.9 flare, which peaked at 19:04UT May 07, and four C-class flares between May 07 and 09.
A filament stretching from the south-east quadrant towards the central meridian erupted on May 09, visible in SDO/AIA 304 images from around 09:20UT. From the combined LASCO-C2 and STEREO-A observations, the associated Coronal Mass Ejection was predicted to impact Earth late on May 12.
The greater than 10 MeV proton flux was at nominal levels.
The greater than 2 MeV electron flux remained below the 1000 pfu alert threshold and the 24h electron fluence was at nominal levels.
PROBA2 Observations (3 May 2021 - 9 May 2021)
Solar Activity
Solar flare activity fluctuated from very low to moderate during the week.
In order to view the activity of this week in more detail, we suggest to go to the following website from which all the daily (normal and difference) movies can be accessed: https://proba2.oma.be/ssa
This page also lists the recorded flaring events.
A weekly overview movie can be found here (SWAP week 580): https://proba2.sidc.be/swap/data/mpg/movies/weekly_movies/weekly_movie_2021_05_03.mp4
Details about some of this week's events can be found further below.
If any of the linked movies are unavailable they can be found in the P2SC movie repository here: https://proba2.oma.be/swap/data/mpg/movies/
Wednesday May 05

An eruption was observed by SWAP on the north-east limb of the solar disk on 2021-May-05, as shown in the SWAP image above taken at 22:36 UT.
Find a movie of the entire day here (SWAP movie): https://proba2.sidc.be/swap/movies/20210505_swap_movie.mp4 and here (SWAP difference movie): https://proba2.sidc.be/swap/movies/20210505_swap_diff.mp4.
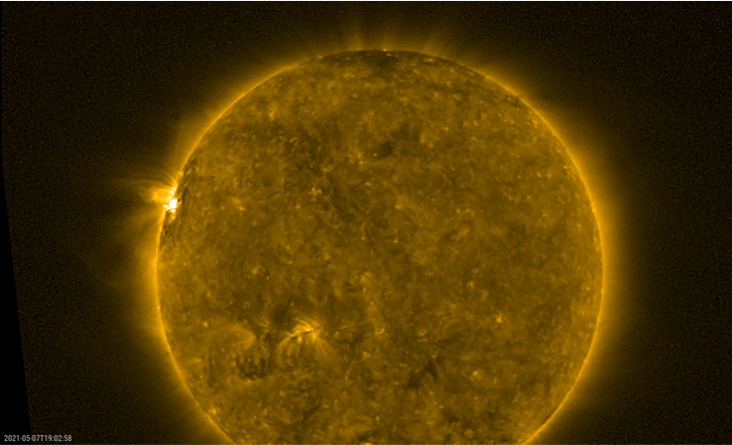
Friday May 07
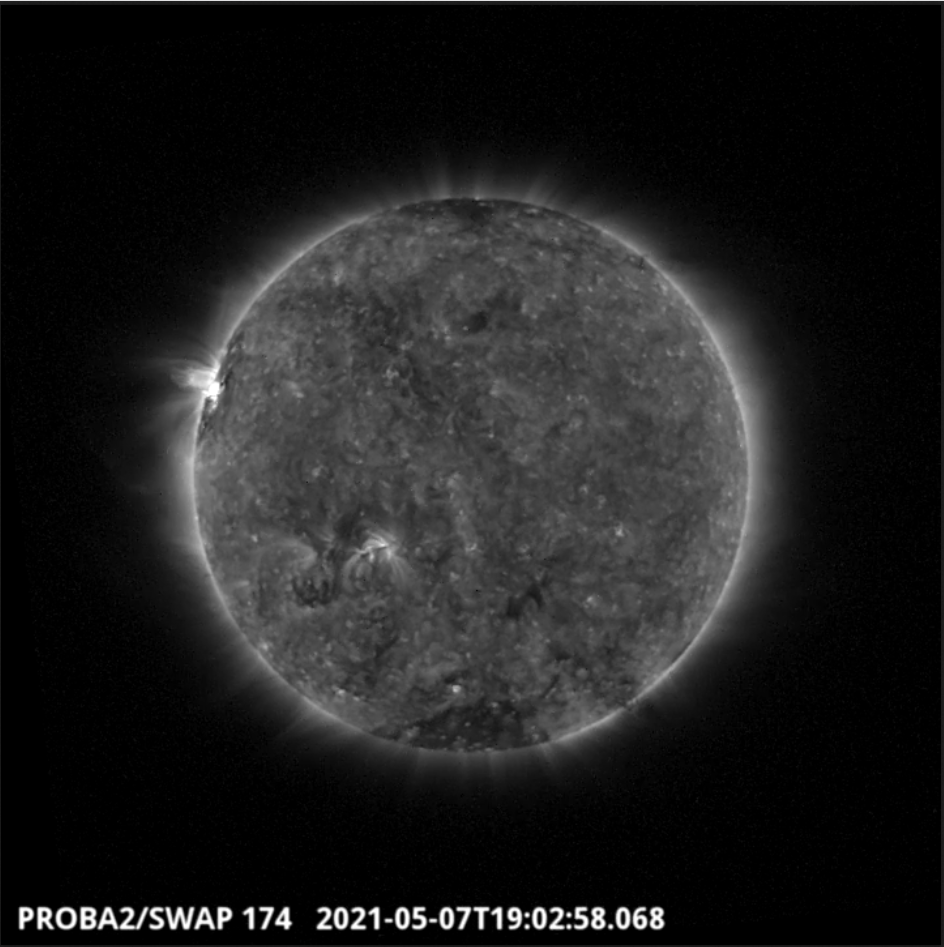
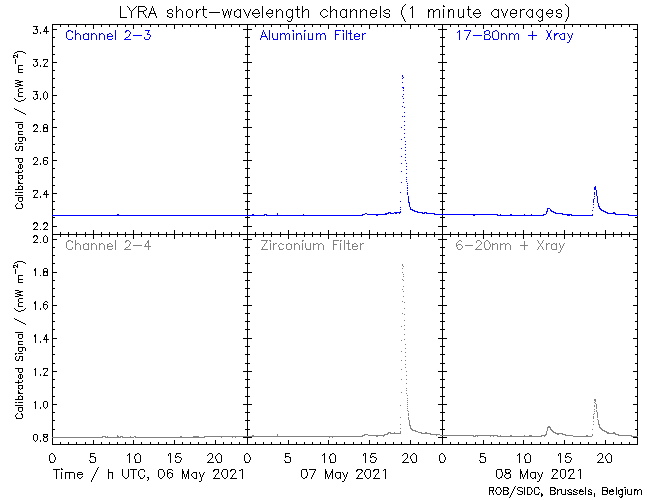
The largest flare of the week, an M3.9 flare, was observed by SWAP and LYRA. The flare and associated eruption is visible on the north-east limb of the solar disk on 2021-May-07, as shown in the SWAP image above taken at 19:02 UT.
Find a movie of the entire day here (SWAP movie): https://proba2.sidc.be/swap/movies/20210507_swap_movie.mp4 and here (SWAP difference movie): https://proba2.sidc.be/swap/movies/20210507_swap_diff.mp4
The International Sunspot Number by Silso
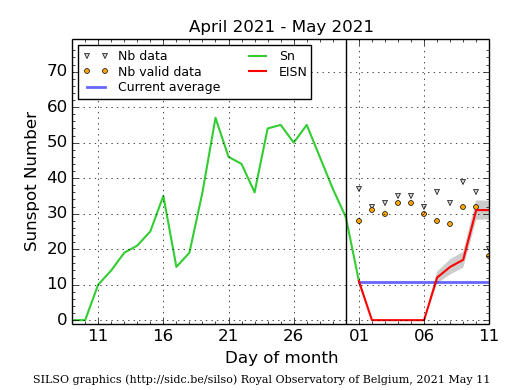
The daily Estimated International Sunspot Number (EISN, red curve with shaded error) derived by a simplified method from real-time data from the worldwide SILSO network. It extends the official Sunspot Number from the full processing of the preceding month (green line), a few days more than one solar rotation. The horizontal blue line shows the current monthly average. The yellow dots gives the number of stations that provided valid data. Valid data are used to calculate the EISN. The triangle gives the number of stations providing data. When a triangle and a yellow dot coincide, it means that all the data is used to calculate the EISN of that day.
Noticeable Solar Events (3 May 2021 - 9 May 2021)
| DAY | BEGIN | MAX | END | LOC | XRAY | OP | 10CM | TYPE | Cat | NOAA |
| 07 | 1843 | 1904 | 1919 | M3.9 | N | 94 | I/3 8 | 2822 |
| LOC: approximate heliographic location | TYPE: radio burst type |
| XRAY: X-ray flare class | Cat: Catania sunspot group number |
| OP: optical flare class | NOAA: NOAA active region number |
| 10CM: peak 10 cm radio flux |
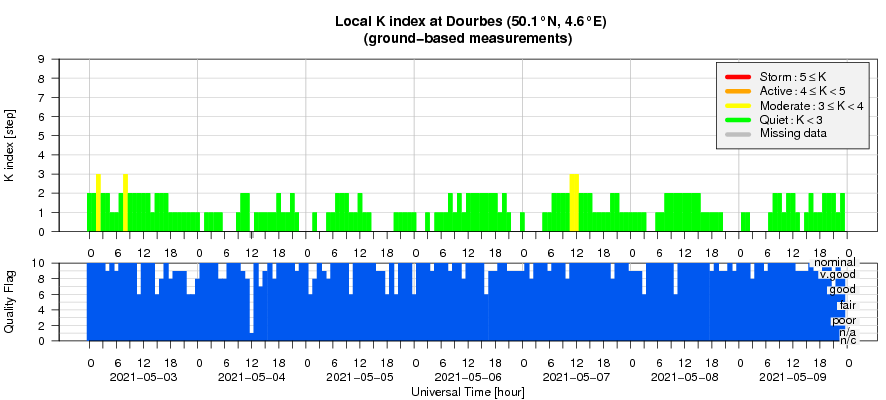
Review of geomagnetic activity
The solar wind speed was slightly elevated for the first half of the week, with a maximum speed of 500 km/s, as the Earth was under the influence of the high-speed stream associated with the positive polarity coronal hole that began to traverse the central meridian on April 30. From May 04, the solar wind speed began to gradually decrease and stabilized around 300 km/s for the rest of the week. The direction of the interplanetary magnetic field was predominantly directed away from the Sun (phi angle in the positive sector).
Geomagnetic activity was at quiet to unsettled levels for the first half of the week. From May 04, the geomagnetic activity then returned to mostly quiet conditions.
Geomagnetic Observations at Dourbes (3 May 2021 - 9 May 2021)
The SIDC Space Weather Briefing
The Space Weather Briefing presented by the forecaster on duty from May 2 to 9. It reflects in images and graphs what is written in the Solar and Geomagnetic Activity report.

A pdf-version: https://www.stce.be/briefings/20210510_SWbriefing.pdf
The movie: https://www.stce.be/briefings/20210510_SWbriefing.m4v
Review of ionospheric activity (3 May 2021 - 9 May 2021)
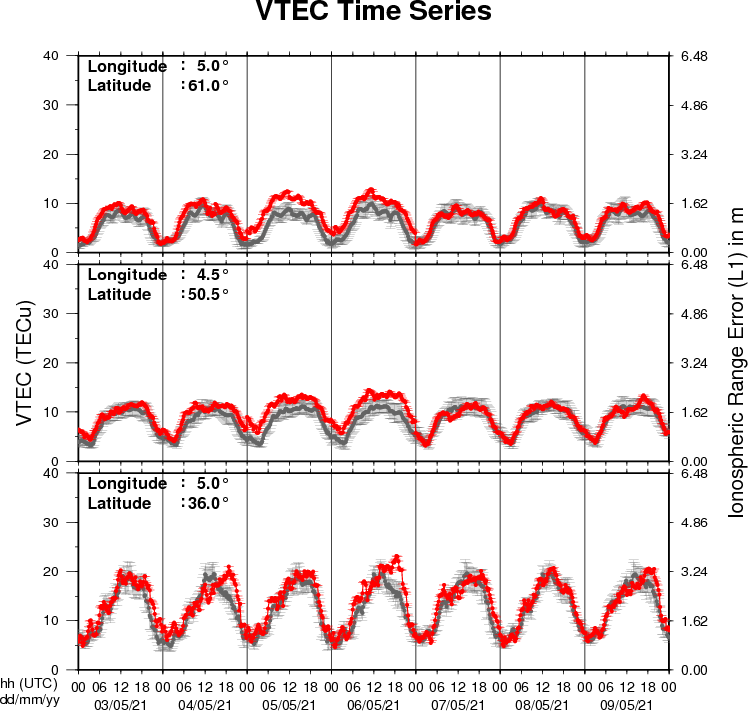
The figure shows the time evolution of the Vertical Total Electron Content (VTEC) (in red) during the last week at three locations:
a) in the northern part of Europe(N61°, 5°E)
b) above Brussels(N50.5°, 4.5°E)
c) in the southern part of Europe(N36°, 5°E)
This figure also shows (in grey) the normal ionospheric behaviour expected based on the median VTEC from the 15 previous days.
The VTEC is expressed in TECu (with TECu=10^16 electrons per square meter) and is directly related to the signal propagation delay due to the ionosphere (in figure: delay on GPS L1 frequency).
The Sun's radiation ionizes the Earth's upper atmosphere, the ionosphere, located from about 60km to 1000km above the Earth's surface.The ionization process in the ionosphere produces ions and free electrons. These electrons perturb the propagation of the GNSS (Global Navigation Satellite System) signals by inducing a so-called ionospheric delay.
See http://stce.be/newsletter/GNSS_final.pdf for some more explanations ; for detailed information, see http://gnss.be/ionosphere_tutorial.php