- Table of Content
- 1.Geomagnetic st...
- 2.Solar Eclipse ...
- 3.Review of sola...
- 4.The Internatio...
- 5.PROBA2 Observa...
- 6.Review of geom...
- 7.Geomagnetic Ob...
- 8.The SIDC Space...
- 9.Review of iono...
2. Solar Eclipse Challenge
3. Review of solar activity
4. The International Sunspot Number by Silso
5. PROBA2 Observations (14 Jun 2021 - 20 Jun 2021)
6. Review of geomagnetic activity
7. Geomagnetic Observations at Dourbes (14 Jun 2021 - 20 Jun 2021)
8. The SIDC Space Weather Briefing
9. Review of ionospheric activity (14 Jun 2021 - 20 Jun 2021)
Geomagnetic storm
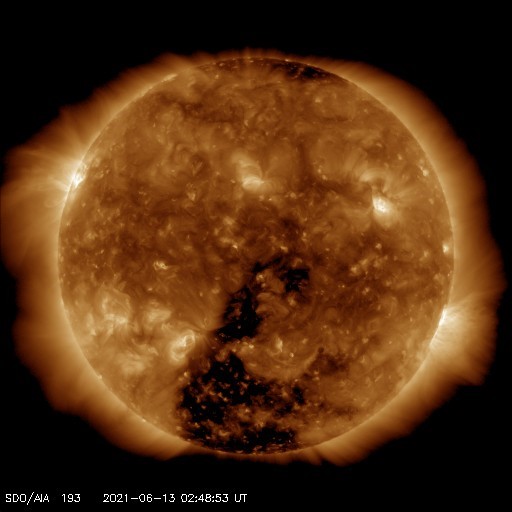
Late on 15 June, another geomagnetic storm has been recorded for solar cycle 25 (SC25). The source was a high speed wind stream associated with an extension from the southern polar coronal hole. Solar wind speed reached values near 600km/s, while Bz briefly peaked near -10nT. The coronal hole can be seen in the SDO/AIA 193 image from 13 June underneath when it was passing the Sun's central meridian.
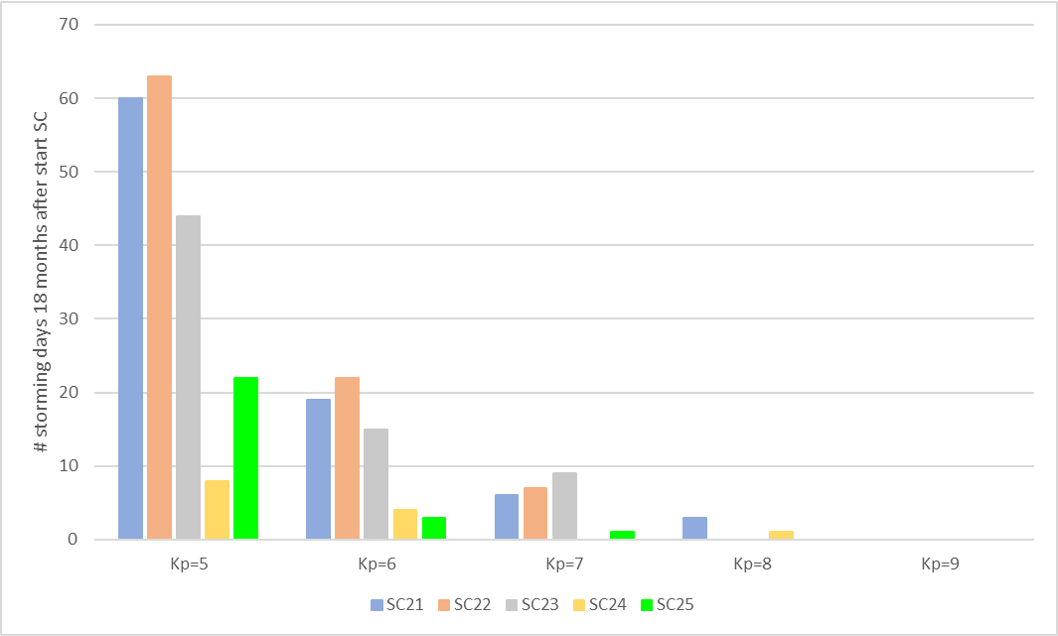
Over the last couple of months, we have had already several instances when geomagnetic storming conditions were reached. On 12 May, there was even a strong geomagnetic storm following the arrival of an interplanetary coronal mass ejection. So how does this geomagnetic activity relate to the previous solar cycles (SC)? In the graph underneath (data from WDC Kyoto), for each SC since 1976 (SC21 thru SC25), and for the period covering 18 months after the respective solar cycle minimum (see SILSO: http://sidc.oma.be/silso/cyclesminmax ), the number of geomagnetic storming days (vertical axis) are represented and binned per level of Kp from Kp=5 to Kp=9 (horizontal axis). Please check out the STCE SWx Classification page at https://www.stce.be/educational/classification for more info on geomagnetic indices and levels of geomagnetic activity. Though the numbers for June 2021 are not complete yet, the overall tendency is clear. The graph shows that -so far- SC25 has been geomagnetically more active than the previous SC24, in particular concerning the number of days with minor storming. Nonetheless, both SC24 and SC25 numbers pale in comparison to SC23 and especially SC21 and 22. Note that no extremely severe storms have been observed yet, in none of the 5 SCs which is fairly OK considering we are still at the start of the SC, but also because this kind of storms are isolated events and thus better evaluated over a much longer period, e.g. an entire solar cycle.
Solar Eclipse Challenge
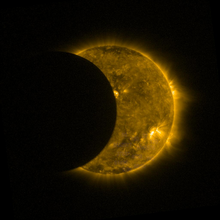
On June 10, 2021, a partial solar eclipse took place. Our telescope SWAP onboard the satellite PROBA2 could see the moon sliding over the Sun several times.
For this occasion, we organised a solar eclipse challenge with 12 questions related to PROBA2 and SWAP. The answers were hidden in this EUV image of the solar eclipse. The trick was to play with the blue values of the image.
The challenge has finished. Here are the nice-to-know answers:
How many days has the PROBA2 spacecraft been in orbit? 4238
How many images had the SWAP imager onboard taken by June 8, 2021? 2 452 977
How many eclipses have the instruments onboard PROBA2 witnessed? 27
How many orbits had PROBA2 completed by June 8, 2021? 61 496
What was the exact time of the launch? 02:50 CET
How many scientific papers were written so far using the data from SWAP and LYRA? 120
What is the current prediction for PROBA2's orbital decay (i.e. in how many years will the satellite come down)? 90 years
What is the weight (kg) of the spacecraft? 130 kg
What is the size (m^3) of the spacecraft? 0.36 m^3
What is the average altitude (km) of the spacecraft? 755 km
How many pixels does a SWAP image have? 1 048 576
How many times has the spacecraft passed above one of the ground stations by June 8, 2021? 37 831
Congratulations to the winners and thanks for participating!
More on PROBA2: https://proba2.sidc.be
Review of solar activity
The solar activity was very low. Three active regions were observed. NOAA 2832 (alpha) and NOAA 2833/Catania sunspot group 7 (alpha) were visible from the beginning of the week and were classified as type alpha. On June 16th NOAA 2832 rotated behind the west solar limb and on June 17th NOAA 2834/Catania sunspot group 8 (beta) emerged. On June 19th NOAA 2833/Catania sunspot group 7 developed trailing spots. The complexity of its underlying magnetic field changed to beta-gamma on June 19th and beta on June 20th. All three active regions were stable throughout the week and did not produce any significant flaring activity.
The X-ray flux remained below C-class flare level for the whole week.
Multiple Coronal Mass Ejections (CMEs) lifted off the solar surface last week, but none were estimated to have an Earth-directed component and there were no ICMEs impacting the Earth during the past week.
The greater than 10 MeV proton flux remained at background levels.
The greater than 2 MeV electron flux exceeded the 1000 pfu threshold on June 17th and remained predominantly above the threshold throughout the rest of the week.
Respectively, the electron fluence increased from nominal to moderate levels on June 17th and remained at moderate levels throughout the rest of the week.
The International Sunspot Number by Silso
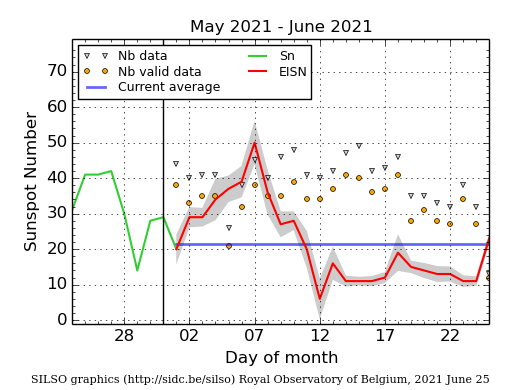
The daily Estimated International Sunspot Number (EISN, red curve with shaded error) derived by a simplified method from real-time data from the worldwide SILSO network. It extends the official Sunspot Number from the full processing of the preceding month (green line), a few days more than one solar rotation. The horizontal blue line shows the current monthly average. The yellow dots gives the number of stations that provided valid data. Valid data are used to calculate the EISN. The triangle gives the number of stations providing data. When a triangle and a yellow dot coincide, it means that all the data is used to calculate the EISN of that day.
PROBA2 Observations (14 Jun 2021 - 20 Jun 2021)
Solar Activity
Solar flare activity was very low during the week.
In order to view the activity of this week in more detail, we suggest to go to the following website from which all the daily (normal and difference) movies can be accessed: https://proba2.oma.be/ssa
This page also lists the recorded flaring events.
A weekly overview movie can be found here (SWAP week 586): https://proba2.sidc.be/swap/data/mpg/movies/weekly_movies/weekly_movie_2021_06_14.mp4
Details about some of this week's events can be found further below.
If any of the linked movies are unavailable they can be found in the P2SC movie repository here: https://proba2.oma.be/swap/data/mpg/movies/
Thursday Jun 17

A narrow eruption and associated dimming was observed by SWAP in the north-east quadrant of the solar disk on 2021-Jun-17, as shown in the SWAP image above taken at 07:51 UT.
Find a movie of the entire day here: https://proba2.sidc.be/swap/movies/20210617_swap_movie.mp4 (SWAP movie) and here: https://proba2.sidc.be/swap/movies/20210617_swap_diff.mp4 (SWAP difference movie).
Review of geomagnetic activity
During the past week, a high speed stream (HSS) originating from a high-latitude extension of the negative polarity southern polar coronal hole, which crossed the central meridian on June 11th arrived near Earth. Late June 14th/early June 15th, DSCOVR and ACE registered the expected arrival of a co-rotating interaction region (CIR) followed by the HSS on June 15th. The interplanetary magnetic field switched from the positive to the negative polarity matching the geo-effective coronal hole. The solar wind speed increased from 321 km/s to 633 km/s. The total magnetic field reached a maximum of 16 nT, while the Bz component reached a minimum of -14 nT around noon on June 15th.
From June 16th onwards the total magnetic field and its north-south component have remained mostly undisturbed with rather low values. Solar wind speeds above 600 km/s persisted on June 16th, while from June 17th onwards a gradual and slow decrease of the solar wind speed started, resulting in speeds of about 400km/s at the end of the week.
The geomagnetic conditions throughout the week varied from quiet to a minor storm. The week started with quiet geomagnetic conditions until early afternoon of June 15th, when unsettled to active conditions set in with the arrival of the CIR, followed by an isolated period of global minor storm registered by Kp NOAA between 18:00 and 21:00 UTC on June 15th. In Dourbes, only active conditions were recorded. Active conditions persisted in the early morning of June 16th since when only unsettled conditions were observed with a gradual return to quiet conditions on June 18th. Quiet conditions remained throughout the rest of the week.
Geomagnetic Observations at Dourbes (14 Jun 2021 - 20 Jun 2021)

The SIDC Space Weather Briefing
The Space Weather Briefing presented by the forecaster on duty from June 12 to 20. It reflects in images and graphs what is written in the Solar and Geomagnetic Activity report.

A pdf-version: https://www.stce.be/briefings/20210621_SWbriefing.pdf
The movie: https://www.stce.be/briefings/20210621_SWbriefing.m4v
Review of ionospheric activity (14 Jun 2021 - 20 Jun 2021)
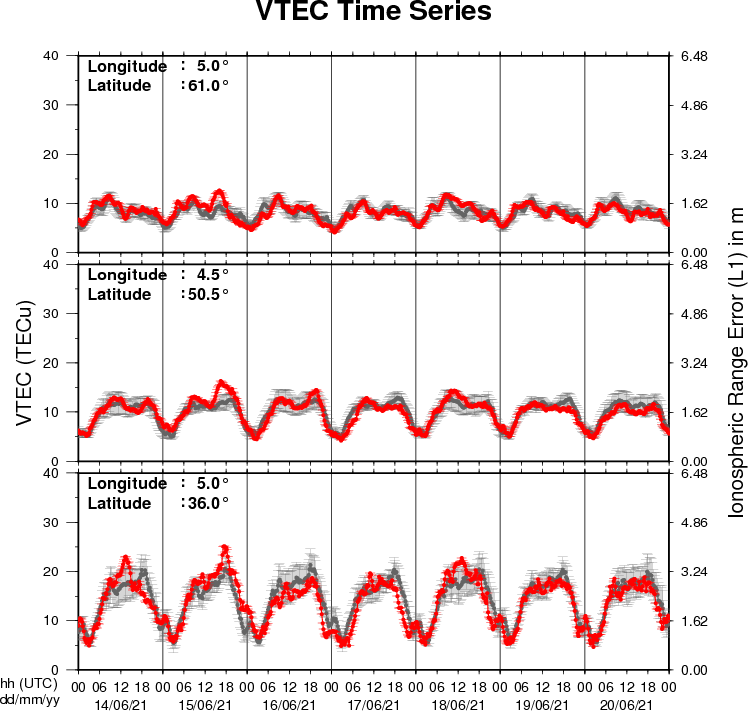
The figure shows the time evolution of the Vertical Total Electron Content (VTEC) (in red) during the last week at three locations:
a) in the northern part of Europe(N61°, 5°E)
b) above Brussels(N50.5°, 4.5°E)
c) in the southern part of Europe(N36°, 5°E)
This figure also shows (in grey) the normal ionospheric behaviour expected based on the median VTEC from the 15 previous days.
The VTEC is expressed in TECu (with TECu=10^16 electrons per square meter) and is directly related to the signal propagation delay due to the ionosphere (in figure: delay on GPS L1 frequency).
The Sun's radiation ionizes the Earth's upper atmosphere, the ionosphere, located from about 60km to 1000km above the Earth's surface.The ionization process in the ionosphere produces ions and free electrons. These electrons perturb the propagation of the GNSS (Global Navigation Satellite System) signals by inducing a so-called ionospheric delay.
See http://stce.be/newsletter/GNSS_final.pdf for some more explanations ; for detailed information, see http://gnss.be/ionosphere_tutorial.php