- Table of Content
- 1.First X-class ...
- 2.The ESWC decid...
- 3.The STCE in 20...
- 4.Review of sola...
- 5.Noticeable Sol...
- 6.The Internatio...
- 7.PROBA2 Observa...
- 8.Review of geom...
- 9.Geomagnetic Ob...
- 10.The SIDC Space...
- 11.Review of iono...
2. The ESWC decides its new future organisation!!!
3. The STCE in 2019
4. Review of solar activity
5. Noticeable Solar Events (28 Jun 2021 - 4 Jul 2021)
6. The International Sunspot Number by Silso
7. PROBA2 Observations (28 Jun 2021 - 4 Jul 2021)
8. Review of geomagnetic activity
9. Geomagnetic Observations at Dourbes (28 Jun 2021 - 4 Jul 2021)
10. The SIDC Space Weather Briefing
11. Review of ionospheric activity (28 Jun 2021 - 4 Jul 2021)
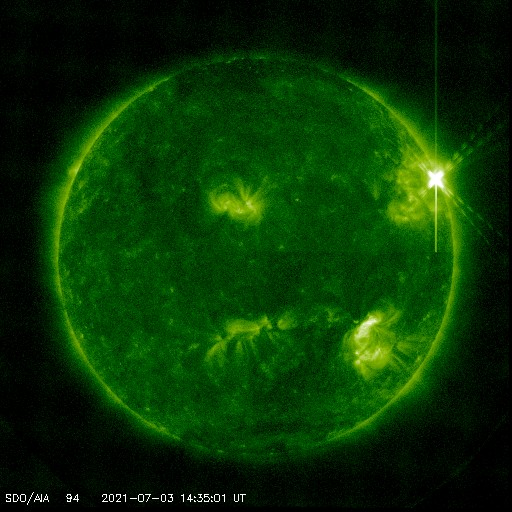
First X-class flare of SC25
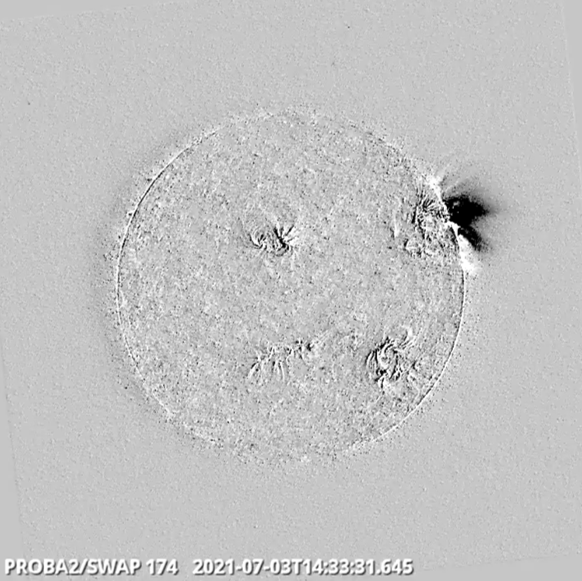
An X1.5 flare was produced on 3 July (peak at 14:29UT) by a region that started to develop only late on the previous day. Its location was very close to the northwest limb making an accurate assessment of its magnetic complexity difficult. NOAA 2838 rotated over the solar limb on 4 July, producing 5 C-, 3 M- and 1 X-class flare (See the STCE's SWx classifications page at https://www.stce.be/educational/classification for further info). The SDO/AIA 094 (https://sdo.gsfc.nasa.gov/data/aiahmi/ ) shows the flare shortly after its peak in extreme ultraviolet (EUV). Also the SWAP instrument onboard PROBA2 (https://proba2.sidc.be/ssa ) recorded the blast (see the difference image in EUV).
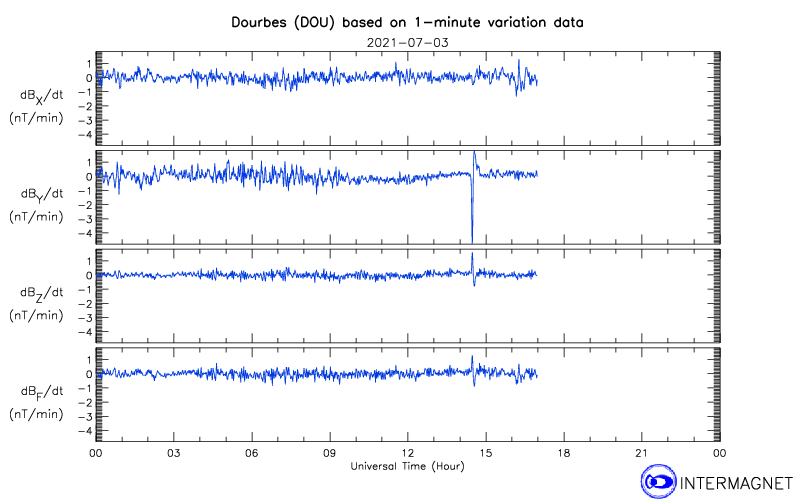
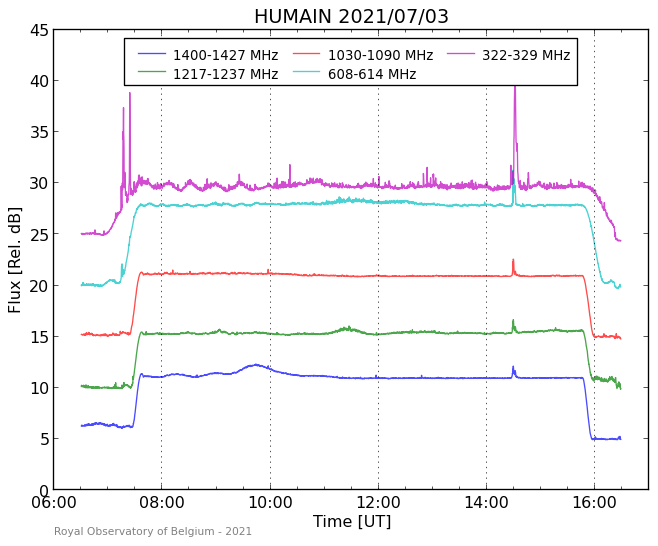
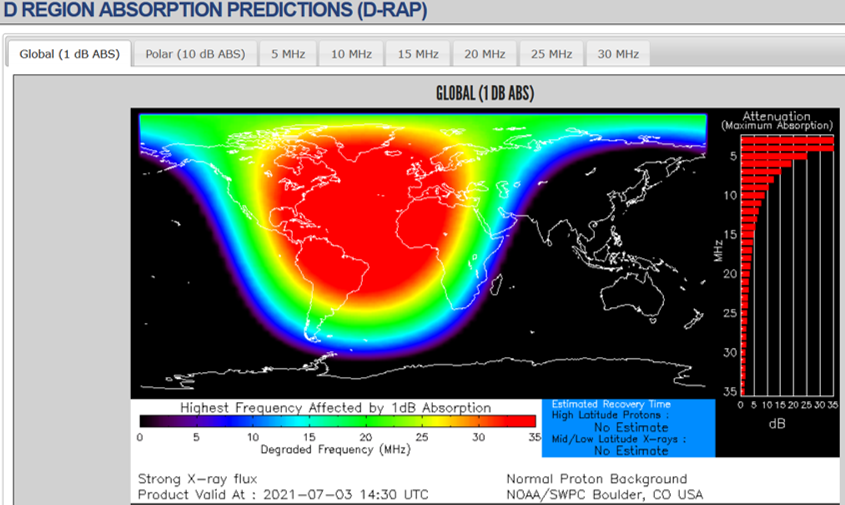
The flare was the source of a small solar flare effect (only a few nT) in magnetometer readings by the Geophysical Observatory in Dourbes (data via Intermagnet https://www.intermagnet.org/data-donnee/dataplot-eng.php ), and was also recorded as a brief enhancement on some radio frequencies by the Humain Solar Observatory (http://www.sidc.be/humain/humain_spectra_realtime.php ). HF communications were most likely briefly disturbed over Greenland, the North Atlantic and Brazil (D-RAP - https://www.swpc.noaa.gov/products/d-region-absorption-predictions-d-rap ). See the respective images underneath.
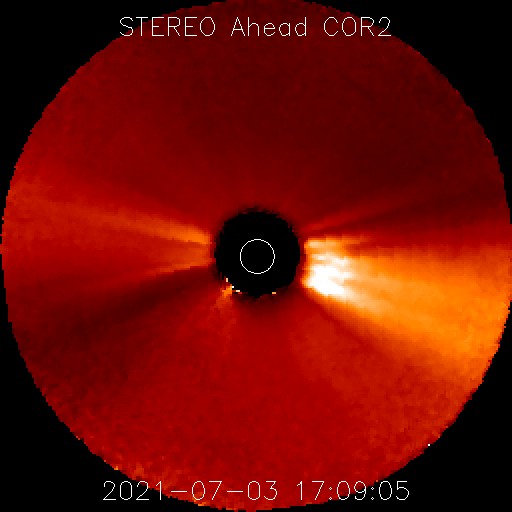
A weak Type II radio burst was reported by NOAA/SWPC and recorded (https://www.stce.be/sites/default/files/field/image/HUMAIN_20210703_130000_160000.png ) by the Humain Solar Observatory (See the STCE's SWx classifications page at https://www.stce.be/educational/classification for further info). STEREO-A coronagraphic imagery (https://stereo-ssc.nascom.nasa.gov/beacon/beacon_secchi.shtml ) showed the associated coronal mass ejection starting about an hour after the X-class flare. However, just as for the CME associated with the M2 flare earlier on the day, this CME does not seem to have an earth-directed component.
The X1 flare was the first X-class flare of solar cycle 25 and the first since the X8 event on 10 September 2017 (see e.g. this STCE Newsitem at https://www.stce.be/news/402/welcome.html ), meaning 1391 days without X-class events. Other noteworthy droughts since the start of the systematic GOES observations in 1976 were from 14 December 2006 till 15 February 2011 (1523 days) and from 3 November 1992 till 9 July 1996 (1343 days).
The ESWC decides its new future organisation!!!
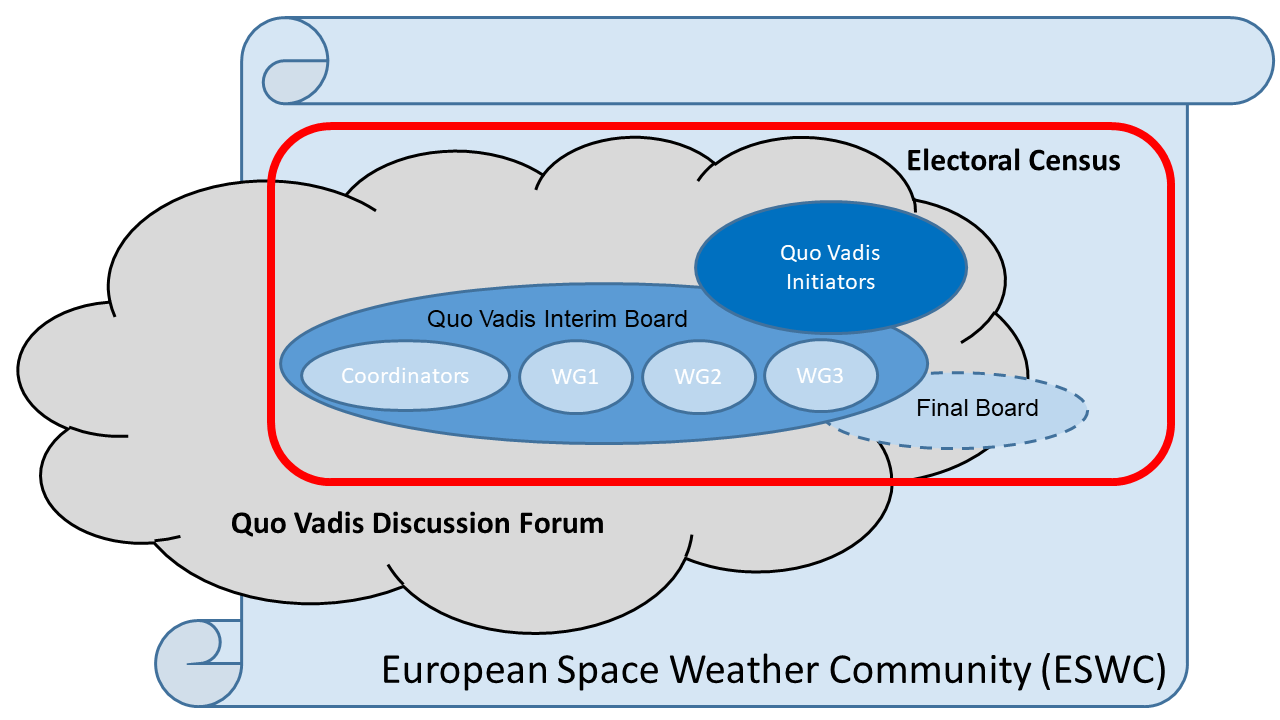
In the recent months, the European Space Weather and Space Climate Community (ESWC) started to work out a uniting organisation to help the community to sustain and develop the successful efforts made thus far (https://quovadis.aeronomie.be/index.php). A first vote was held from June 28 to 30 in order to decide what and how it should be implemented. 289 electors registered to the electoral census. Amongst the voters, 92% answered « yes » to the question « Should the European Space Weather and Space Climate Community establish an organisation to coordinate and represent it?”
The second question was to choose the type of organisation. 54% voted for an independent International Non-Profit Association, 26% to join the European Physical Society as a Division and 20% had no preference.
Based on the outcome of the vote, the Interim Board will work to establish a new International Non-Profit Association. A public discussion will be open in September to the international community (not restricted to Europe) to get advice and comments in real time through a Slack forum. This discussion will include a call for proposals on how to name the new organisation. In parallel, the statutes will be prepared and the legal aspects will be set. The electoral census will be reopened, in order to let new voters join.
The plan is to create this new organisation in the days following the ESWW 2021. An exciting time to come!
If you have any questions, please contact quovadis@space-weather.eu
The STCE in 2019
The STCE Annual Report 2019 is now available at https://www.stce.be/annualReport
It is a compilation of the activities done in 2019 within the frame of the Solar-Terrestrial Centre of Excellence (STCE). This report continues the style from the previous editions. Hence, as it is targeting a more general public, it presents only a selection of the 2019-activities in easy-to-digest summaries.
These bite-sized articles emphasize the intense collaboration between the institutes at the Space Pole, as well as with our external partners. It covers e.g. contributions on 50 years of ozonesonde measurements at Uccle, on the 10th anniversary of PROBA2, on the new neutron monitor in Dourbes, on the start of our tailored services to the civil aviation (PECASUS),... amongst many other topics. But also for those who want to know about the climate marches, about snowballs or even about gambling during a scientic conference, this annual report offers a glimpse of the life at the Space Pole.
We wish you an enjoyable reading experience!

Review of solar activity
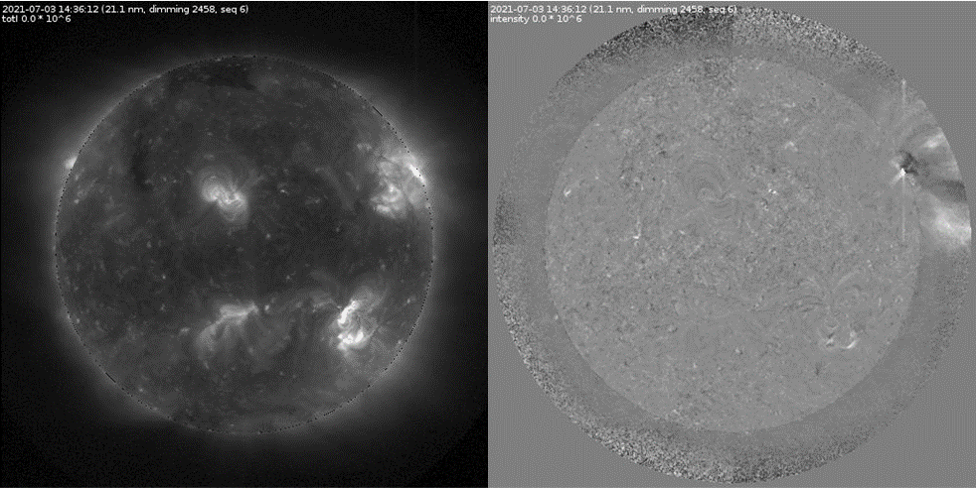
The main flaring events of the period were featured by a rapidly emerging region (NOAA 2838) on July 3. The region produced three M-class flares and an X1.5 flare peaking at 14:29UT on July 3. The region emerged close to the northwest limb and hence could not be analysed in detail while it rotated off the disc by the end of the week. This was the first X-class flare since 10 September 2017 and the first X-class flare of the new cycle. The image underneath was compiled via SolarDemon (https://wwwbis.sidc.be/solardemon/dimmings.php?did=2458) based on SDO/AIA 211 imagery (difference image on the right).
At the start of the week there were two beta regions: NOAA region 2835 and a new region 2836 emerging to the southwest of 2835. Especially 2835 grew over the week and developed mixed magnetic fields in the intermediate region. It had significant flaring potential throughout the week, but only produced a number of C-class flares, the strongest of which a C3.6 flare peaking at 18:15UT on June 30. During the week, another region emerged in the northern solar hemisphere (NOAA region 2837) but by the end of the week both NOAA 2836 and 2837 were in decay.
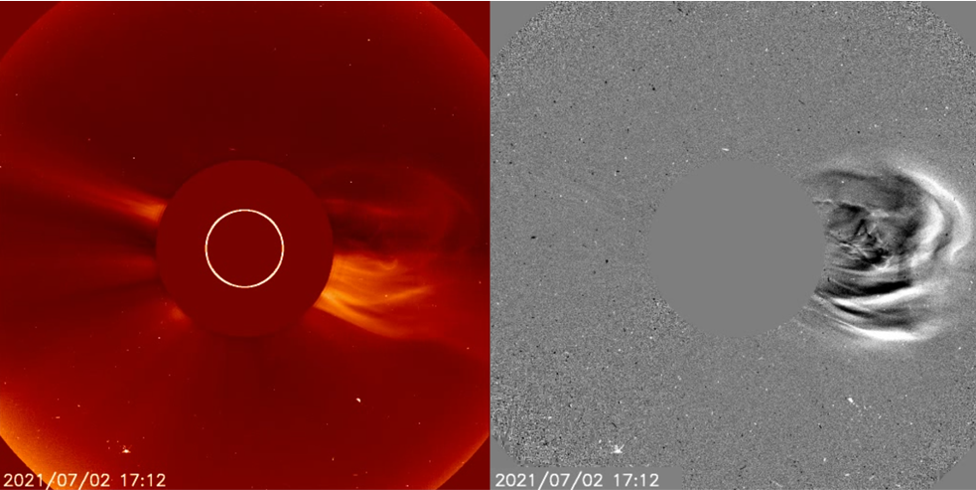
A number of filament eruptions and coronal mass ejections (CMEs) have been observed throughout the week of which 2 were assessed to possibly have an Earth directed component. A westward CME is seen in SoHO/LASCO coronagraphic imagery from around 4UT June 27 onwards. Its angular width is around 110 degrees. The same CME is visible from STEREO-A/COR2 data, as directly westward from STEREO-A perspective. It is most likely associated with a dimming that can be seen just to the west of the disc center between 1-5UT on June 27. As a consequence, the CME was estimated to be directed only just to the west of the Sun-Earth line and a glancing blow could not be excluded. The CME was measured to have a rather low speed of between 300-350 km/s and a possible arrival was expected around the afternoon of July 1. One of the CMEs can be seen underneath in the SOHO/LASCO C2 coronagraphic imagery.
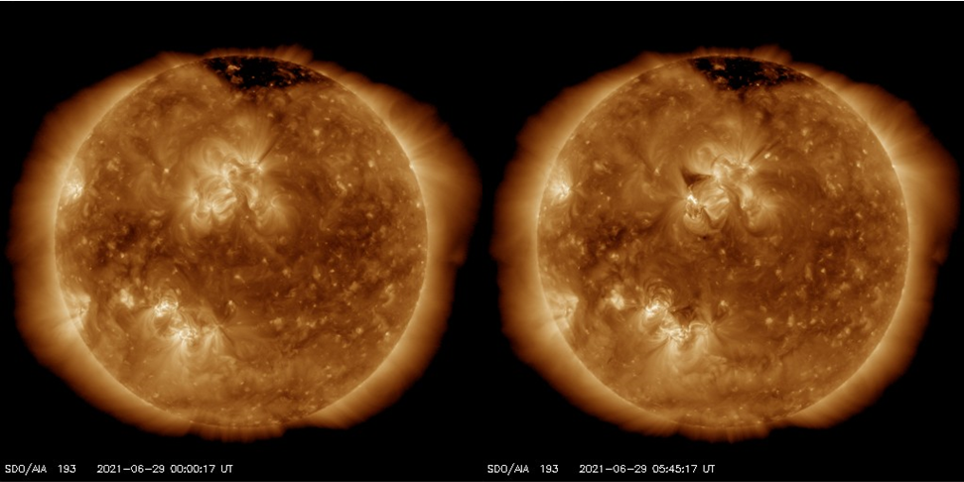
A dimming is seen in SDO AIA imagery at around 5:16UT June 29 - See the images underneath. It originates from a location near N15E10 which is the southeastern area of the large plage region in the northern hemisphere. Coronagraph data from STEREO-A display a CME towards the west from 11:53UT onwards. SoHO/LASCO coronagraph data are not so clear and the signature is faint. The most clear part is visible from around 6:24UT towards the east. The CME direction and speed were thus hard to establish based on the available coronagraph data. Combined with the location of the source region on disc we estimated that an arrival of an associated CME was not excluded and could occur around noon July 3, although confidence was low on that forecast. All other CMEs were assessed to not be Earth-directed.
The greater than 10 MeV proton flux showed a slight enhancement following the X-class flare, but remained below 1 pfu and thus well below the 10 pfu event threshold. The greater than 2 MeV electron flux was below the 1000 pfu event threshold. The 24h electron fluence was at normal levels.
Noticeable Solar Events (28 Jun 2021 - 4 Jul 2021)
| DAY | BEGIN | MAX | END | LOC | XRAY | OP | 10CM | TYPE | Cat | NOAA |
| 03 | 0704 | 0717 | 0722 | N23W78 | M2.7 | SF | 2838 | |||
| 03 | 1418 | 1429 | 1434 | N24W81 | X1.5 | SN | III/3II/1 | 2838 | ||
| 03 | 1659 | 1703 | 1714 | N24W82 | M1.0 | SF | 2838 | |||
| 04 | 0501 | 0509 | 0515 | S0E0 | M1.5 | SF | 2838 |
| LOC: approximate heliographic location | TYPE: radio burst type |
| XRAY: X-ray flare class | Cat: Catania sunspot group number |
| OP: optical flare class | NOAA: NOAA active region number |
| 10CM: peak 10 cm radio flux |
The International Sunspot Number by Silso
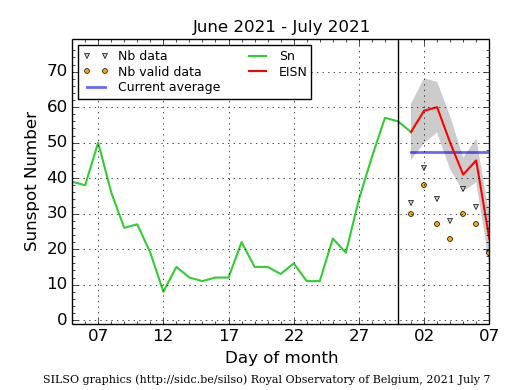
The daily Estimated International Sunspot Number (EISN, red curve with shaded error) derived by a simplified method from real-time data from the worldwide SILSO network. It extends the official Sunspot Number from the full processing of the preceding month (green line), a few days more than one solar rotation. The horizontal blue line shows the current monthly average. The yellow dots represent the number of stations that provided valid data. Valid data are used to calculate the EISN. The triangle gives the number of stations providing data. When a triangle and a yellow dot coincide, it means that all the data are used to calculate the EISN of that day.
PROBA2 Observations (28 Jun 2021 - 4 Jul 2021)
Solar Activity
Solar flare activity fluctuated from very low to high during the week.
In order to view the activity of this week in more detail, we suggest to go to the following website from which all the daily (normal and difference) movies can be accessed: https://proba2.oma.be/ssa
This page also lists the recorded flaring events.
A weekly overview movie can be found here (SWAP week 588): https://proba2.sidc.be/swap/data/mpg/movies/weekly_movies/weekly_movie_2021_06_28.mp4
Details about some of this week's events can be found further below.
If any of the linked movies are unavailable they can be found in the P2SC movie repository here: https://proba2.oma.be/swap/data/mpg/movies/
Saturday Jul 03
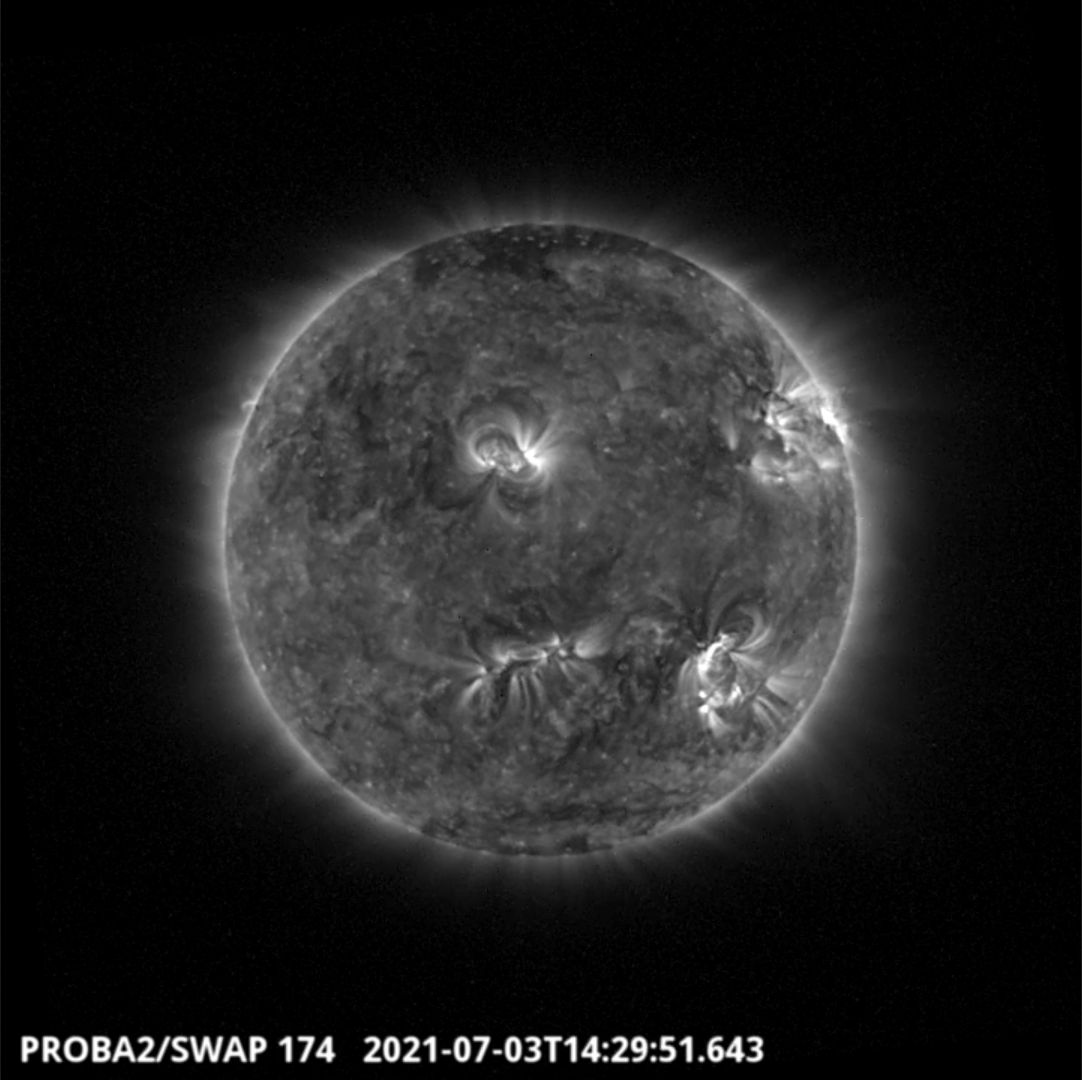
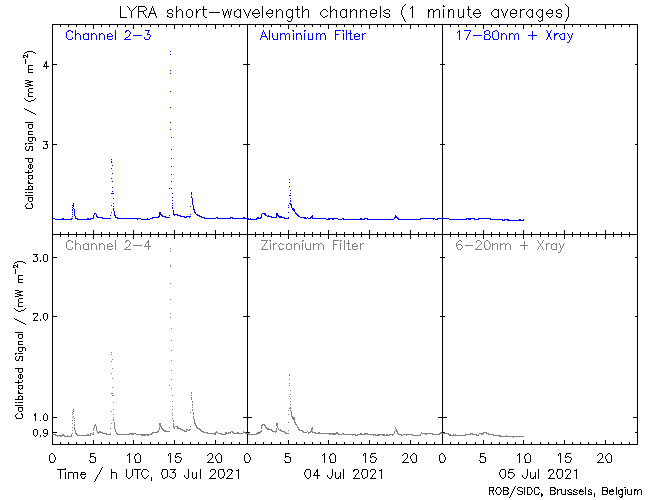
In addition to 3 M-class flares, NOAA Active Region 2838 produced an X1.5 flare, peaking at 14:29 UT, which is the first X-class flare to occur in almost four years! The flare was observed by SWAP and LYRA and is visible in the SWAP image above on the north-west limb of the Sun on 2021-Jul-03.
Find a movie of the event here (SWAP movie): https://proba2.sidc.be/swap/movies/20210703_swap_movie.mp4
Review of geomagnetic activity
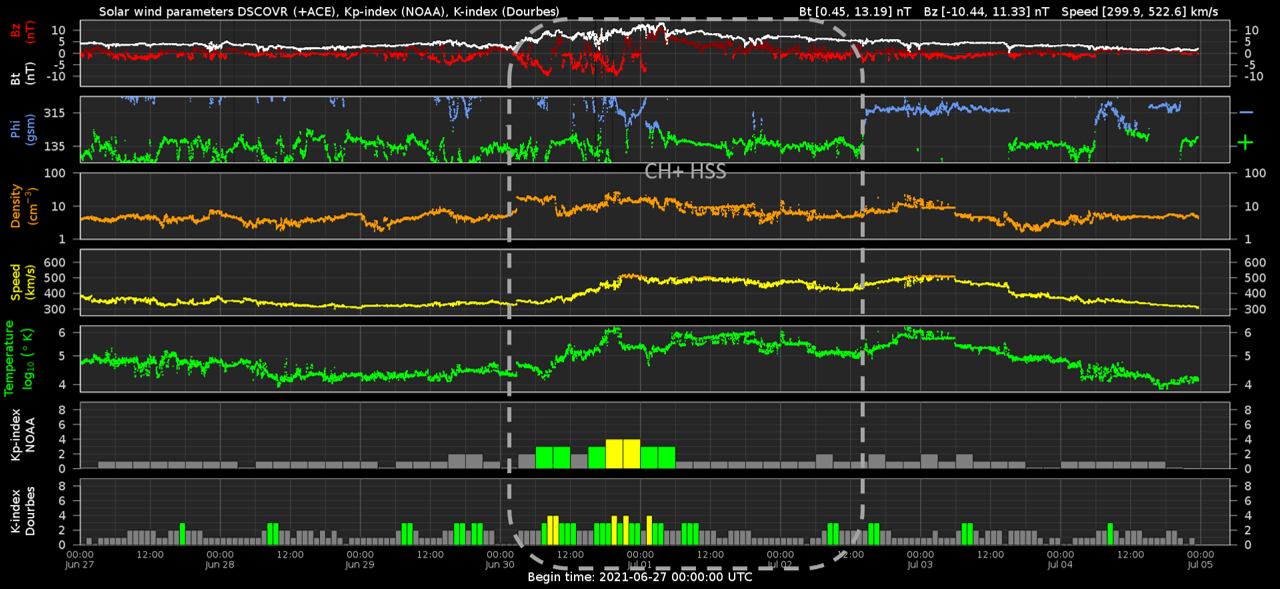
Solar wind conditions were in a nominal slow solar wind regime until 2:47UT June 30 when a small fast forward shock occurred which was then followed by a build up of the magnetic field strength and later in the day the increase of solar wind speed to over 500 km/s. This was the anticipated arrival of the high speed stream from a positive polarity coronal hole transiting central meridian on June 27. The magnetic field reached a strength of 13nT with some periods of strong negative values for the Bz component down to -10nT. Some features of magnetic field rotation can be identified but it is hard to make any clear identification of the possible arrival of the June 27 CME.
Solar wind speed was only briefly over 500 km/s but saw a somewhat unexpected renewed increase above 500km/s around midnight July 2 to 3. At that time the phi angle had also switched into the towards section for a while. Afterwards, solar wind speed declined again to nominal slow solar wind conditions and there was no sign of a possible arrival of the June 29 CME.
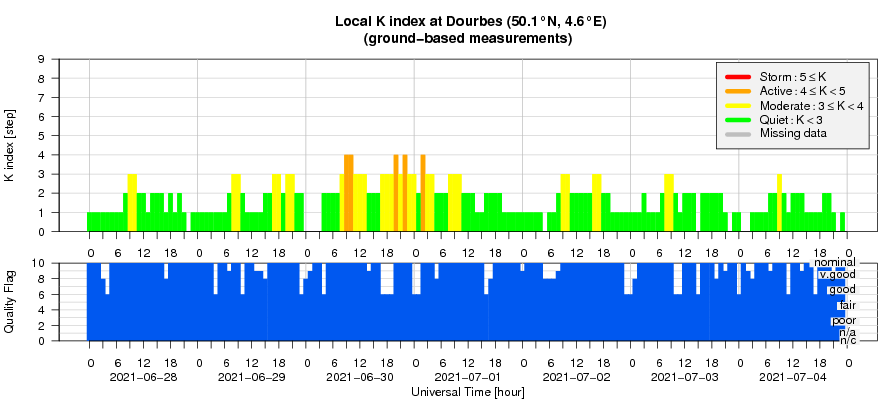
Geomagnetic conditions became active (K=4) for some periods associated to the high speed stream arrival, but were otherwise quiet to unsettled (NOAA Kp 0-2, K Dourbes 0-3).
Geomagnetic Observations at Dourbes (28 Jun 2021 - 4 Jul 2021)
The SIDC Space Weather Briefing
The Space Weather Briefing presented by the forecaster on duty from June 28 to July 04. It reflects in images and graphs what is written in the Solar and Geomagnetic Activity report.
A pdf-version: https://www.stce.be/briefings/20210705_SWbriefing.pdf
The movie: https://www.stce.be/briefings/20210705_SWbriefing.wmv (300MB, incl. clips)
Review of ionospheric activity (28 Jun 2021 - 4 Jul 2021)
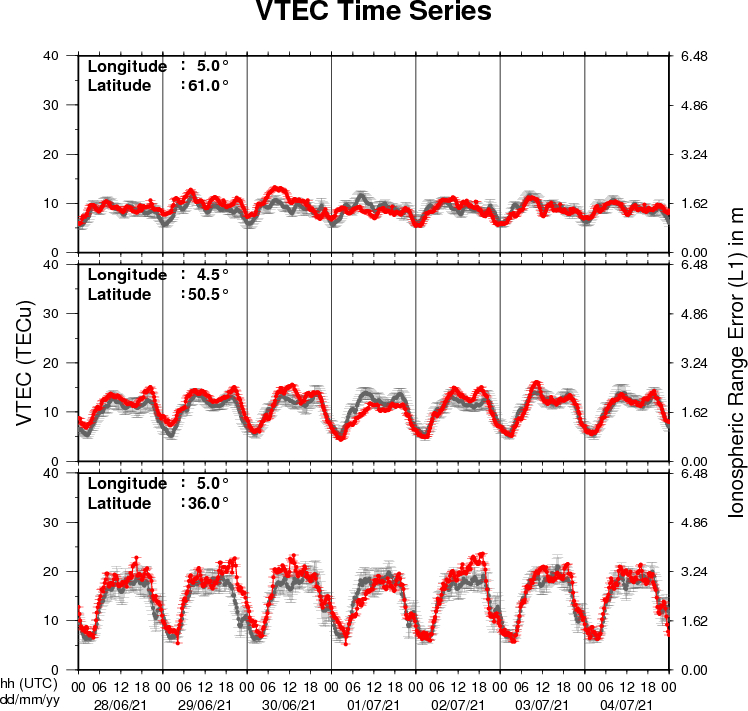
The figure shows the time evolution of the Vertical Total Electron Content (VTEC) (in red) during the last week at three locations:
a) in the northern part of Europe(N61°, 5°E)
b) above Brussels(N50.5°, 4.5°E)
c) in the southern part of Europe(N36°, 5°E)
This figure also shows (in grey) the normal ionospheric behaviour expected based on the median VTEC from the 15 previous days.
The VTEC is expressed in TECu (with TECu=10^16 electrons per square meter) and is directly related to the signal propagation delay due to the ionosphere (in figure: delay on GPS L1 frequency).
The Sun's radiation ionizes the Earth's upper atmosphere, the ionosphere, located from about 60km to 1000km above the Earth's surface.The ionization process in the ionosphere produces ions and free electrons. These electrons perturb the propagation of the GNSS (Global Navigation Satellite System) signals by inducing a so-called ionospheric delay.
See http://stce.be/newsletter/GNSS_final.pdf for some more explanations ; for detailed information, see http://gnss.be/ionosphere_tutorial.php